Last updated on 26th Apr 2025| 9826
- Introduction to Quantitative research methods
- Quantitative vs. Qualitative Research
- Data Collection in Quantitative Research
- Descriptive Statistics in Quantitative Methods
- Inferential Statistics and Hypothesis Testing
- Regression Analysis in Quantitative Research
- Time Series Analysis and Forecasting
- Quantitative Methods in Finance
- Quantitative Methods in Market Research
- Tools for Quantitative Data Analysis
- Strengths and Limitations of Quantitative Methods
- Future of Quantitative Methods in Data Science
- Conclusion
Introduction to Quantitative Research Methods
Quantitative methods refer to systematic approaches used to collect, analyze, and interpret numerical data. Data Science Course Training methods are essential in scientific research, business analysis, and data science, as they enable researchers to make data-driven decisions. quantitative research methods rely on statistical models, mathematical calculations, and empirical measurements to draw conclusions. By applying these methods, researchers can identify patterns, test hypotheses, and make predictions based on measurable data.
Quantitative vs. Qualitative Research
While both quantitative and qualitative research are used for data analysis, they differ significantly:
- Quantitative Research: Involves numerical data and uses statistical methods for analysis. It focuses on objective measurement and generalization of findings. Quantitative methods are ideal for hypothesis testing and identifying trends. It often uses tools like surveys, experiments, and structured observations. Data is analyzed using techniques such as regression, correlation, and statistical modeling. Results are typically presented in graphs, tables, and numerical summaries to support conclusions.
- Qualitative Research: Involves non-numerical data such as interviews, observations, and text analysis. Hypothesis Testing in Data Science emphasizes subjective interpretation of data. Qualitative methods are better suited for exploring experiences and motivations. It employs methods like open-ended interviews, focus groups, and content analysis. Data is interpreted through themes, narratives, and patterns rather than statistical outputs. Findings provide in-depth insights into human behavior, emotions, and social contexts.
Become a Data Science expert by enrolling in this Data Science Online Course today.
Data Collection in Quantitative Research
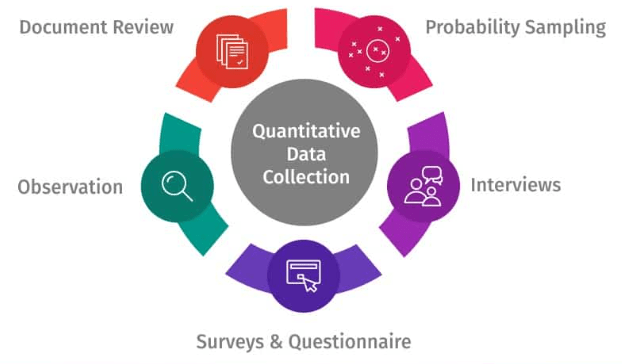
Data collection is the foundation of quantitative research. Effective data collection ensures the accuracy and reliability of quantitative analysis. Common methods include:
- Surveys and Questionnaires: Structured forms with closed-ended questions to gather statistical data.
- Experiments: Controlled environments where variables are manipulated to observe effects.
- Observational Studies: Collecting data through systematic observation without intervention.
- Existing Data and Records: Utilizing public datasets, Website Analytics records, or government data for analysis.
Descriptive Statistics in Quantitative Methods
Descriptive statistics summarize and describe the main features of a dataset. Descriptive statistics help simplify large datasets and present meaningful insights through visualizations and summaries. It includes:
- Measures of Central Tendency: Mean, median, and mode to represent the center of the data.
- Measures of Dispersion: Range, variance, and standard deviation to show data spread.
- Frequency Distributions: Tables or charts showing how frequently values occur.
- Hypothesis Testing: Determines whether the difference between groups is statistically significant.
- Confidence Intervals: Estimates the range where the true population parameter lies.
- P-values: Measure the likelihood of observing the data if the null hypothesis is true.
- Linear Regression: Models the relationship between two variables using a straight line.
- Multiple Regression: Analyzes the effect of two or more independent variables on a dependent variable.
- Logistic Regression: Used for binary classification problems (e.g., success vs. failure).
- Risk Assessment: Using statistical models to measure and manage financial risks.
- Portfolio Optimization: Quantitative techniques optimize asset allocation for maximum returns.
- Valuation Models: Regression and time series models estimate company valuations and Data Mining Architecture stock prices.
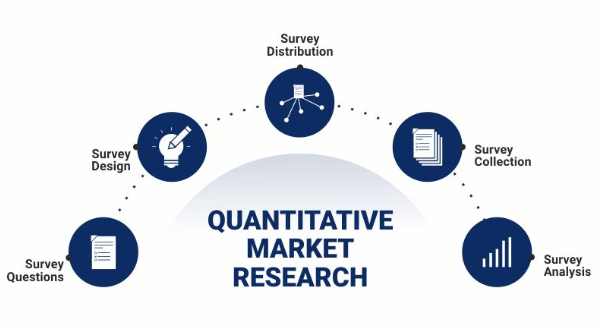
- Customer Surveys: Structured questionnaires collect quantitative feedback on products or services.
- Conjoint Analysis: Measures consumer preferences by evaluating different product attributes.
- Market Segmentation: Uses clustering and regression models to group consumers by similar behaviors.
- Excel: Widely used for basic statistical analysis and data visualization.
- SPSS: A powerful tool for statistical testing and data modeling.Tools for Quantitative Data Analysis
- R and Python: Open-source programming languages with libraries for data analysis and machine learning.
- Tableau and Power BI: Visualization tools that transform Lightgbm Algorithm into interactive dashboards.
- Strengths: Provides objective, measurable data. Allows for statistical testing and replication. Suitable for large-scale data analysis. Supports trend analysis and forecasting.
- Limitations: Lacks contextual depth compared to qualitative methods. May oversimplify complex social phenomena. Relies on accurate data collection; poor data quality can lead to inaccurate results. Cannot capture emotions, opinions, or motivations. While quantitative methods offer reliable, generalizable insights, combining them with qualitative approaches provides a more comprehensive analysis.
Advance your Data Science career by joining this Data Science Online Course now.
Inferential Statistics and Hypothesis Testing
Inferential statistics allow researchers to make generalizations about a population based on a sample. Inferential statistics help validate assumptions and draw conclusions beyond the sample data. Key techniques include:
Regression Analysis in Quantitative Research
Regression analysis is a statistical method used to examine relationships between variables. EDA in Data Science is widely used for predictive modeling. Regression analysis enables organizations to forecast trends, optimize strategies, and make data-driven decisions. Types of regression include:

Time Series Analysis and Forecasting
Time series analysis is a crucial technique in data science that focuses on examining data points collected or recorded at Data Science Course Training intervals to identify patterns, trends, and seasonal variations, ultimately aiding in forecasting future values. One common method, moving averages, helps smooth out short-term fluctuations to highlight the overall trend. Exponential smoothing, on the other hand, gives more weight to recent observations, making it effective for short-term forecasts. A more advanced method, ARIMA (AutoRegressive Integrated Moving Average), combines elements of autoregression, differencing, and moving averages to provide accurate and robust forecasting, especially for non-stationary data. Time series analysis is extensively applied in fields such as stock market prediction, weather forecasting, and sales analysis, where understanding and anticipating future behavior based on historical data is critical.
Quantitative Methods in Finance
Quantitative methods play a crucial role in financial analysis and decision-making. Quantitative finance helps investors and financial institutions make informed decisions based on data-driven insights. Common applications include:
Ready to excel in Data Science? Enroll in ACTE’s Data Science Master Program Training Course and begin your journey today!
Quantitative Methods in Market Research
In market research, quantitative research methods are used to analyze consumer behavior and market trends. Quantitative methods provide actionable insights, helping businesses tailor their marketing strategies effectively.
Tools for Quantitative Data Analysis
Quantitative analysis relies on specialized tools and software to process and interpret data. These tools streamline data analysis processes, making it easier to draw insights. Popular tools include:
Strengths and Limitations of Quantitative Methods
Future of Quantitative Methods in Data Science
The future of quantitative methods in data science is closely tied to advancements in statistical modeling, machine learning, and artificial intelligence. As AI-powered platforms become more sophisticated, automated data analysis will streamline tasks like data cleaning, processing, and visualization, Data Science Course Training workflows more efficient. The growth of big data analytics will further amplify the role of quantitative techniques in extracting deep insights from massive and diverse datasets. With improvements in computing power, real-time statistical analysis will become increasingly feasible, enabling quicker and more informed decision-making. Additionally, the integration of quantitative methods with AI and machine learning will enhance predictive accuracy and model performance. Together, these developments will ensure that quantitative methods remain a foundational element of data science, evolving continuously to meet the demands of a data-driven future.
Conclusion
Quantitative methods are essential for data analysis in various fields, offering reliable, measurable, and replicable results. From descriptive and inferential statistics to regression analysis and time series forecasting, these methods enable organizations to make data-driven decisions. With the rise of AI, SQL Stored Procedures , and advanced analytics tools, quantitative research methods will continue to play a pivotal role in shaping the future of data science and business intelligence.