Last updated on 21st May 2025| 9669
- Introduction to Descriptive Analytics
- Importance of Descriptive Analytics in Business
- Key Metrics and Techniques in Descriptive Analytics
- Exploratory Data Analysis (EDA) Concepts
- Data Summarization Techniques
- Data Visualization in Descriptive Analytics
- Statistical Methods Used in Descriptive Analytics
- Implementing Descriptive Analytics in Python
- Applications of Descriptive Analytics in Industries
- Limitations of Descriptive Analytics
- Descriptive Analytics vs Predictive Analytics
- Future Trends in Descriptive Analytics
Introduction to Descriptive Analytics
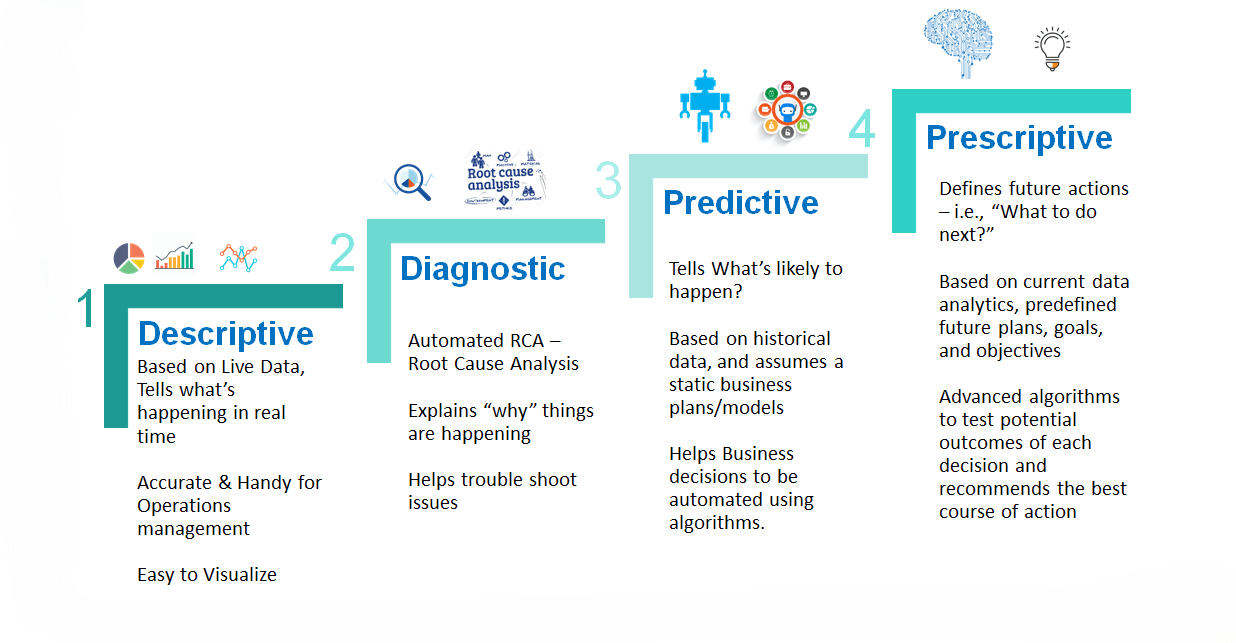
Descriptive analytics serves as the foundational layer of data analysis, focusing on the interpretation and summarization of historical data to uncover patterns, trends, and behaviors from the past. Using techniques such as data aggregation, mining, and visualization, it helps organizations derive meaningful insights into prior performance, operations, and outcomes. By examining large volumes of collected data, stakeholders can understand what occurred, how events unfolded, and why certain results emerged. Unlike predictive or prescriptive analytics, which focus on forecasting and recommending actions, descriptive analytics remains retrospective, providing essential context for deeper analysis. Often introduced early in Data Science Training it empowers individuals to convert raw data into actionable reports, dashboards, and summaries. Though not forward-looking, its strength lies in delivering a clear, comprehensive view of historical performance, forming the basis for informed decision-making and future strategy development.
Would You Like to Know More About Data Science? Sign Up For Our Data Science Course Training Now!
Importance of Descriptive Analytics in Business
Businesses rely on descriptive analytics to interpret large datasets and extract meaningful insights. It is crucial for decision-making in various industries, including finance, healthcare, marketing, and retail. Some key benefits include:
- Performance Monitoring: Companies track key performance indicators (KPIs) to evaluate success.
- Customer Insights: Analyzing purchasing behavior and preferences to improve customer experience.
- Operational Efficiency: Identifying inefficiencies and areas for process improvement.
- Risk Management: Recognizing potential risks based on historical data patterns.
By leveraging descriptive analytics, businesses can optimize strategies, enhance customer engagement, and improve overall efficiency.
Key Metrics and Techniques in Descriptive Analytics
Descriptive analytics employs a variety of techniques and metrics to help businesses and analysts transform raw data into meaningful, actionable insights. Among the most commonly used methods are measures of central tendency, including the mean, median, and mode, which are essential for summarizing large datasets by identifying typical values or central points around which data clusters. Complementing these are measures of dispersion such as standard deviation, variance, and range, which provide insight into the spread or variability within a dataset, highlighting how much the data deviates from the average. Another important technique is data aggregation, where information from multiple sources is combined to provide a more comprehensive understanding of trends and relationships. This can help organizations see the bigger picture and make more informed decisions. A deeper understanding of these practices is often introduced through What is Data Science which explores the foundational concepts and methods used to derive insights from data. Trend analysis is also widely utilized, allowing analysts to observe how data evolves over time, uncover recurring patterns, and anticipate future developments based on historical behaviors. Segmentation, another key aspect of descriptive analytics, involves categorizing data into groups based on shared characteristics or behaviors, enabling more targeted analysis and personalized decision-making. Together, these tools provide a structured way to explore
Exploratory Data Analysis (EDA) Concepts
EDA is a crucial step in descriptive analytics, used to understand data structure, detect patterns, and identify anomalies. Key EDA concepts include:
- Data Cleaning: Handling missing values, duplicates, and inconsistencies.
- Univariate Analysis: Examining individual variables.
- Bivariate Analysis: Analyzing relationships between two variables.
- Multivariate Analysis: Exploring relationships among multiple variables.
- Outlier Detection: Identifying data points that deviate from normal patterns.
EDA provides a foundation for deeper data analysis and helps ensure data accuracy.
Do You Want to Learn More About Data Science? Get Info From Our Data Science Course Training Today!
Data Summarization Techniques
Summarization techniques play a crucial role in making large and complex datasets more manageable by distilling key information into clear, concise formats. These methods help analysts extract meaningful insights without being overwhelmed by the volume of raw data. One of the most widely used approaches is descriptive statistics, which involves calculating measures such as the mean, median, mode, standard deviation, and quartiles. These statistics offer a snapshot of data distribution and variability, helping to quickly understand central tendencies and dispersion within a dataset. Frequency distributions are another essential technique, often visualized through histograms and bar charts, which illustrate how often values occur and reveal the overall shape of the data distribution. Pivot tables are particularly effective in organizing and summarizing complex data sets by allowing users to rearrange and condense data into a structured format, making it easier to identify trends and patterns. Cross-tabulation further enhances data analysis by comparing relationships between categorical variables Techniques such as What is ANOVA are also valuable in this context, as they help determine whether differences between group means are statistically significant. Together, these summarization techniques empower analysts to efficiently interpret data, identify significant trends, and communicate findings clearly to stakeholders, ultimately supporting better decision-making processes.
Data Visualization in Descriptive Analytics
Data visualization is essential in descriptive analytics, making complex data more understandable through graphical representation. Common visualization techniques include:
- Bar Charts: Comparing categorical data.
- Line Graphs: Displaying trends over time.
- Pie Charts: Showing proportions within a dataset.
- Histograms: Visualizing frequency distributions.
- Heatmaps: Highlighting correlations between variables.
- Box Plots: Identifying data spread and outliers.
Visualization tools such as Tableau, Power BI, and Matplotlib in Python enhance data interpretation and decision-making.

Statistical Methods Used in Descriptive Analytics
Statistical methods are fundamental to the process of summarizing and interpreting data, providing analysts with tools to uncover relationships, test assumptions, and derive meaningful conclusions. One of the key techniques is regression analysis, which is used to understand the relationships between variables and predict outcomes based on those relationships. This method helps identify how changes in one variable can affect another, making it a powerful tool for forecasting and decision-making. Correlation coefficients complement regression by measuring the strength and direction of the relationship between two variables, helping to determine whether associations exist and how strong they are z-scores are another valuable statistical method used to standardize data, allowing for comparisons across different datasets by indicating how far a data point is from the mean in terms of standard deviations. Hypothesis testing plays a vital role in validating assumptions, using statistical tests to determine whether observed patterns are significant or due to random chance. Additionally, ANOVA (Analysis of Variance) is employed to compare means across multiple groups, identifying whether significant differences exist among them. These techniques are often emphasized in Data Science Training where professionals learn to apply statistical methods effectively to extract actionable insights and support informed, evidence-based strategic decisions.
Want to Pursue a Data Science Master’s Degree? Enroll For Data Science Masters Course Today!
Implementing Descriptive Analytics in Python
Python is a powerful tool for performing descriptive analytics. Key libraries include:
- Pandas: Handling and analyzing structured data.
- NumPy: Performing numerical operations.
- Matplotlib & Seaborn: Creating visualizations.
- Scipy: Implementing statistical functions.
- Statsmodels: Conducting regression and statistical analysis.
- import pandas as pd
- import seaborn as sns
- import matplotlib.pyplot as plt
- data = pd.read_csv(“dataset.csv”)
- print(data.describe())
- sns.histplot(data[‘sales’],
- bins=20, kde=True)
- plt.show()
- Lack of Predictive Insights: It only explains past trends without forecasting future outcomes.
- Data Overload: Large datasets can be challenging to interpret without effective tools.
- Potential Bias: Misinterpretation or poor data quality can lead to incorrect conclusions.
- Limited Actionability: Insights require further analysis for strategic decision-making.
A basic example of descriptive analytics in Python:
This code provides statistical summaries and a histogram for the sales variable, offering quick insights into data distribution.
Applications of Descriptive Analytics in Industries
Descriptive analytics is extensively utilized across a wide range of industries, serving as a critical tool for understanding past performance and guiding data-driven decision-making. In the retail sector, it helps businesses analyze sales trends and customer preferences, allowing for more effective inventory management, personalized marketing, and strategic planning. In healthcare, descriptive analytics is used to study patient records and medical histories, enabling providers to identify common treatment outcomes, enhance care delivery, and develop more effective treatment strategies. The finance industry relies on descriptive analytics to track stock market performance, assess risk, and monitor financial trends over time, aiding in investment decisions and regulatory compliance. In marketing, it plays a key role in evaluating campaign effectiveness, measuring audience engagement, and understanding consumer behavior, which helps optimize marketing strategies and allocate resources more efficiently. Additionally, understanding What is Data Architecture can further enhance how these data systems are structured and managed for optimal performance. Within manufacturing, descriptive analytics is applied to monitor production processes, assess efficiency, and identify defect rates, leading to improved quality control and operational performance. These diverse applications demonstrate the broad relevance and impact of descriptive analytics, highlighting its ability to turn historical data into actionable insights that support strategic initiatives and improve outcomes across multiple sectors.
Limitations of Descriptive Analytics
Despite its advantages, descriptive analytics has certain limitations:
To overcome these limitations, businesses often integrate descriptive analytics with predictive and prescriptive analytics.
Descriptive Analytics vs Predictive Analytics
| Feature | Descriptive Analytics | Predictive Analytics |
|---|---|---|
| Purpose | Summarizes past data | Forecasts future trends |
| Methods Used | Data aggregation, statistics | Machine learning, predictive modeling |
| Example | Sales reports, revenue trends | Customer churn prediction, sales forecasting |
| Decision-Making | Retrospective insights | Forward-looking strategies |
While descriptive analytics helps understand past performance, predictive analytics uses statistical models and AI to anticipate future events.
Future Trends in Descriptive Analytics
As technology continues to advance, descriptive analytics is rapidly evolving, driven by innovations that enhance its efficiency, accessibility, and impact. One of the most significant trends is AI-driven automation, which streamlines the process of data summarization and reporting by reducing manual effort and increasing the speed of analysis. This allows organizations to generate insights more quickly and consistently. Real-time analytics is another emerging trend, empowering businesses to make informed decisions based on live data updates rather than relying solely on historical reports. The integration of big data has also transformed descriptive analytics by enabling the processing and analysis of vast volumes of both structured and unstructured data from diverse sources, leading to more comprehensive and nuanced insights Image Processing project plays a key role in this evolution, enhancing how visual data can be analyzed and integrated into broader analytics systems. Self-service analytics is gaining popularity as well, providing user-friendly tools that allow non-technical users to explore data and generate reports independently, thereby democratizing access to insights across an organization. Additionally, enhanced visualization tools, often powered by AI and virtual reality, are enabling more immersive and intuitive data storytelling, making complex data easier to understand and act upon. These key trends reflect how descriptive analytics is becoming more dynamic, inclusive, and powerful, continuing to shape the future of data-driven decision-making in an increasingly complex digital landscape.
Conclusion
Descriptive analytics is a crucial component of data analysis, offering organizations valuable insights into historical data that help inform strategic decision-making. By utilizing essential metrics, statistical methods, and visualization techniques, businesses can gain a clearer understanding of past performance, enabling them to optimize operations and improve outcomes. Although descriptive analytics has its limitations, when combined with predictive analytics, it becomes a powerful tool for driving innovation, enabling organizations to make more informed decisions and achieve success in a data-driven environment. As technology continues to advance, the future of descriptive analytics holds great promise, with trends pointing towards increased automation, better integration, and enhanced accessibility. These developments are also emphasized in Data Science Training where professionals learn how to convert raw data into actionable strategies, ultimately improving decision-making processes and fueling growth in an increasingly data-centric world.