Last updated on 23rd Apr 2025| 6269
- Introduction to Statistics
- Importance of Statistics in Data Science
- Descriptive vs. Inferential Statistics
- Measures of Central Tendency
- Measures of Dispersion
- Hypothesis Testing in Statistics
- Probability Distributions
- Regression Analysis in Statistics
- Correlation and Causation
- Role of Statistics in Machine Learning
- Common Statistical Errors and Pitfalls
- Conclusion and Key Insights
Introduction to Statistics
Statistics is the branch of mathematics that involves data collection, analysis, interpretation, presentation, and organization. In the context of data science, statistics provides the foundation for understanding and interpreting data and making informed decisions based on it. Through statistical methods, data scientists can uncover patterns, test hypotheses, and draw conclusions that guide business strategies, scientific research, and machine learning models. Data Science Training often includes a strong emphasis on statistics, equipping learners with the essential tools and techniques to analyze data effectively and make data-driven decisions.
Importance of Statistics in Data Science
Statistics is critical in data science because it:
- Guides Decision-Making: Helps data scientists understand data distributions and relationships, which informs business or scientific decisions.
- Informed Models: Statistical methods are often used to train machine learning models and assess their accuracy.
- Data Interpretation: Data analysis can lead to misleading or incorrect conclusions without a strong understanding of statistics.
- Identifies Patterns and Trends: Through statistical analysis, data scientists can identify hidden patterns or trends that may be overlooked.
To Explore Data Science in Depth, Check Out Our Comprehensive Data Science Course Training To Gain Insights From Our Experts!
Descriptive vs. Inferential Statistics
Descriptive statisticsDescriptive and inferential statistics are essential components of data analysis, each serving distinct roles. Descriptive statistics are used to summarize and present the key characteristics of a dataset. They include measures of central tendency, such as the mean, median, and mode, as well as measures of dispersion like range, variance, and standard deviation. Visual tools like histograms and box plots help in organizing and illustrating data clearly. While descriptive statistics provide a comprehensive overview of the data, they do not support predictions or conclusions beyond the observed information.
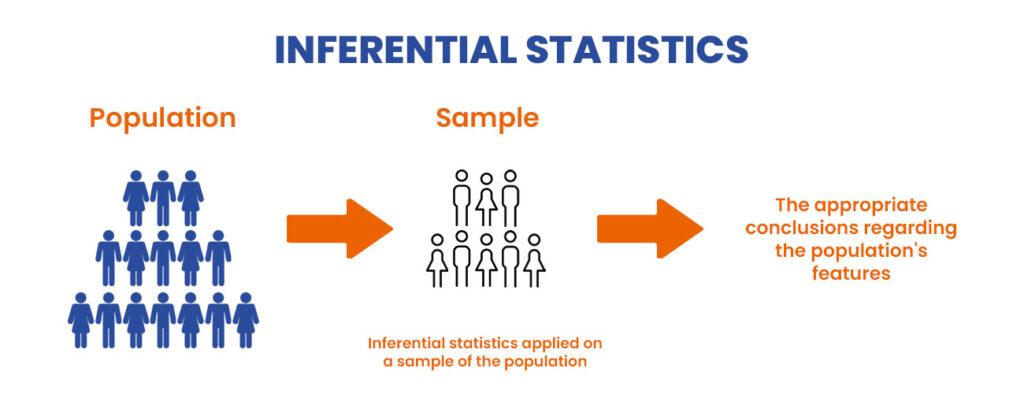
Inferential statisticsIn contrast, inferential statistics are used to make generalizations or predictions about a broader population based on a sample. Techniques such as hypothesis testing help evaluate assumptions about the population, confidence intervals provide estimated ranges for population parameters, and regression analysis identifies relationships between variables. Through inferential statistics, data professionals can draw meaningful conclusions, make forecasts, and test hypotheses, even when dealing with incomplete or limited data. Data Science Training often covers these inferential techniques in depth, preparing learners to apply them effectively in real-world scenarios.
Measures of Central Tendency
These are statistical measures that describe the center or typical value in a dataset:
- Mean: The arithmetic average of all values in the dataset. It is the most commonly used measure, but it can be skewed by outliers.
- Formula: Mean=∑xin\text{Mean} = \frac{\sum x_i}{n}
- Median: A dataset’s middle value when sorted in ascending or descending order. Outliers affect the median less than the mean.
- Mode: The value that appears most frequently in a dataset. A dataset can have more than one mode if multiple values occur with the same highest frequency (bimodal or multimodal).
Measures of Dispersion
Dispersion measures how spread out the values in a dataset are:
- Range: The difference between the maximum and minimum values in the dataset.
- Formula: Range=Max Value−Min Value\text{Range} = \text{Max Value} – \text{Min Value}
- Variance: The average of the squared differences from the mean. It measures how data points spread out around the mean.
- Formula: Variance=1n∑(xi−μ)2\text{Variance} = \frac{1}{n} \sum (x_i – \mu)^2
- Standard Deviation: The square root of variance. It tells us how much data deviates from the mean, and it’s commonly used to understand the spread of the data.
- Formula: Standard Deviation=Variance\text{Standard Deviation} = \sqrt{\text{Variance}}
- Normal Distribution: A symmetric, bell-shaped curve where most data points cluster around the mean. It is defined by the mean (μ) and standard deviation (σ).
- Binomial Distribution: Models the number of successes in a fixed number of trials, each with two possible outcomes (success or failure).
- Poisson Distribution: Used to model the number of occurrences of an event in a fixed interval of time or space.
- Exponential Distribution: Describes the time between events in a process where events occur constantly.
- Feature Selection: Using statistical methods like hypothesis testing or correlation analysis to identify the most essential features in a dataset.
- Model Evaluation: To evaluate the performance of machine learning models, metrics like mean squared error (MSE), accuracy, and confusion matrix are derived from statistical concepts.
- Understanding Data: Exploratory data analysis (EDA) relies heavily on descriptive statistics to understand the data distribution, outliers, and trends before applying machine learning algorithms.
- Inference: Many ML algorithms, such as linear and logistic regression, are grounded in statistical concepts.
- Sampling Bias: When the sample data does not accurately represent the population, leading to skewed results.
- Overfitting: occurs when a model becomes too complex and fits the noise in the training data rather than the underlying trend.
- Misinterpreting Correlation as Causation: Just because two variables are correlated does not mean one causes the other.
- Ignoring Assumptions: Many statistical tests, such as t-tests or ANOVA, have underlying assumptions (normality, homogeneity of variance) that, if violated, can lead to incorrect conclusions.
- Small Sample Sizes: Small datasets may not provide reliable results, and statistical tests may not have sufficient power to detect actual effects.
- Descriptive and Inferential Statistics serve different purposes in summarizing data and making predictions or generalizations.
- Hypothesis Testing is central to determining the validity of assumptions and making evidence-based decisions.
- Regression and Correlation help model relationships between variables, though it is crucial to remember that correlation does not imply causation.
- Statistics in Machine Learning is indispensable for model evaluation, feature selection, and data interpretation.
Interested in Obtaining Your Data Science Certificate? View The Data Science Course Training Offered By ACTE Right Now!
Hypothesis Testing in Statistics
Hypothesis testing is a statistical method used to assess whether the evidence in a sample supports a specific claim about a population. The process starts by defining two hypotheses: the null hypothesis (H₀), which assumes no effect or difference, and the alternative hypothesis (H₁), which proposes that there is an effect or difference. A significance level (α) is then chosen, typically 0.05, representing the risk of incorrectly rejecting the null hypothesis when it is true. A test statistic is calculated from the sample data to measure the strength of the evidence. This leads to the computation of a p-value, which reflects the likelihood of obtaining the observed results if the null hypothesis were true. If the p-value falls below the significance level, the null hypothesis is rejected. In such cases, the data is considered to provide enough support for the alternative hypothesis, indicating a statistically significant result.

Probability Distributions
A probability distribution describes how the values of a random variable are distributed. Standard probability distributions used in statistics include:
Probability distributions help understand the likelihood of different outcomes in a random process and are crucial for hypothesis testing, predictive modeling, and decision-making.
Looking to Master Data Science? Discover the Data Science Masters Course Available at ACTE Now!
Regression Analysis in Statistics
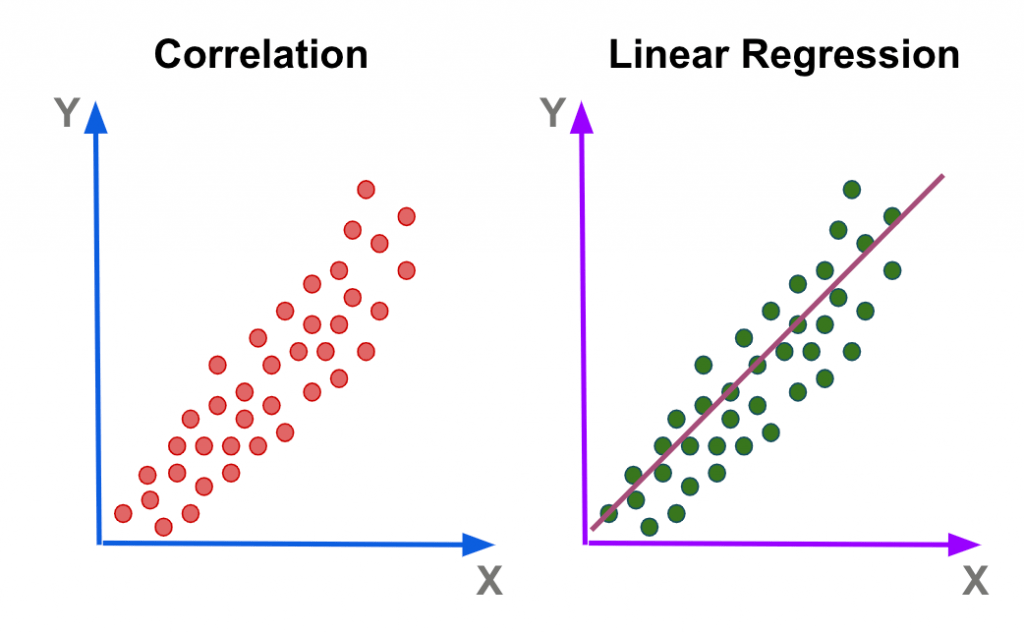
Regression analysis is a statistical method used to examine the relationship between two or more variables, enabling data scientists to understand how one variable, known as the dependent variable, changes in response to one or more independent variables. One of the most common forms is linear regression, which models this relationship by fitting a linear equation to the data. In simple linear regression, the relationship is described by the formula Y = β₀ + β₁X + ε, where Y represents the dependent variable, X is the independent variable, β₀ is the intercept, β₁ is the slope or coefficient, and ε is the error term accounting for variability not explained by the model. For more complex scenarios with many predictors, multiple linear regression is used, which extends the model to include several independent variables. In data science, regression analysis is crucial because it aids in determining and measuring correlations between variables, formulating predictions, and assessing the type and strength of these relationships.
Correlation and Causation
Correlation refers to a statistical relationship between two variables, showing how they tend to change about one another. When two variables move in the same direction—meaning as one increases, the other also increases—it is called a positive correlation. Conversely, a negative correlation occurs when one variable increases while the other decreases. The strength and direction of this relationship are measured using the correlation coefficient (r), which ranges from -1 (indicating a perfect negative correlation) to +1 (indicating a perfect positive correlation), with 0 representing no correlation at all. However, it’s important to note that correlation does not imply causation. Causation describes a direct cause-and-effect relationship between two variables, which cannot be confirmed through correlation alone. Proving causation requires controlled experimentation and in-depth data analysis to rule out other influencing factors and to establish a true causal link.
Role of Statistics in Machine Learning
Statistics plays an integral role in machine learning (ML) for:
Go Through These Data Science Interview Questions & Answer to Excel in Your Upcoming Interview.
Common Statistical Errors and Pitfalls
Conclusion and Key Insights
Statistics is a foundational component of data science, providing essential tools for understanding data, drawing conclusions, and making informed decisions. Key insights include: Data Science Training emphasizes the importance of statistical methods, enabling learners to analyze data accurately, uncover patterns, and apply statistical reasoning in various real-world applications.
Mastering these statistical concepts is vital for any aspiring data scientist to analyze data effectively, build models, and make data-driven decisions.