Last updated on 24th May 2025| 9624
- Introduction to Statistics in Data Science
- Measures of Central Tendency: Mean, Median, Mode
- Probability Theory and Its Applications
- Hypothesis Testing in Data Science
- Correlation and Regression Analysis
- Statistical Significance and p-Values
- Using Python and R for Statistical Analysis
- Conclusion
Introduction to Statistics in Data Science
Statistics plays a fundamental role in data science, serving as the backbone for analyzing, interpreting, and drawing conclusions from data. It provides the tools and techniques to understand data patterns, identify relationships, and make informed decisions based on evidence rather than assumptions. In data science, statistics is used in every stage from data collection and cleaning to exploratory analysis, model building, and validation. Key statistical concepts such as mean, median, mode, variance, standard deviation, and probability distributions in Data Science Training help summarize and describe data effectively. Inferential statistics, including hypothesis testing, confidence intervals, and p-values, allow data scientists to make predictions and generalizations about larger populations based on sample data. Moreover, statistical thinking is crucial in assessing model performance. Concepts like correlation, regression analysis, and statistical significance help in choosing the right models and evaluating their accuracy. Understanding these principles ensures that the insights drawn from data are not only accurate but also meaningful. In short, statistics equips data scientists with a critical framework to extract actionable insights, validate findings, and avoid misleading conclusions. For anyone aiming to succeed in data science, a solid grasp of statistics is not just helpful it’s essential.
Interested in Obtaining Your Data Science Certificate? View The Data Science Course Training Offered By ACTE Right Now!
Measures of Central Tendency: Mean, Median, Mode
Measures of central tendency are statistical tools used to identify the center or typical value within a dataset. The three main measures mean, median, and mode each provide a different perspective on what is considered “average,” and are foundational concepts in data analysis and data science. Top Data Science Books for Beginners & Advanced Data Scientist explain that the mean, or average, is calculated by summing all the values in a dataset and dividing by the number of values. It is useful for datasets with values that are evenly distributed but can be significantly affected by outliers or extreme values. The median is the middle value when the data is arranged in ascending or descending order. If the dataset has an odd number of values, the median is the center value; if even, it is the average of the two central numbers.
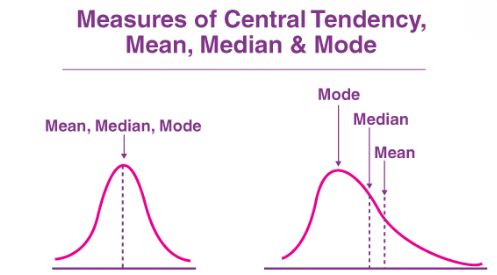
The median is particularly helpful when analyzing skewed distributions, as it is not influenced by outliers. The mode is the value that appears most frequently in a dataset. It is especially useful for categorical data or identifying common patterns. Each measure serves a unique purpose. Understanding when and how to use them helps data scientists describe data accurately, compare groups, and make informed decisions based on data behavior.
Probability Theory and Its Applications
- Definition: Probability theory is the branch of mathematics that deals with the likelihood of events occurring. It provides a framework for quantifying uncertainty and making predictions based on incomplete information.
- Basic Concepts: Core ideas include events, sample space, and probability values (ranging from 0 to 1). An event with a probability of 1 is certain to happen, while 0 means it will not occur.
- Types of Probability: Data Mining Vs. Machine Learning There are three main types theoretical probability (based on reasoning), empirical probability (based on observed data), and subjective probability (based on personal judgment or experience).
- Conditional Probability: This measures the probability of an event occurring given that another event has already occurred. It’s a crucial concept for understanding dependencies between variables.
- Bayes’ Theorem: A powerful tool for updating the probability of a hypothesis as more evidence becomes available. It’s widely used in classification tasks and decision-making.
- Random Variables and Distributions: Random variables represent outcomes of probabilistic processes. Probability distributions (e.g., normal, binomial, Poisson) describe how these values are spread.
- Applications in Data Science: Probability is used in risk assessment, machine learning algorithms, predictive modeling, and anomaly detection, making it foundational to data-driven decision-making.
- Definition: Hypothesis testing is a statistical method used to make decisions or inferences about a population based on sample data. It helps determine if there is enough evidence to support a specific claim or assumption.
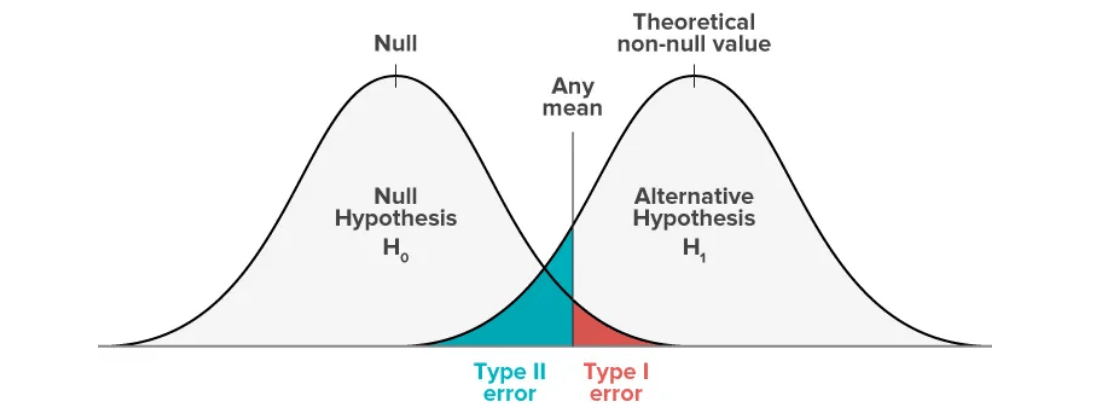
- Null and Alternative Hypotheses: The process begins with two competing statements null hypothesis (H₀), which assumes no effect or difference, and alternative hypothesis (H₁), which suggests a significant effect or relationship exists.
- Test Statistic: A test statistic (like z, t, or chi-square) is calculated from the sample data and used in Data Science Training to evaluate how consistent the data are with the null hypothesis.
- Significance Level (α): This is the threshold for determining whether to reject H₀, commonly set at 0.05. It represents the probability of rejecting the null hypothesis when it is actually true (Type I error).
- p-Value: The p-value shows the probability of obtaining results as extreme as those observed, assuming H₀ is true. If the p-value is less than α, H₀ is rejected.
- Type I and Type II Errors: Type I error occurs when H₀ is wrongly rejected; Type II error happens when H₀ is wrongly accepted.
- Application in Data Science: Hypothesis testing is widely used in A/B testing, experimental analysis, and validating machine learning model performance to ensure data-driven decisions are statistically sound.
- Statistical Significance: It indicates whether the observed results are likely due to chance or reflect a true effect. A statistically significant result means it’s unlikely the outcome happened randomly.
- Hypothesis Testing: This process involves two hypotheses: the null hypothesis (H₀), which assumes no effect or difference, and the alternative hypothesis (H₁), which suggests there is a significant effect.
- p-Value Definition: Machine Learning Vs Deep Learning The p-value is the probability of obtaining results as extreme as the observed ones, assuming the null hypothesis is true. It helps determine the strength of evidence against H₀.
- Threshold for Significance (α): Commonly set at 0.05. If the p-value is less than α, the result is considered statistically significant, and we typically reject the null hypothesis.
- Low p-Value Meaning: A p-value below 0.05 indicates strong evidence against the null hypothesis, suggesting that the effect or relationship is likely real.
- High p-Value Meaning: A high p-value (above 0.05) implies weak evidence against the null hypothesis, so we fail to reject it.
- Context Matters: Statistical significance doesn’t always mean practical importance. Results must be interpreted considering the data’s context and real-world implications.
To Earn Your Data Science Certification, Gain Insights From Leading Data Science Experts And Advance Your Career With ACTE’s Data Science Course Training Today!
Hypothesis Testing in Data Science

Correlation and Regression Analysis
Correlation and regression analysis are key statistical techniques in data science used to examine relationships between variables and make predictions. Correlation measures the strength and direction of a linear relationship between two variables. It is expressed as a correlation coefficient, typically ranging from -1 to 1. A value close to 1 indicates a strong positive relationship, meaning as one variable increases, so does the other. A value close to -1 indicates a strong negative relationship, where one variable increases as the other decreases. The Importance of Machine Learning for Data Scientists A value around 0 suggests little to no linear relationship. Correlation is useful for identifying patterns and associations but does not imply causation. Regression analysis, particularly linear regression, goes a step further by modeling the relationship between a dependent variable and one or more independent variables. It provides a mathematical equation that can be used to predict future values. Regression helps estimate the impact of changes in one variable on another, making it valuable for forecasting and decision-making. Together, correlation and regression form the foundation for understanding variable relationships in data science. They are widely applied in fields like finance, healthcare, marketing, and social sciences to uncover insights and support evidence-based strategies.
Are You Considering Pursuing a Master’s Degree in Data Science? Enroll in the Data Science Masters Course Today!
Statistical Significance and p-Values
Using Python and R for Statistical Analysis
Python and R are two of the most widely used programming languages in data science, particularly for statistical analysis. Each offers powerful libraries and tools that make it easier to handle data, perform statistical tests, and generate meaningful visualizations. Python is popular for its simplicity, readability, and versatility. It has a rich ecosystem of libraries such as NumPy for numerical computations, Pandas for data manipulation, SciPy for statistical functions, and Statsmodels for in-depth statistical modeling. Top Data Science Programming Languages include Python, which also supports data visualization through libraries like Matplotlib and Seaborn, helping in interpreting statistical results clearly. R, on the other hand, was specifically designed for statistical computing and data visualization. It comes with a wide range of built-in functions for descriptive statistics, hypothesis testing, and regression analysis. Packages like ggplot2, dplyr, and caret make R especially strong in data visualization, manipulation, and modeling. Both languages are open-source and supported by large communities, offering extensive documentation and learning resources. Python is often preferred for general purpose programming and integration into web applications, while R is favored for deep statistical analysis and academic research. Learning either or both can significantly boost your data science capabilities.
Preparing for a Data Science Job Interview? Check Out Our Blog on Data Science Interview Questions & Answer
Conclusion
In conclusion, statistics is an essential pillar of data science, providing the foundation for making sense of complex datasets. It enables professionals to analyze data accurately, identify meaningful patterns, and make informed decisions. Mastering statistical concepts allows data scientists to go beyond surface-level observations and uncover deeper insights that can guide strategic actions. From basic measures like mean, median, and mode to advanced techniques such as correlation and regression analysis, statistics plays a critical role in every stage of a data science project. Data Science Training helps in formulating hypotheses, designing experiments, and validating models to ensure their reliability and accuracy. Without statistical understanding, even the most advanced algorithms can lead to incorrect conclusions or biased results. Whether you’re exploring distributions, testing relationships between variables, or building predictive models, a strong grasp of statistics empowers you to approach problems with confidence and precision. Tools like Python and R further enhance this capability, offering practical ways to apply statistical methods in real-world scenarios. Ultimately, statistics equips data scientists with the tools needed to interpret data effectively and make decisions that add value. In a world increasingly driven by data, statistical literacy is not just beneficial, it’s essential for success in the field of data science.