Last updated on 26th Apr 2025| 9667
- Definition of Median
- Median vs. Mean vs. Mode
- How to Calculate Median in an Odd vs. Even Dataset
- Median in Skewed Distributions
- Finding Median in Excel and Python
- Handling Missing Values When Calculating Median
- Median in Machine Learning and AI
- Conclusion
Definition of Median
The Median is a statistical measure that represents the middle value in a sorted dataset. It divides the dataset into two equal halves, where 50% of the values lie below the Median and 50% lie above it. Unlike the mean, which can be heavily influenced by extreme values, the Median provides a more accurate central value when dealing with skewed data or outliers. When a dataset contains an odd number of values, the Median is the single value that lies exactly in the center once the data is arranged in order a key concept explored in Data Science Training for summarizing and analyzing data distributions. For example, in the set [3, 5, 7], the Median is 5. However, in an even-sized dataset, there is no single middle value, so the Median is calculated by taking the average of the two middle values. For instance, in the set [2, 4, 6, 8], the Median is (4 + 6) / 2 = 5. The Median is commonly used in real-world scenarios such as reporting income levels, housing prices, and test scores, where data can be unevenly distributed. It is a robust and reliable measure of central tendency, especially when outliers are present.
Do You Want to Learn More About Data Scientists? Get Info From Our Data Science Course Training Today!
Median vs. Mean vs. Mode
The Median, mean, and mode are three key measures of central tendency, each offering different insights into a dataset. While they all aim to describe the center of a distribution, they vary in both calculation and interpretation. The Median is the middle value in a sorted dataset, effectively dividing the data into two equal halves similar to how Master Prompt Engineering for Better AI Results helps to effectively structure inputs for optimal AI performance. It is particularly useful in skewed distributions or when outliers are present, as it is not affected by extremely high or low values. This makes the Median a robust and reliable measure when dealing with real-world data like income, property prices, or test scores. The mean, or average, is calculated by adding all the values and dividing by the number of values.
While widely used, it is sensitive to outliers, which can distort the overall interpretation especially in skewed datasets. The mode represents the most frequently occurring value in the dataset. It is especially useful for categorical data or identifying common occurrences, such as the most popular product or survey response. In symmetrical distributions, the mean, median, and mode are typically equal. However, in skewed distributions, the Median often gives a better sense of the true center of the data.
How to Calculate Median in an Odd vs. Even Dataset
- Arrange Data: Start by organizing the dataset in ascending order, regardless of whether it has an odd or even number of values.
- Count Values: Determine how many numbers are in the dataset. This count will tell you whether the dataset has an odd or even number of values.
- Odd Number of Values: If the dataset has an odd number of values, the median is the middle number. For example, in [3, 5, 7], the median is 5.
- Finding Middle (Odd): Use the formula (n + 1) ÷ 2 to find the median position, much like AI Powered PowerPoint Generator Tools simplify content creation.
- Even Number of Values: If the dataset has an even number of values, there is no single middle number.
- Finding Middle (Even): Take the average of the two middle numbers. In [4, 6, 8, 10], the median is (6 + 8) ÷ 2 = 7.
- Conclusion: The median provides a central value, helping to understand data distribution, especially when the dataset contains outliers.
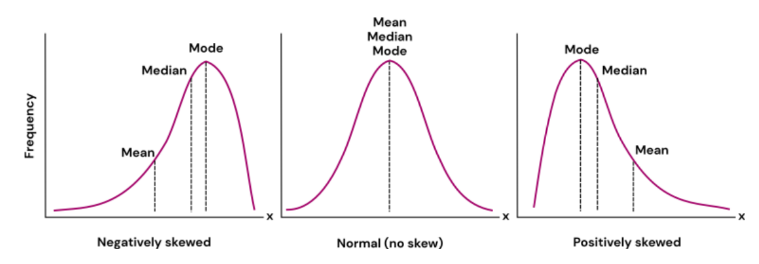
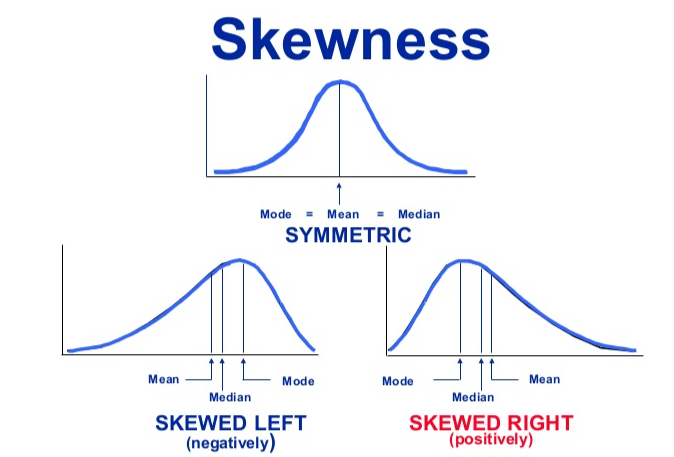
- Understanding Skewed Distributions: Skewed distributions feature asymmetrical data, with tails either to the left (negative skew) or right (positive skew).
- Why Choose the Median?: The median is often the best measure of central tendency in skewed data, as it’s less influenced by outliers.
- Median’s Relationship with Mean: In positive skew, the median is lower than the mean; in negative skew, it’s higher like the differences in ChatGPT vs Google Bard.
- Median’s Resistance to Extreme Values: The median remains unaffected by outliers, unlike the mean, which can be distorted by them.
- Example of Positive Skew: Data such as income can have a positive skew, where the median is lower due to a few high earners.
- Key Takeaway: In skewed distributions, the median provides a more accurate central value than the mean.
- Example of Negative Skew: Test scores with many high marks and a few low scores create a negative skew, with the median higher than the mean.
- When to Use the Median: The median is especially useful in summarizing skewed datasets to avoid misleading conclusions.
- Impute Missing Values: Replace missing values with the mean, Median, or mode to avoid data distortion.
- Data Cleaning: Properly handling missing values ensures the Median accurately reflects the dataset.
- Removing Outliers: Outliers can disproportionately affect the median, though less than they do with the mean.
- Handling Categorical Data: When dealing with categorical data, missing values can be imputed with the most frequent category (mode).
- Consider Data Distribution: For skewed datasets, transformations may be needed before calculating the median much like how AI Video Generator Tools adjust inputs for better results.
- Regular Data Validation: Regularly validate your dataset for missing or inconsistent values during analysis. This ensures that your calculations of the median are reliable and meaningful.
- Exclude Missing Values: Many tools automatically ignore missing values when calculating the Median (e.g., np.nanmedian() in Python).
- Use of Interpolation: In certain scenarios, missing values can be imputed through interpolation methods, such as linear interpolation, where missing values are filled based on surrounding data points, preserving trends in the dataset.
Interested in Obtaining Your Data Science Certificate? View The Data Science Course Training Offered By ACTE Right Now!
Median in Skewed Distributions

Finding Median in Excel and Python
The median can be easily calculated using both Excel and Python, two popular tools that simplify the process with built-in functions. In Excel, you can calculate the median of a selected range by using the formula =MEDIAN(A1:A10), where A1:A10 represents the cell range containing your data. This formula instantly computes the median without requiring any additional steps, making it highly efficient for small to medium-sized datasets a technique often taught in Data Science Training to streamline data analysis. In Python, the process is just as straightforward, particularly when using the NumPy library. After importing NumPy (import numpy as np), you simply define your dataset, for example, data = [3, 5, 7, 9, 11], and then use np.median(data) to calculate the median. This function will automatically find the middle value of the sorted dataset. The median is then printed with print(“Median:”, median). Both tools are highly effective for handling large datasets. Excel provides an intuitive, user-friendly interface, while Python, with libraries like NumPy, offers powerful capabilities for more complex data analysis and automation. Using these tools, users can quickly compute and visualize the median for better data insights.
Are You Considering Pursuing a Master’s Degree in Data Science? Enroll in the Data Science Masters Course Today!
Handling Missing Values When Calculating Median
When calculating the Median, choosing how to handle missing values is essential. You can either exclude or impute the missing values.
Median in Machine Learning and AI
The median is widely used in machine learning for several key purposes, particularly when dealing with missing values. It serves as an effective method for data imputation since it is robust against outliers. This means the median provides a stable estimate when filling in missing data points, unlike the mean, which can be heavily influenced by extreme values. Another common use of the median is in evaluating model performance with the Median Absolute Error (MedAE), which measures the median of the absolute differences between predicted and actual values an approach that can be integrated with Apache Airflow to automate and streamline model evaluation workflows. This metric is less sensitive to large errors, making it more reliable than the mean absolute error in cases where the data contains outliers. Additionally, median-based scaling techniques are used in feature engineering to normalize datasets, ensuring that features are centered around the median, which helps improve model training. The median also plays a role in clustering and anomaly detection, as it helps identify central tendencies in data clusters and detect outliers that deviate significantly from the median, aiding in more accurate data analysis and decision-making.
Preparing for Data Science Job? Have a Look at Our Blog on Data Science Interview Questions & Answer To Ace Your Interview!
Conclusion
The median is a fundamental statistical measure that plays a crucial role in data analysis and decision-making. Unlike the mean, it is resistant to outliers, making it particularly valuable in skewed distributions such as income, real estate, and healthcare data. In these fields, where extreme values can distort results, the median provides a more accurate representation of the central tendency. The median is widely used across various domains, including machine learning, finance, and market research, where it helps summarize data and identify trends without being affected by extreme values an essential concept covered in Data Science Training. In machine learning, for example, the median is often used for data imputation and as a performance metric, ensuring robust results even in the presence of outliers. In finance, it aids in understanding income distributions and property prices, while in market research, it helps businesses assess customer preferences. Mastering the median is essential for accurate data interpretation, as it enables more informed decision-making and improves the reliability of analyses across various sectors.