- Introduction to Hypothesis Testing
- Importance of Hypothesis Testing in Data Science
- Steps in Hypothesis Testing
- Null Hypothesis vs Alternative Hypothesis
- Types of Errors in Hypothesis Testing
- p-Value and Statistical Significance
- Common Statistical Tests (t-test, Chi-square, ANOVA)
- Hypothesis Testing in Machine Learning
- Real-World Examples of Hypothesis Testing
- Challenges in Hypothesis Testing
- Tools for Performing Hypothesis Testing
- Conclusion and Summary
Introduction to Hypothesis Testing
Hypothesis testing plays a vital role in statistical analysis and is widely utilized in Data Science Training to draw conclusions about entire populations based on sample data. It helps determine whether sufficient evidence exists to support or refute a given claim, which is essential for informed decision-making across domains such as business, healthcare, and the social sciences. Within the field of data science, hypothesis testing is often employed to validate models, compare datasets, evaluate the impact of interventions, and uncover meaningful data patterns. When applied correctly, it enables data scientists and analysts to make statistically robust and actionable decisions. In this article, we’ll delve into the fundamentals of hypothesis testing, why it matters, key steps, commonly used statistical tests, and its relevance in data science.
Importance of Hypothesis Testing in Data Science
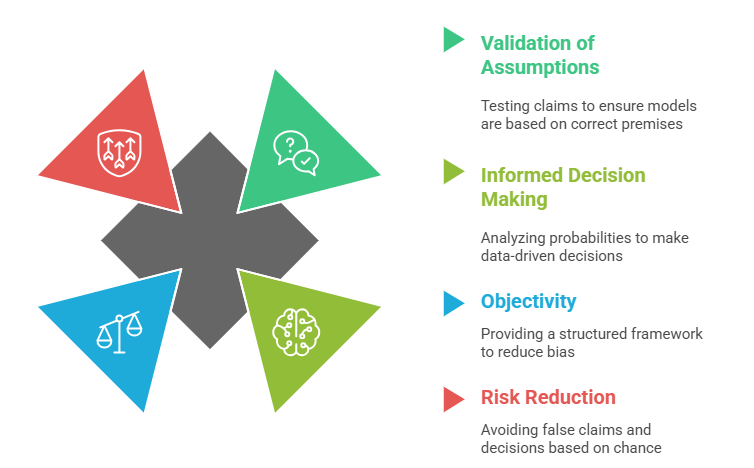
Hypothesis testing serves several vital purposes in data science:
- Validation of Assumptions: It allows analysts to test assumptions or claims about data, helping to validate models and ensure that conclusions are not drawn based on incorrect premises.
- Informed Decision Making: Hypothesis testing analyzes the probability of certain outcomes, helping to make data-driven decisions that can improve strategies, optimize processes, and increase efficiency.
- Objectivity: Hypothesis testing provides a structured, objective framework for evaluating ideas or theories, reducing the risk of bias in decision-making.
- Risk Reduction: It helps organizations avoid making false claims or basing decisions on random chance rather than actual data, which is crucial when deploying machine learning models or conducting scientific experiments.

- Data Consistency: Through automated extraction, data is collected in a standardized manner, resulting in more consistent and comparable datasets across diverse sources a key principle covered in Basics of Data Science.
- Real-Time Data Collection: Some data extraction tools offer real-time scraping and continuous updates, providing businesses with the most current information for timely decision-making.
Steps in Hypothesis Testing
Hypothesis testing follows a structured process, ensuring clarity and consistency in making data-driven decisions. The general steps involved in hypothesis testing are:
-
1.Formulate the Hypotheses:
- Null Hypothesis (H₀): A statement of no effect or difference. It represents the assumption that any observed effect is due to random chance.
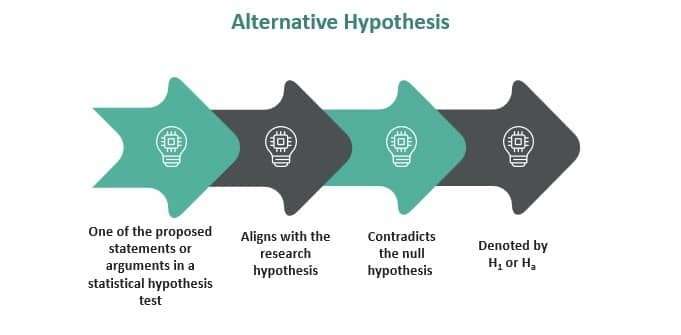
- Alternative Hypothesis (H₁): A statement that contradicts the null hypothesis. It suggests that there is an effect or a difference. 2.Choose the Significance Level (α):
- The significance level, commonly represented by α, sets the threshold for rejecting the null hypothesis. Typical values include 0.05, 0.01, and 0.10 where a smaller α indicates that stronger evidence is needed to reject the null. Understanding this concept is essential, especially when working with techniques related to Data Reduction, where simplifying data must be done without compromising statistical validity. 3.Select the Appropriate Statistical Test:
- Based on the data type and research question, choose the statistical test appropriate for hypothesis testing (e.g., t-test, chi-square test, ANOVA). 4.Collect and Analyze Data:
- Gather the sample data and perform the necessary calculations or statistical tests to obtain the test statistic (e.g., t-value, F-statistic) and corresponding p-value. 5.Make a Decision:
- If p-value < α: Reject the null hypothesis (support for the alternative hypothesis).
- If p-value ≥ α: Fail to reject the null hypothesis (insufficient evidence to support the alternative hypothesis). 6.Draw a Conclusion:
- Draw conclusions that address the research question based on the statistical decision. It’s important to report findings transparently, including limitations and assumptions.
Null Hypothesis vs Alternative Hypothesis
- Null Hypothesis (H₀): The null hypothesis typically states that there is no significant effect or relationship between the variables in question. It is the hypothesis you test to determine if the observed data is likely to occur by chance.
- Example: “There is no difference in the average test scores between students received tutoring and those who did not.”
- Alternative Hypothesis (H₁ or Ha): The alternative hypothesis posits that there is a significant effect or difference. It is what you aim to prove or suggest with the hypothesis test.
- Example: “Students who received tutoring have higher average test scores those who did not.”
The null and alternative hypotheses are mutually exclusive rejecting the null hypothesis leads to the acceptance of the alternative. This foundational concept is a key part of the Functions of Statistics, which guide how data is interpreted and decisions are made in statistical analysis.
Types of Errors in Hypothesis Testing
In hypothesis testing, two types of errors can occur:
-
1.Type I Error (False Positive):
- Occurs when the null hypothesis is rejected when it is true. In other words, you conclude that there is an effect when, in reality, there is none.
- Example: Concluding that a drug works when it doesn’t.
- The probability of a Type I error is denoted as α (significance level). 2.Type II Error (False Negative):
- Occurs when the null hypothesis is not rejected when it is false. This means you fail to detect an effect that truly exists.
- Example: Concluding that a drug doesn’t work when it does.
- The probability of a Type II error is denoted as β.
Minimizing both types of errors is critical for ensuring the accuracy and reliability of hypothesis testing.

p-Value and Statistical Significance
The p-value is a key statistical measure used to assess the strength of evidence against the null hypothesis. It indicates the probability of obtaining the observed data or something more extreme assuming the null hypothesis is true. Understanding how to interpret p-values is a fundamental skill covered in Data Science Training.
- Low p-value (p < α): Strong evidence against the null hypothesis suggests the null hypothesis should be rejected.
- High p-value (p ≥ α): Weak evidence against the null hypothesis suggests insufficient evidence to reject the null hypothesis.
Statistical significance is achieved if the p-value is less than the predetermined significance level (α), commonly set at 0.05. A p-value of less than 0.05 means there is less than a 5% chance that the observed data would have occurred under the null hypothesis, providing strong evidence to reject it.
Common Statistical Tests
Several statistical tests are used in hypothesis testing, depending on the type of data and the research question:
-
1. T-test:
- Used to compare the means of two groups to determine whether they have a statistically significant difference.
- Types of t-tests include one-sample t-tests, two-sample t-tests, and paired-sample t-tests. 2.Chi-square Test:
- Used to test the independence of two categorical variables. The chi-square test determines if the observed data distribution differs significantly from an expected distribution. 3.ANOVA (Analysis of Variance):
- Used to compare means across more than two groups. ANOVA tests whether there are significant differences between group means in a dataset. 4.Correlation Tests:
- Tests the relationship between two continuous variables to see if there is a linear relationship (e.g., Pearson’s correlation). 5.Regression Analysis:
- Tests how one variable (dependent) changes in response to one or more independent variables.
Hypothesis Testing in Machine Learning
In machine learning, hypothesis testing can be used to assess the significance of different features, algorithms, or models:
- Model Comparison: Hypothesis testing can help determine if one model performs significantly better than another on a given task.
- Feature Selection: Hypothesis testing can be used to test if certain features in the dataset significantly contribute to the model’s predictive power.
- A/B Testing: This is a form of hypothesis testing used in experiments to compare two versions of a product or feature and determine which one performs better.
Real-World Examples of Hypothesis Testing
- Medical Trials: In clinical trials, hypothesis testing determines whether a new drug is more effective than a placebo. The null hypothesis might state that the drug has no effect, while the alternative hypothesis suggests that the drug improves patient outcomes.
- A/B Testing for Marketing: Marketers use hypothesis testing to evaluate the effectiveness of different ad campaigns. For example, the null hypothesis might claim no difference in customer conversion rates between two advertisements, while the alternative hypothesis suggests one ad leads to higher conversion.
- Quality Control: Hypothesis testing is commonly used by manufacturers to ensure products meet quality standards. For instance, the null hypothesis may state that the proportion of defective items in a batch is within acceptable limits, while the alternative suggests it exceeds the threshold. This practical application is frequently explored in Data Science Training to highlight the role of statistics in real-world decision-making.
Challenges in Hypothesis Testing
Despite its utility, hypothesis testing comes with challenges:
- Sample Size: Small sample sizes can lead to inaccurate conclusions due to increased variability and a higher risk of Type II errors.
- Assumptions: Many statistical tests rely on assumptions (e.g., normality, homogeneity of variance) that may not always hold in real-world data.
- Multiple Testing: Performing numerous hypothesis tests on the same dataset can increase the risk of false positives. Techniques like the Bonferroni correction help mitigate this.
Tools for Performing Hypothesis Testing
Several tools and software platforms are available for conducting hypothesis testing:
- R and Python: Both languages have extensive libraries (e.g., stats models and scipy in Python and stats in R) for performing hypothesis tests and calculating p-values.
- SPSS and SAS: These software tools provide a user-friendly interface for conducting statistical analyses, including hypothesis testing.
- Excel: With add-ins like the Analysis Toolpak, Excel can perform basic hypothesis tests, such as t-tests and ANOVA.
Conclusion
Hypothesis testing is a fundamental statistical technique in data science, used to evaluate claims, test theories, and support informed decision-making. By formulating a null hypothesis, choosing the appropriate statistical test, and interpreting results through p-values and significance levels, data scientists can generate conclusions with real-world relevance. Whether applied in research, marketing, healthcare, or Importance of Machine Learning, hypothesis testing plays a key role in uncovering insights from data. Grasping common errors, standard testing methods, and potential challenges is crucial for ensuring rigorous and dependable analysis. When supported by the right tools and techniques, hypothesis testing empowers data scientists to deliver evidence-based insights and guide strategic decisions across diverse industries.


