Last updated on 03rd Jun 2026| 9170
- Introduction Why Metabase is a Powerful Tool for Data Analysts
- No-Code SQL Query Builder
- Interactive Dashboards for Visual Exploration
- Seamless Integration with Multiple Databases
- Self-Service Analytics for Non-Technical Users
- Automated Reporting and Alerts
- Open-Source Flexibility and Customization
- Embedding Analytics into Applications
- Conclusion
Introduction Why Metabase is a Powerful Tool for Data Analysts
In this tech-world, data is everywhere from your social media activities to how much money you have spent and even how much food you’ve thrown into your compost bin! The great thing about why Metabase is a powerful tool for data analysts is that it allows you to take all of that raw data, and turn it, literally, into usable and logical information that will help solve many issues we have today. If you are just getting started with Data Science at this point, just learning algorithms and tools will not be enough. The only way to truly understand Data Science is to use the tools and algorithms, on real-world problems in Data Analytics Training. This provides you with the confidence you need to be an analytical thinker and the skills required to become an industry-ready professional. Below are some great examples of beginner-friendly and industry-relevant features that you can utilize, that also have real-world applications. Not only will these features help you understand how data science can be used in different industries, for example media, finance, health care, agriculture and customer service; they will also give you the strong foundation that you will need in order to move from being a theoretical analyst to a pragmatic analyst solving real-world problems.
No-Code SQL Query Builder
No-Code SQL Query Builder is a Metabase feature that focuses on determining whether or not data can be accessed easily through visual methods. Writing complex code is a big problem in this day and age of digital information and there are so many ways to access large datasets extremely rapidly. Most of this information requires technical knowledge which makes the issue of data extraction a serious one. No-Code SQL Query Builder aims to aid in solving the coding barrier issue by creating a method of predicting similar attributes of queries automatically by analyzing user clicks and determining if it is accurate in Data Analytics Training. The Query Builder system uses a graphical interface to analyze database schemas and extract context, relationships and patterns associated with the tables. The tool is initially trained on datasets containing both simple and complex examples so there will be a distinction between basic filters and joins when completed. The tool uses drag-and-drop to convert visual elements to SQL syntax along with a decision algorithm such as automatic table joining. Once set up, the system can classify database requests as either executable or flawed by using the learned pattern. Less Manual Coding More Accessible Data Retrieval. The feature provides exposure to Query Generation and Visual Programming Concepts. The emphasis on Data Structure will increase.
Eager to Acquire Your Data Analytics Certification? View The Data Analytics Training Offered By ACTE Right Now!
Interactive Dashboards for Visual Exploration
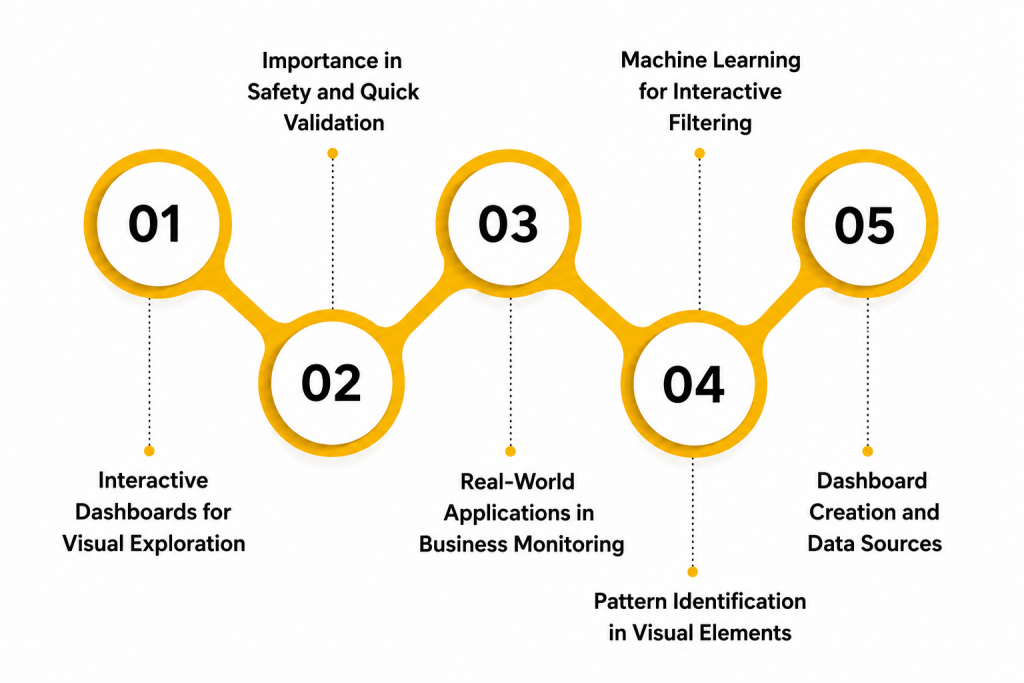
- Dashboard Creation and Data Sources: Interactive dashboards are created by connecting data from SQL databases, spreadsheets, cloud platforms, APIs, and business applications. These dashboards combine key metrics, dimensions, charts, and filters to provide real-time business insights. To build a stronger analytics foundation, avoid the Common Mistakes Freshers Make in Data Analytics.
- Pattern Identification in Visual Elements: Data analysts use interactive charts, graphs, maps, and KPIs to identify trends, anomalies, and performance patterns. Visual exploration enables users to monitor business metrics, compare historical data, and make faster, data-driven decisions.
- Interactive Filtering and Data Exploration: Interactive dashboards provide features such as filters, drill-downs, slicers, and dynamic visualizations that allow users to explore data from multiple perspectives. These capabilities help analysts uncover trends, compare metrics, and gain deeper business insights without writing complex queries.
- Real-World Applications in Business Monitoring: Organizations use interactive dashboards to monitor sales performance, financial metrics, operational efficiency, customer behavior, and marketing campaigns in real time. Understanding the differences between Data Scientist vs Data Analyst also helps professionals choose the right analytics approach for business reporting and decision-making.
- Importance in Business Performance and Decision-Making: Interactive dashboards enable early identification of business risks, performance declines, and emerging opportunities through real-time visual insights. These dashboards support faster decision-making, improve operational efficiency, and help organizations respond quickly to changing business conditions.
Seamless Integration with Multiple Databases
Metabase provides seamless integration with multiple databases, allowing organizations to connect and analyze data from SQL and NoSQL sources through a single, unified platform. It supports popular databases such as MySQL, PostgreSQL, Microsoft SQL Server, Oracle, MongoDB, and cloud data warehouses, enabling users to create reports and dashboards without moving data between systems. This centralized approach eliminates data silos, improves collaboration, and delivers consistent business insights across departments. Learning to integrate multiple data sources also helps learners build practical projects, making it easier to create a strong portfolio by exploring Building a Data Analytics Portfolio. Mastering database integration in Metabase provides hands-on experience with data connectivity, business intelligence, reporting, and modern analytics workflows, preparing professionals for real-world data analytics roles.

Self-Service Analytics for Non-Technical Users
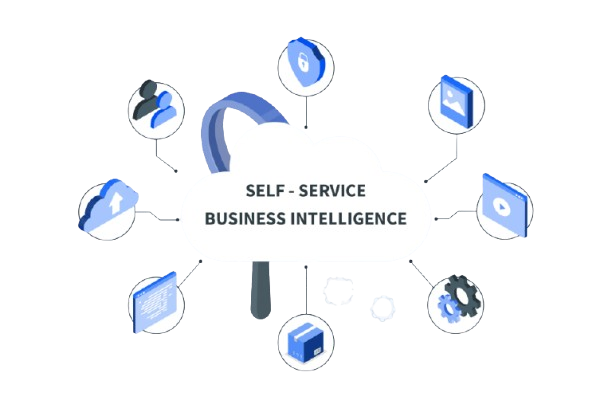
- User Collection and Tool Sources: Self-service analytics begins with empowering large amounts of non-technical business users. This data is gathered from simple interface interactions and exploratory clicks and From Fresher to Data analyst. It includes saved questions and simple filter records. This raw data is the foundation for analytics.
- Pattern Identification in User Queries: After empowering users, the next step is finding patterns in search behaviors. Data scientists analyze query frequencies like repeated monthly sales checks. These patterns help understand how business questions repeat over time. This makes future tool usability more reliable.
- Machine Learning for Easy Prediction: No-code models are used to predict answers based on simple user inputs. Algorithms like natural language processing are commonly applied. These models learn relationships between plain English and database tables. This helps generate more accurate and data-driven answers.
- Real-World Applications in Team Empowerment: Self-service analytics is very important in business for planning team strategies. Companies use it to decide when to allow independent data access and Freelancing Opportunities in Data Analytics for Freshers. It also helps reduce loss caused by waiting for technical teams. This improves productivity and better decisions.
- Importance in Speed and Data Democracy: Self-service tools play a key role in predicting workflow risks like team bottlenecks. Early independent querying helps employees take safety measures in advance. This reduces damage to project timelines. It makes teams better prepared for extreme business conditions.
- Code Collection and Community Sources: Open-source flexibility begins with collecting large amounts of community-driven code. This data is gathered from public repositories and developer forums It includes custom plugins and code snippets. This raw data is the foundation for building highly customized analytics tools.
- Pattern Identification in Custom Code: After collecting code, the next step is finding patterns in community contributions. Data analysts analyze pull requests like visualization updates and feature additions. These patterns help understand how the tool evolves over time. This makes future customization more reliable.
- Machine Learning for Custom Prediction: Open-source algorithms are used to predict how custom features will perform based on past data. Techniques like code testing are commonly applied. These models learn relationships between custom code and system stability.
- Real-World Applications in Cost Savings: Companies use it to decide when to avoid expensive software licenses and must know SQL Application. It also helps reduce loss caused by unexpected vendor lock-ins. This improves productivity and supports better financial decisions.
- Importance in Security and System Control: Open-source tools play a key role in predicting security risks like hidden vulnerabilities. Early code auditing helps developers take safety measures in advance thats Why Metabas is a Powerful Tool for Data Analysts . This reduces damage to data privacy. It makes organizations better prepared for extreme security conditions.
Excited to Obtaining Your Data Analytics Certificate? View The Data Analytics Training Offered By ACTE Right Now!
Automated Reporting and Alerts
Automated Reporting and Alerts is a Metabase feature that focuses on determining whether or not data changes can be monitored automatically through scheduling methods. Manual checking is a big problem in this day and age of digital information and there are so many ways to access metric updates extremely rapidly. Most of this information is time-sensitive which makes the issue of delayed reporting a serious one. Automated Reporting aims to aid in solving the monitoring issue by creating a method of predicting similar attributes of data automatically by analyzing threshold limits and determining if it is abnormal and learn Data Analytics Without Coding . The reporting system uses scheduling algorithms to analyze database logs and extract context, relationships and patterns associated with the metrics. The tool is initially trained on datasets containing both normal and alert examples so there will be a distinction between stable and volatile data when the report is triggered. The tool uses cron jobs to convert manual checks to automated emails along with a decision algorithm such as conditional formatting. Once configured, the system can classify metric changes as either safe or critical by using the learned pattern. Less Manual Monitoring More Proactive Reactions . The feature provides exposure to Automation and Scheduling Concepts. The emphasis on Proactive Monitoring will increase.
Are You Considering Pursuing a Data Analytics Master’s Degree? Enroll For Data Analytics Expert Masters Program Training Course Today!
Open-Source Flexibility and Customization
Set to Ace Your Data Analytics Job Interview? Check Out Our Blog on Data Analytics Interview Questions & Answer
Embedding Analytics into Applications
Embedding Analytics into Applications is a Metabase function that focuses on determining whether or not dashboards can be shared externally through embedding methods. Platform switching is a big problem in this day and age of digital information and there are so many ways to access separate tools extremely rapidly. Most of this information is isolated which makes the issue of user experience fragmentation a serious one in our Data Analytics Training. Embedding Analytics aims to aid in solving the context-switching issue by creating a method of predicting similar attributes of user interfaces automatically by analyzing iframe codes and determining if it is secure. The embedding system uses API tokens to analyze external requests and extract context, relationships and patterns associated with the user permissions. The function is initially trained on datasets containing both public and private examples so there will be a distinction between open and restricted access when embedded. The function uses secure iframes to convert standalone dashboards to integrated components along with a decision algorithm such as row-level security. Once embedded, the system can classify external users as either authorized or unauthorized by using the learned pattern. Less App Switching More Seamless User Experience. The function provides exposure to API Integration and Security Concepts. The emphasis on User Experience will increase.
Conclusion
Data science tools for beginners learning building queries, creating dashboards, and embedding analytics show how useful it is to use data to solve real-life problems. They’re great for helping people understand how raw data is collected, processed, and turned into useful information. Each feature develops a different set of skills: some with SQL generation, others with dashboard design, some others with automation, and still others with embedding – all of which are extremely valuable in today’s tech-driven workplaces in Data Analytics Training. Working on real-world data tools is also a great way for a beginner to build a good portfolio of work that they can use to apply for jobs in data science. Completing these analytical tasks bridges the gap between theory and practice. When a learner uses multiple tools, they increase their confidence in and ability to use technology. Overall, tool-based learning is probably the best way for someone just getting into data science to grow as a new learner.