Last updated on 12th Jun 2025| 11219
- Introduction
- What Are Filters in Tableau?
- Types of Filters in Tableau
- How Filters Work in Tableau
- Best Practices for Using Filters in Tableau
- Common Pitfalls When Using Filters in Tableau
- Use Cases of Filters in Tableau
- Conclusion
Introduction
In data visualization, the ability to filter data is one of the most powerful and essential features. Tableau, a leading data visualization tool, offers a variety of filtering options that allow users to segment and refine data in multiple ways. This flexibility enables users to focus on the most relevant insights, helping them uncover trends, patterns, and outliers that might otherwise be hidden in large datasets. Filters in Tableau not only help tailor visualizations and reports to specific needs but also improve overall performance by limiting the amount of data processed and displayed. Whether you’re building a dashboard for executives or creating detailed reports for analysts, understanding the different types of filters available in Tableau is a key component of Business Analyst Training and essential to controlling how data is presented. Each filter type serves a unique purpose and is designed to address specific data challenges. For example, some filters operate at the data extraction level to reduce the data volume from the source, while others work dynamically within the visualization to offer interactive exploration. In this blog, we will explore the various types of filters in Tableau, including extract filters, context filters, dimension filters, and measure filters. We will discuss how each type functions, best practices for their use, and practical scenarios where they add the most value. By mastering Tableau filters, you can enhance your data visualization projects, making your insights more focused, efficient, and impactful for your audience.
Are You Interested in Learning More About Business Analyst? Sign Up For Our Business Analyst Training Today!
What Are Filters in Tableau?
Filters in Tableau are powerful tools used to restrict and refine the data displayed in your visualizations, allowing users to focus on specific subsets of information that are most relevant to their analysis. These filters can be applied to individual fields, such as dimensions or measures, or they can affect entire datasets, helping to remove irrelevant or extraneous data. By limiting the volume of data loaded into a view, filters also play a crucial role in improving dashboard performance, ensuring faster load times and smoother interactions in What is a Business Analysis. Whether you are building a simple report or a complex dashboard, filters are essential for tailoring the data to meet specific user needs or business requirements. Filters enhance the interactivity and usability of Tableau dashboards by allowing end users to dynamically adjust what data they see, making the visualizations more meaningful and actionable. For example, a sales manager might use filters to view performance data for a particular region or time period without altering the underlying data model. Filters can be set up during the report-building phase by the report designer or made available to end users as interactive controls, such as dropdown menus, sliders, or search boxes.
Additionally, Tableau offers several types of filters, including extract filters that limit data during import, context filters that improve efficiency in complex queries, and dimension or measure filters that allow detailed control over categorical or numerical data. By effectively using filters, Tableau users can create dynamic, insightful, and performance-optimized reports that drive better decision-making across organizations.
Types of Filters in Tableau
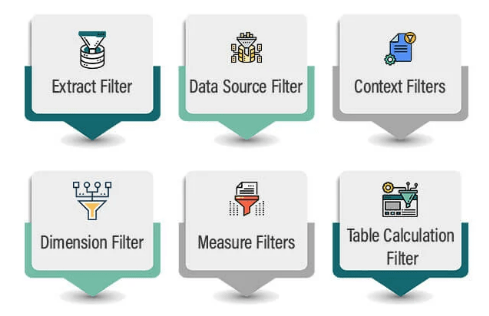
- Extract Filters: Extract filters are applied when creating a data extract from the source. They limit the data being imported into Tableau, helping improve performance and reduce file size by only bringing in relevant data.
- Data Source Filters: These filters are applied at the data source level and restrict data for all workbooks using that source. They help in enforcing security or privacy rules and reducing the overall volume of data before analysis begins.
- Context Filters: Context filters act as an independent layer that influences other filters. When a context filter is applied, it creates a subset of data that subsequent filters use, which can enhance performance in complex filtering scenarios.
- Dimension Filters: Dimension filters are applied to categorical fields (e.g., region, product, customer). They allow users to filter data based on discrete values and can be added to worksheets as quick filters for user interaction. Top Business Analytics Tools.
- Measure Filters: These filters are used on quantitative fields (e.g., sales, profit). They allow filtering data based on ranges, conditions, or thresholds (e.g., sales > 1000), making it easier to focus on key metrics.
- Table Calculation Filters: These filters are applied to results generated by table calculations. Since they act after aggregations, they are useful for filtering based on calculated values or rankings.
- Top N / Conditional Filters: These filters allow users to show the top or bottom N values based on a measure or apply conditions to dynamically limit the data shown, such as top 10 products by sales.
- Order of Operations: Tableau follows a specific filter order of operations, which determines how and when each filter type is applied. This includes extract filters first, followed by data source filters, context filters, dimension filters, measure filters, and table calculation filters.
- Extract Filters: When creating an extract from a data source, extract filters are applied to limit the data brought into Tableau. This step helps reduce the data size and improves performance by removing unnecessary records at the initial stage.
- Data Source Filters: Applied after extract filters, data source filters restrict the data that all users and workbooks can access. These are useful for data-level security or compliance, and are commonly taught in Business Analyst Training to ensure sensitive information is filtered out early.
- Context Filters: Context filters create a subset of data that other filters act upon. They are especially useful when working with large datasets or dependent filters, as they help improve performance and ensure correct results in cascading filter scenarios.
- Dimension Filters: These filters apply to categorical data like region or product. Users can include or exclude values, and they are often used to let end-users interact with dashboards via filter controls.
- Measure Filters: Measure filters apply after data aggregation. They are used to filter values based on numerical ranges or conditions (e.g., sales greater than $10,000).
- Table Calculation Filters: These filters work on data after it has been aggregated and calculated in the view. They’re useful for filtering based on ranking, percent of total, or running totals.
- Unintended Exclusion of Data: Be careful when using filters, as they can unintentionally exclude important data. Always verify that your filters are returning the correct results.
- Performance Impact: Applying too many filters, especially complex ones like Top N or wildcard filters, can degrade the performance of your dashboard.
- Misleading Results: Filters can lead to misleading conclusions if applied incorrectly. Ensure your filters align with the analysis goals and data logic.
- Incorrect Filter Order: Tableau follows a strict filter order of operations. Misapplying filter types in the wrong order can result in unexpected or incorrect outputs an important consideration in Time Series Analysis Tactics.
- Over-Filtering Dashboards: Too many filters can clutter the dashboard and overwhelm users. Use only relevant filters to maintain clarity and usability.
- Data Security Risks: Filters alone do not enforce security. Without proper row-level security or data source filters, sensitive data may be unintentionally exposed.
- Lack of User Guidance: Poorly labeled filters or unclear options can confuse users. Always use descriptive names and provide context or instructions where needed.
To Explore Business Analyst in Depth, Check Out Our Comprehensive Business Analyst Training To Gain Insights From Our Experts!
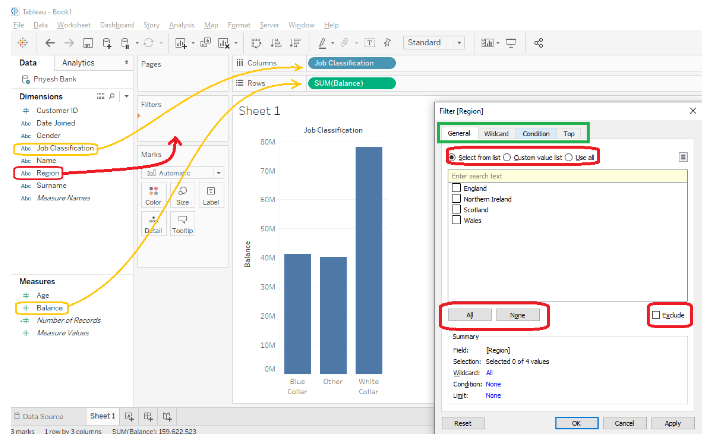
How Filters Work in Tableau

Best Practices for Using Filters in Tableau
Using filters effectively in Tableau is essential to create clear, performant, and insightful visualizations. One best practice is to use context filters sparingly, as they create temporary subsets of data that other filters rely on, which can improve performance but may also add complexity if overused. It’s important to order your filters thoughtfully, because Tableau processes filters in a specific sequence starting with extract filters, then context filters, dimension filters, and finally measuring filters. This ordering can significantly impact your results and performance, which is a crucial insight for those pursuing a Busin Business Analyst Career Path. Another key practice is to minimize the number of filters applied, especially on large datasets, since excessive filtering can slow down your dashboards and reports. Instead, try to optimize data sources beforehand by reducing data volume or pre-aggregating data when possible. Using filter actions within dashboards enhances interactivity, allowing users to drill down dynamically without overwhelming the view with multiple static filters. Always test filter performance and impact on load times, and remove or simplify filters that cause delays. Additionally, avoid using too many quick filters (filters with a user interface) on a single dashboard, as this can clutter the view and confuse users. When working with date filters, using relative date filters is often more efficient and user-friendly than fixed date ranges. Lastly, ensure filter names are clear and descriptive to help users understand the data they are selecting. By following these best practices, Tableau users can maintain dashboard clarity, improve performance, and deliver meaningful insights to their audience.
Gain Your Master’s Certification in Business Intelligence by Enrolling in Our Business Intelligence Master Program Training Course.
Common Pitfalls When Using Filters in Tableau
Use Cases of Filters in Tableau
Filters in Tableau are versatile tools that support a wide range of use cases across industries and business functions, helping users focus on the most relevant data for their analysis. One common use case is in sales performance tracking, where filters allow managers to view sales data by region, product category, or time period, enabling them to identify trends, top performers, or areas needing improvement. In financial reporting, filters help analysts drill down into specific accounts, departments, or fiscal quarters, ensuring accurate and targeted insights. For marketing campaigns, filters can segment audiences based on demographics, engagement levels, or campaign types, helping marketers evaluate campaign effectiveness and optimize strategies a use case that complements tools like What is Splunk. Filters are also crucial in customer service analytics, where they allow teams to isolate data related to specific customer segments, support ticket categories, or resolution times, improving service quality and responsiveness. In inventory management, filters enable operations teams to monitor stock levels by warehouse, supplier, or product type, helping maintain optimal inventory and reduce costs. Additionally, filters support healthcare analytics by enabling providers to analyze patient data by diagnosis, treatment, or outcome, driving better clinical decisions. Beyond these examples, filters in Tableau facilitate dynamic dashboards that empower users to explore data on their own, selecting relevant dimensions or measures without altering the underlying data model. This interactivity enhances user engagement and decision-making across business units. By leveraging filters effectively, Tableau users can tailor insights to specific needs, improve report clarity, and drive more informed, data-driven decisions.
Are You Preparing for Business Analyst Jobs? Check Out ACTE’s Business Analyst Interview Questions and Answers to Boost Your Preparation!
Conclusion
Filters in Tableau are essential tools that enable users to tailor their data visualizations and reports by showing only the most relevant information. By applying filters, you can refine large datasets into meaningful subsets, making it easier for your audience to focus on critical insights. Tableau offers a variety of filter types, each serving a unique purpose in managing how data is displayed. Extract filters help reduce the size of your data extract by limiting the data imported from the source, improving performance and reducing load times. Context filters create a temporary subset of data that other filters can then operate on, which is particularly useful for complex filtering scenarios and enhancing performance a concept often explored in Business Analyst Training. Dimension filters allow you to filter categorical data, such as customer names or product categories, while measure filters work with numerical data to filter based on specific value ranges or conditions. Understanding how these filters function and interact is key to building efficient dashboards and reports that deliver accurate and actionable insights. For example, the order in which filters are applied can affect the results, so it’s important to plan your filter strategy carefully. Additionally, overusing filters or using them improperly can slow down your workbook or lead to misleading visualizations. Following best practices such as minimizing the number of context filters, avoiding excessive use of extract filters, and testing filter performance ensures your Tableau visualizations remain both accurate and performant, providing a smooth and insightful experience for users.


