Last updated on 12th Jun 2025| 10456
- Introduction
- Overview of Tableau and Power BI
- Key Differences Between Tableau and Power BI
- Enterprise-Focused Features of Tableau
- Security and Governance
- Cost Consideration
- Implementation and Support
- Use Cases: When Tableau is More Suitable for Enterprises
- Conclusion
Introduction
In today’s data-driven world, enterprises need powerful Business Intelligence (BI) tools to analyze large datasets, generate actionable insights, and make informed business decisions. Among the leading BI tools, Tableau and Power BI are two of the most popular options. While both offer exceptional capabilities, Tableau has emerged as a top choice for enterprises seeking advanced, flexible, and visually compelling data analytics.This blog delves into why Tableau is better than Power BI for enterprises, focusing on key differences, enterprise-specific features, security, scalability, and more.Due to its user-friendly interface and integration with the Microsoft environment, Power BI, a product developed by Microsoft, is an excellent choice for both beginners and organizations that already have Microsoft in place. Tableau, however, is reputed for its powerful data exploration features and in-depth graphics, so it is a preferred pick among professional data analysts and those working with.
Do You Want to Learn More About Business Analyst? Get Info From Our Business Analyst Training Today!
Overview of Tableau and Power BI
Before we dive into the detailed comparison, let’s first look at an overview of both platforms.
What is Tableau?Tableau is a leading data visualization tool known for its user-friendly interface, powerful data analysis capabilities, and visually stunning dashboards. Designed to help organizations make sense of their data through interactive and shareable dashboards, Tableau provides a high level of customization, making it particularly suitable for enterprises with complex data needs.
What is Power BI?Power BI, developed by Microsoft, is a data analytics tool that integrates seamlessly with Microsoft products like Excel, SharePoint, and Azure. It is a popular choice for organizations already using Microsoft’s ecosystem. Power BI provides powerful reporting and dashboard capabilities, although its customization and visualization options are considered more basic compared to Tableau.
Key Differences Between Tableau and Power BI
- Tableau:Tableau’s interface is intuitive and highly customizable, enabling users to create complex visualizations quickly. It offers a drag-and-drop interface, with advanced formatting and design options, making it more suitable for creating sophisticated and customized content.
- Power BI:While Power Query also has a user-friendly interface, its design options are more limited compared to Tableau. It provides a simpler, more straightforward creation process, but lacks the level of detailed customization that Tableau offers. Data Visualization
- Tableau:Tableau excels at creating stunning and interactive visualizations. It supports a wide range of visualization types, including complex charts, maps, and custom visuals. For enterprises looking to create dynamic, visually engaging reports, Tableau’s flexibility is unmatched.
- Power BI: Power BI has solid visualization capabilities but does not match Tableau in terms of depth and customization. While Power BI offers basic charts and graphs, Tableau allows for more intricate design and a greater range of visual options, making it ideal for companies with specific visualization requirements. Data Handling and Integration
- Tableau:ers advanced data handling features, including the ability to handle large and complex datasets. It supports a wide variety of data sources, such as cloud-based data, on-premises databases, and even custom data connectors. Tableau’s capabilities make it an excellent choice for enterprises dealing with large-scale data and multiple data sources.
- Power BI:Power BI is well-suited for organizations that rely heavily on Microsoft tools and systems, such as Excel and Azure. However,Power Query can struggle when it comes to handling large datasets or connecting with non-Microsoft data sources. Its capabilities are solid, but not as robust as Tableau’s.
- Tableau:Tableau is known for its scalability, making it a great option for large enterprises. It can handle millions of rows of data without sacrificing performance. Tableau’s server and cloud-based solutions ensure that graphics can scale up their data analytics needs as they grow.
- Power BI:While Power BI enterprises is also scalable, it may not be as effective at handling extremely large datasets. Power BI’s performance can degrade when dealing with huge amounts of data, especially in environments where high-performance analysis is needed. Performance
- Tableau:Tableau provides excellent performance, even when working with large datasets or complex analytics. It uses an in-memory data engine that enables faster computations and more seamless data exploration.
- Power BI:Power BI’s performance is generally strong but may lag when compared to Tableau, especially with large datasets Power Query. For enterprises working with big data or performing highly complex calculations, graphics is typically the preferred choice.
- Predictive analytics:Using built-in forecasting tools with R or Python, Tableau allows enterprises to run predictive Data analysis models and perform advanced statistical analyses.
- Data blending:Tableau allows for the blending of multiple data sources, making it easier to analyze data from different systems.
- Tableau:Tableau offers robust security features, including row-level security, Data analysis, and integration with enterprise-level identity management systems. These features ensure that sensitive data is protected, and only authorized users have access to specific datasets.
- Power BI:Power BI also offers strong security features but is primarily built around Microsoft’s security framework, making it more suitable for businesses already embedded within the Microsoft ecosystem. However, Tableau provides more advanced and granular security options for enterprises.
- Tableau:Tableau offers excellent customer support, including detailed documentation, community forums, and dedicated customer success teams. Additionally, its professional services team can assist enterprises with complex implementations.
- Power BI:Power BI also offers solid customer support, particularly for organizations that are already using Microsoft products. However, enterprises looking for more customized support might find Tableau’s implementation services to be more robust.
- Deal with complex, large-scale data sets and need high-performance analytics.
- Require advanced data visualization and customization capabilities.
- Have teams focused on in-depth, sophisticated analytics and reporting
- Need a high level of scalability to accommodate business growth.
- Want to create visually compelling and interactive content for a diverse range of stakeholders.
Although both tools are highly capable, they differ in several ways. Here are some key distinctions:
User Interface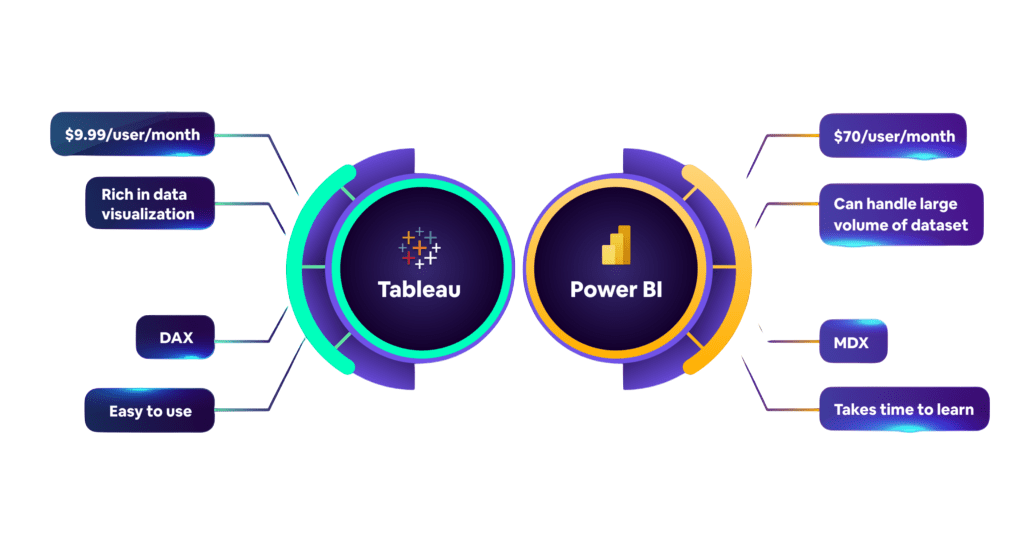
Would You Like to Know More About Business Analyst? Sign Up For Our Business Analyst Training Now!
Enterprise-Focused Features of Tableau
Tableau’s enterprise-specific features set it apart from Power BI, especially in large organizations with complex needs.
Advanced AnalyticsTableau provides advanced analytics capabilities, including:
While Power BI does offer some advanced analytics tools, Tableau’s robust capabilities in this area make it a preferred choice for enterprises requiring in-depth analysis.
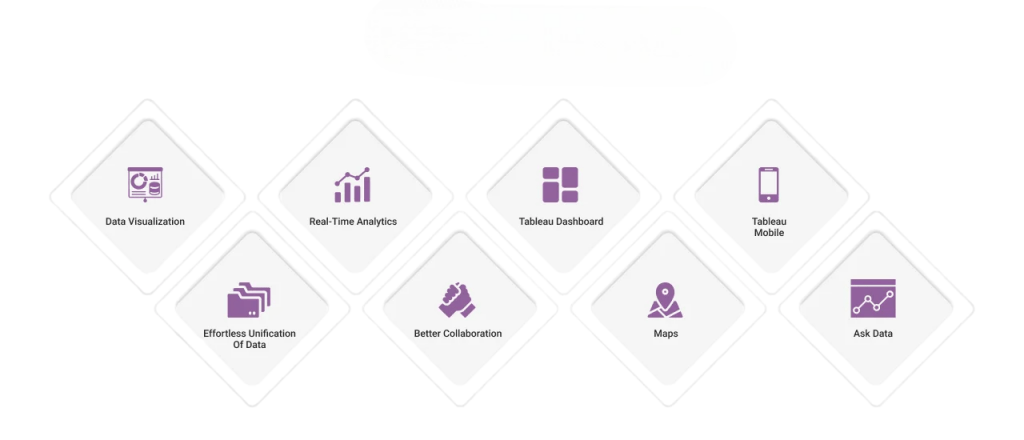
Tableau offers exceptional flexibility in design and customization. Enterprises can create highly customized solutions that align with their unique business needs. Tableau’s drag-and-drop interface allows users to adjust visualizations quickly and add complex layers of analysis. Power BI, on the other hand, while customizable to a certain extent, does not offer the same level of flexibility. Power BI and report charts are often more standardized and less tailored.
Collaboration and SharingTableau’s collaboration tools allow teams to share and collaborate in real time, providing businesses with the ability to make collective, data-driven decisions.Tableau Server and Tableau Online ensure that organizations can securely share interactive with internal and external stakeholders. Power BI also provides collaboration features, especially within the Microsoft ecosystem, but its collaboration tools are not as extensive or as powerful as Tableau’s.

Security and Governance
Looking to Master Business Intelligence? Discover the Business Intelligence Master Program Training Course Available at ACTE Now!
Cost Consideration
While Tableau generally comes at a higher price point than Power BI, the cost is justified by the advanced features, visualization capabilities, and scalability it offers. Tableau’s subscription model can be more expensive, especially for large enterprises with multiple users.Power BI is generally considered more affordable, particularly for smaller organizations or those already using Microsoft products. However, enterprises that require highly specialized features or are working with large datasets might find the value offered by Tableau justifies the higher cost.
Implementation and Support
Want to Learn About Business Analyst? Explore Our Business Analyst Interview Questions and Answers Featuring the Most Frequently Asked Questions in Job Interviews.
Use Cases: When Tableau is More Suitable for Enterprises
Tableau is an ideal choice for enterprises that:
Conclusion
Both Tableau and Power BI are powerful tools, but Tableau’s advanced features, superior data visualization, scalability, and flexibility make it the better choice for enterprises with complex needs and large datasets. Its customization capabilities, along with its enterprise-focused features like advanced analytics and robust security, ensure that Tableau remains a top choice for companies looking to drive data-driven decision-making.For organizations seeking advanced analytics, more control over design, and higher levels of customization, Tableau offers a comprehensive and scalable solution that delivers superior performance and greater value in the long term.


