Last updated on 07th May 2025| 8696
- Introduction to QlikView
- What Makes QlikView Unique
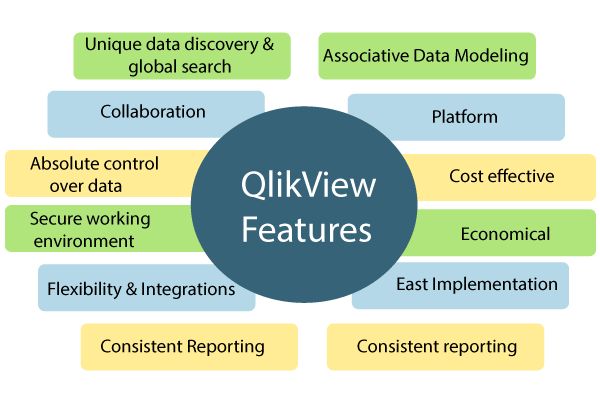
- Key Features of QlikView
- How QlikView Enhances Decision Making
- The Role of QlikView in Data Visualization
- QlikView’s Scalability and Performance
- QlikView vs Other BI Tools
- Conclusion
Excited to Achieve Your Business Analyst Certification? View The Business Analyst Online course Offered By ACTE Right Now!
Introduction to QlikView
In the fast-paced world of business, data has become the cornerstone of intelligent decision-making. But with vast amounts of information being generated daily, organizations often struggle to make sense of it all. This is where Business Intelligence (BI) tools come into play. Among the myriad BI tools available, QlikView stands out as one of the most powerful and innovative platforms for turning complex data into actionable insights. QlikView, developed by Qlik, is a business intelligence software that provides interactive data visualization, dashboards, and reporting capabilities, and is often included in Business Analyst Training programs. Known for its speed and flexibility, QlikView allows users to explore and analyze data in real-time, making it a favorite among enterprises looking to make informed decisions quickly and efficiently. It helps organizations uncover trends, relationships, and patterns that would otherwise remain hidden in raw data. This blog will explore how QlikView works, its unique features, how it facilitates smarter decision-making, and why it is considered one of the most thrilling BI tools available today.
What Makes QlikView Unique
QlikView’s uniqueness stems from its associative data model, which allows users to explore data from various angles and make connections between different datasets in an intuitive and interactive way. Unlike traditional BI tools, which rely on a predefined set of queries and reports, QlikView offers more freedom and flexibility, enabling users to explore their data without constraints. The platform is built around in-memory technology, which enables fast Data Analysis and processing. This means that QlikView can quickly load large datasets into memory, allowing for rapid querying and real-time decision-making. Furthermore, its interactive visualizations and customizable dashboards give users complete control over how they view and analyze their data. In essence, QlikView transforms the way businesses approach data analysis, offering a platform that encourages exploration, discovery, and insights that lead to smarter, data-driven decisions.
Key Features of QlikView
Associative Data Model
One of the standout features of QlikView is its associative data model. This model enables users to freely explore their data by making connections between different data points, without being constrained by rigid query-based approaches. In QlikView, the relationship between data elements is explored dynamically, allowing users to quickly uncover hidden patterns, trends, and correlations. This is particularly beneficial for businesses that want to perform ad-hoc analysis or need the flexibility to explore data from multiple perspectives. The associative model enables users to go beyond traditional reporting by offering a more comprehensive and interactive way to analyze data.
In-Memory Technology
QlikView’s in-memory technology plays a pivotal role in its ability to process and analyze large datasets in real-time. Unlike traditional BI tools that query databases in real-time, QlikView stores data in memory, which accelerates data processing and allows for fast querying and reporting. This means that users can interact with data almost instantaneously, regardless of the size of the dataset. In-memory technology is essential for organizations dealing with large volumes of data, as it enables them to perform complex analyses without compromising on speed. The ability to quickly explore and Data Analytics enhances the overall user experience and makes decision-making faster and more efficient.
Customizable Dashboards
QlikView offers highly customizable dashboards that allow users to design their visualizations to meet specific business needs. With drag-and-drop functionality, users can easily create interactive charts, graphs, and tables, displaying data in the most meaningful way for their organization. The customizable nature of QlikView’s dashboards means that users can tailor their views based on key metrics, KPIs, or business goals. Whether you need a high-level executive dashboard or a detailed operational report, QlikView gives you the flexibility to design dashboards that suit your specific requirements.
Data Exploration and Discovery
QlikView encourages data exploration and discovery by allowing users to dive deep into datasets and uncover insights without the need for predefined queries. Users can click through data points, filter, drill down, or make selections to reveal different perspectives and relationships. This level of interactivity makes QlikView an ideal platform for businesses that want to empower their teams with self-service BI capabilities. Instead of relying on IT or Data Science specialists to generate reports, employees can explore data on their own, gaining valuable insights that can inform decision-making across the organization.

How QlikView Enhances Decision Making
QlikView is more than just a BI tool—it’s an enabler of smarter, faster decision-making. One of its primary advantages is the ability to accelerate decision-making through its high-speed, interactive platform that allows users to access and analyze data in real-time. Whether it’s a sales team tracking performance or a marketing department examining customer trends, QlikView ensures insights are always at users’ fingertips. By eliminating traditional barriers like slow report generation or rigid query structures, it empowers teams to act swiftly and confidently. Beyond speed, QlikView supports a shift toward data-driven insights by transforming raw data into meaningful visualizations and interactive reports, making it a key component in Business Analyst Training. This empowers organizations to move from intuition-based choices to evidence-backed decisions, providing a crucial competitive edge. Its powerful visualizations help users detect trends, anomalies, and patterns that might otherwise go unnoticed. Additionally, QlikView enhances collaboration across departments by allowing teams to share dashboards and insights in real-time. With its cloud-based capabilities, stakeholders can easily access the latest data, fostering alignment and enabling more coordinated, informed business strategies.
Excited to Obtaining Your Business Analyst Certificate? View The Business Analyst Training Offered By ACTE Right Now!
The Role of QlikView in Data Visualization
- QlikView excels in the field of data visualization by offering rich, interactive, and customizable visualizations that make it easy for users to understand complex datasets.
- The platform includes a wide variety of chart types, including bar charts, pie charts, heat maps, and geographical maps, allowing users to represent data in the most intuitive way possible.
- In addition to its built-in visualizations, QlikView’s drag-and-drop functionality gives users complete control over how they display and interact with data.
- Whether you’re creating a simple report or a complex dashboard, QlikView ensures that your Data Visualization Tools are as clear, engaging, and actionable as possible.
- The interactive nature of QlikView’s visualizations also allows users to explore data in a non-linear fashion.
- Instead of simply viewing a static chart, users can drill down into specific data points, filter information, and even combine multiple datasets for deeper analysis.
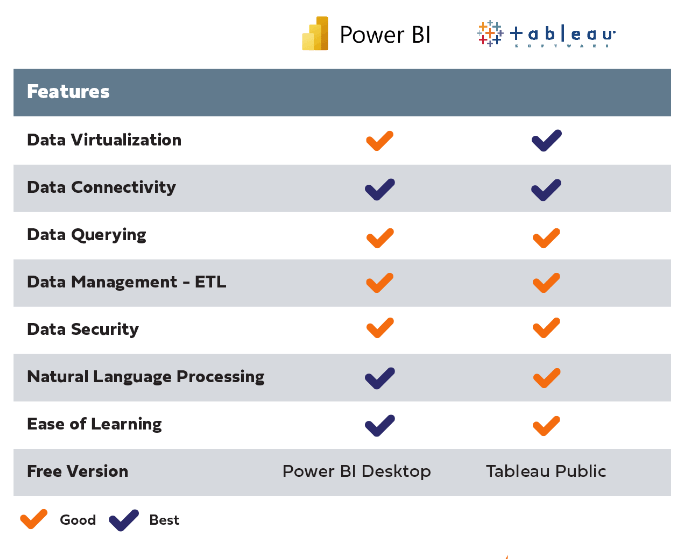
- When comparing QlikView to other BI tools such as Tableau or Power BI, several key distinctions become apparent. While Tableau is renowned for its excellent visualization capabilities, QlikView offers a more robust data exploration experience with its associative data model.
- QlikView’s ability to connect disparate datasets and uncover hidden insights sets it apart from many other BI tools. Similarly, QlikView’s in-memory technology gives it a performance edge, particularly for organizations working with large datasets.
- While Power BI is a more affordable option, QlikView offers greater customization and flexibility in terms of reporting and data exploration. Ultimately, QlikView is best suited for organizations that need deep, detailed analytics and the ability to explore data in real-time, while tools like Tableau and Power BI may be better choices for organizations that prioritize ease of use and advanced visualization.
Interested in Pursuing Business Intelligence Master’s Program? Enroll For Business Intelligence Master Course Today!
QlikView’s Scalability and Performance
QlikView is designed to handle large-scale data and can scale as the organization grows. Whether you’re dealing with hundreds of thousands of rows of data or terabytes of information, QlikView’s in-memory processing ensures that it performs at high speed without compromising on analysis capabilities. The platform is highly scalable, making it ideal for organizations of all sizes – from small businesses to large enterprises. Its ability to process and analyze massive datasets in real-time allows decision-makers to stay ahead of the curve and respond to changes in the business environment with agility. QlikView’s performance is enhanced by its distributed architecture, which enables it to process large volumes of data across multiple nodes, ensuring that it can handle the most demanding analytical tasks with ease.
QlikView vs Other BI Tools
Getting Ready for a Business Analyst Job Interview? Check Out Our Blog on Business Analyst Interview Questions & Answer
Conclusion
In today’s data-driven world, QlikView stands as one of the most powerful BI tools available, helping organizations make smarter, faster, and more informed decisions. Its unique combination of an associative data model, in-memory processing, and interactive visualizations makes it an invaluable tool for businesses seeking to uncover insights from their data. Whether you’re a large enterprise or a small business, QlikView enables you to explore data from multiple perspectives, identify trends and patterns, and make decisions based on real-time information, making it a valuable tool in Business Analyst Training. Its customizable dashboards and user-friendly interface ensure that users of all skill levels can harness the power of data to drive business success. By empowering users to make data-driven decisions, improve collaboration, and gain deeper insights, QlikView proves to be a thrilling BI tool that transforms the decision-making process – making it faster, smarter, and more impactful than ever before.