
Last updated on 10th Jun 2025| 11590
- Introduction
- What is Level of Detail (LOD) in Tableau?
- Types of LOD Expressions
- How LOD Expressions Work
- When to Use LOD Expressions
- Common Use Cases for LOD in Tableau
- Troubleshooting Common LOD Issues
- Conclusion
Introduction
In the world of data visualization, one of the most common challenges analysts face is working with data at multiple levels of granularity. For example, you might need to show average sales per customer, even when your dashboard is grouped by region or product. These scenarios require calculations that go beyond the dimensions currently shown in the view. This is where Level of Detail (LOD) expressions in Tableau become incredibly useful. Level of Detail expressions allow you to control the level at which data is aggregated, independent of the view’s structure. With LOD, you can perform calculations at a higher or lower granularity than what’s visible in your visualization, making your insights more accurate and flexible in Business Analyst Training. In this blog, we’ll break down what LOD expressions are, how they work, and when to use them. You’ll learn about the three main types of LOD expressions: FIXED, INCLUDE, and EXCLUDE, each designed for specific use cases. We’ll also explain their syntax, execution order, and behavior in dashboards. Whether you’re looking to create custom benchmarks, compare individual vs. group performance, or ensure consistent aggregation across filters, LOD expressions provide the tools you need to solve complex analytical problems with ease. We’ll also provide real-world examples and best practices to help you use LOD effectively. By the end, you’ll have a strong understanding of how to apply Level of Detail expressions in Tableau to build smarter, more dynamic dashboards that provide deeper business insights.
Interested in Obtaining Your Business Analyst Certificate? View The Business Analyst Training Offered By ACTE Right Now!
What is Level of Detail (LOD) in Tableau?
Level of Detail (LOD) in Tableau refers to the specific granularity at which data aggregation and calculations are performed. By default, Tableau aggregates data based on the dimensions included in a visualization. This means the level of detail in your view directly influences how values like sums, averages, or counts are calculated. However, in many real-world scenarios, Insights-as-a-Service may need to compute values at a different level than what’s currently shown for instance, calculating customer-level averages while displaying region-level data. This is where LOD expressions come into play. LOD expressions allow you to explicitly define the level of granularity at which an aggregation should be performed, regardless of the dimensions in the current view. They provide the flexibility to compute metrics at a fixed, included, or excluded level of detail, giving you greater control over how Tableau processes and displays your data. For example, you can use LOD expressions to calculate the total sales per customer (using FIXED) even if your dashboard shows sales by product or region.
Or, you might use EXCLUDE to remove a dimension from a calculation, such as computing total sales while excluding region-level breakdowns. These expressions are especially valuable when working with complex datasets, hierarchical data structures, or nested aggregations. By mastering LOD expressions, you can enhance the analytical depth and accuracy of your Tableau dashboards, creating more meaningful insights that align with your business logic and goals.
Types of LOD Expressions
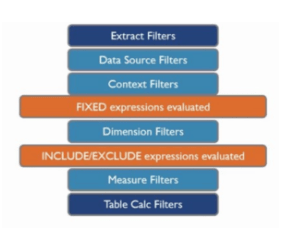
- Order of Execution: LOD expressions are evaluated after context filters but before dimension filters. This allows for more precise control over how data is processed.
- Syntax Format: All LOD expressions follow this structure: {TYPE [Dimension] : Aggregation([Measure])}, such as {FIXED [State] : AVG([Sales])}.
- Use in Calculated Fields: LOD expressions can be used inside calculated fields, enabling advanced logic, benchmarking, and stable aggregations in dashboards and worksheets.
- FIXED LOD Expression: The FIXED LOD expression calculates a value using only the dimensions specified, regardless of what’s in the current view. What Is Corporate Social Responsibility CSR? It’s great for stable, consistent values across different views.
- INCLUDE LOD Expression: The INCLUDE LOD expression adds one or more dimensions to the view level for the purpose of the calculation. It’s useful when you want more granularity in your calculation than the visualization currently shows.
- EXCLUDE LOD Expression: The EXCLUDE LOD expression removes dimensions from the view level during calculation. For instance, {EXCLUDE [Region] : SUM([Sales])} will return total sales excluding the breakdown by region.
- View-Dependent Behavior: INCLUDE and EXCLUDE are view-dependent, meaning their results can change based on what dimensions are present in the visualization. FIXED is not view-dependent.
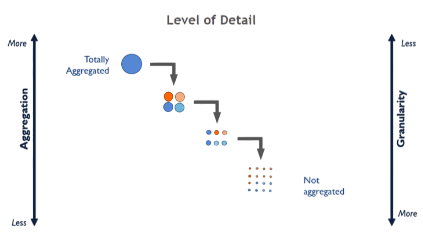
- Definition of LOD: LOD (Level of Detail) expressions allow you to control the level at which data is aggregated, independent of the view. This means you can define calculations at a more granular or broader level than what is shown in your visualization.
- Three Types of LOD: Tableau provides three types of LOD expressions FIXED, INCLUDE, and EXCLUDE. FIXED calculates a value based on specified dimensions, INCLUDE adds dimensions to the view level, and EXCLUDE removes dimensions from the view level during the calculation in Business Analyst Training.
- FIXED LOD Expression: This type ignores the dimensions in the view and calculates based on the ones specified. For example, {FIXED [Customer ID] : SUM([Sales])} computes total sales per customer, no matter how the data is grouped in the worksheet.
- INCLUDE LOD Expression: This expression adds additional dimensions to the view level. For instance, {INCLUDE [Product] : AVG([Profit])} calculates the average profit per product, even if the product is not part of the current view.
- EXCLUDE LOD Expression: This removes certain dimensions from the calculation. {EXCLUDE [Region] : SUM([Sales])} computes the total sales while ignoring the regional breakdown in the view.
- Aggregation Control: LOD expressions give you precise control over how and at what level data is aggregated, which is especially useful for nested or comparative calculations.
- Calculation Independence: LOD expressions are processed before filters (except data source and context filters), making them ideal for creating stable calculations that remain consistent regardless of user interactions.
- Fixed Aggregation Regardless of View: The FIXED LOD expression allows you to calculate values at a specific dimension level, independent of the current view.
- Benchmarking Metrics: Use LOD to calculate benchmarks, such as average sales by state, and then compare individual store performance against those benchmarks.
- Time-Based Comparisons: LOD expressions can be used to compute values such as monthly or yearly averages that stay constant even as the visualization drills down into weekly or daily data.
- Comparing Individual vs. Group Performance: LOD expressions are ideal for comparing individual performance against a group. Data Mining Vs Statistics can help use them to calculate a person’s sales relative to the average sales in their region or team.
- Deduplicating Data: In datasets where the same transaction or record appears multiple times (due to joins or multiple entries), you can use an LOD expression to count distinct values, such as unique customers or orders, accurately.
- Creating Custom Ratios: When numerator and denominator are at different aggregation levels, LOD expressions help. For example, calculating profit per customer where profit is aggregated at the order level, but the customer is at a higher dimension.
- Filtering Without Affecting Calculations: LOD expressions can maintain calculations despite filters in the view. This is useful when you want to show filtered data while keeping the original total for comparison.
To Earn Your Business Analyst Certification, Gain Insights From Leading Data Science Experts And Advance Your Career With ACTE’s Business Analyst Training Today!
How LOD Expressions Work

When to Use LOD Expressions
Knowing when to use Level of Detail (LOD) expressions in Tableau is key to solving complex analytical problems and producing accurate insights, especially when dealing with data at varying levels of granularity. You should consider using LOD expressions when the default aggregations in Tableau do not meet the specific needs of your analysis. For instance, if you’re displaying data at the regional level but need to calculate metrics at the customer level like average sales per customer you can use a FIXED LOD expression to perform this calculation independently of the current view. What Is the Importance Of Financial Analysis, LOD expressions are particularly useful in situations where you need stable calculations that do not change with filters or user interactions. For example, to show the percentage of total sales that each region contributes, while keeping the total fixed regardless of filters, a FIXED LOD helps maintain accuracy. You might also use INCLUDE LOD expressions when you need to perform calculations at a more granular level than the view, such as computing average order value by adding the order ID dimension temporarily. Conversely, EXCLUDE is helpful when you want to remove a certain dimension from a calculation like getting total sales across all categories while your view displays category-level data. In summary, use LOD expressions when you need precise control over aggregation, want to isolate calculations from filters, or when your desired level of computation differs from the visualization’s structure. Mastering their use greatly expands your analytical capabilities in Tableau.
Are You Considering Pursuing a Master’s Degree in Business Intelligence? Enroll in the Business Intelligence Master Program Training Course Today!
Common Use Cases for LOD in Tableau
Troubleshooting Common LOD Issues
Troubleshooting Level of Detail (LOD) expressions in Tableau can be challenging, especially when results don’t align with expectations. One of the most common issues arises from not understanding the order of operations in Tableau. LOD expressions are calculated after context filters but before dimension filters, which means standard filters can inadvertently affect your LOD results. To avoid this, use context filters when you want them to apply before the LOD is computed. Another frequent issue is mismatched granularity between the LOD expression and the view. For example, if you’re using a FIXED expression to calculate total sales per customer but your view displays data by region, the SAP Human Capital Management HCM result may not be meaningful unless handled carefully with supporting dimensions or calculations. Incorrect syntax can also cause LOD expressions to fail. Always follow the structure {TYPE [Dimension] : Aggregation([Measure])} and double-check that your dimensions and measures are valid. Tableau will flag syntax errors, but logical errors (e.g., using the wrong dimension) can go unnoticed and skew your results. Sometimes, users expect LOD expressions to be dynamic, like filters but LODs are static unless tied to parameters or other interactive elements. Also, be cautious when combining LODs with table calculations, as the execution order can complicate outcomes. Lastly, check for null values or data type mismatches, especially when using calculated fields within LODs. Testing LOD expressions on simpler worksheets can help isolate problems before applying them to complex dashboards. Understanding these pitfalls ensures more accurate and reliable LOD usage.
Want to Learn About Business Analyst? Explore Our Business Analyst Interview Questions and Answers Featuring the Most Frequently Asked Questions in Job Interviews.
Conclusion
Level of Detail (LOD) expressions in Tableau are a powerful and flexible feature that allows users to precisely control the level at which data aggregations are performed, regardless of the structure or dimensions displayed in the current view. This means you can calculate values at different granularities such as customer-level totals within a regional sales report without changing the overall visualization. LOD expressions come in three types: FIXED, INCLUDE, and EXCLUDE, each serving unique purposes depending on whether you want to fix the aggregation at a specific dimension, add extra dimensions, or exclude certain dimensions from the calculation. By mastering these expressions, you can perform complex calculations such as computing percentages of totals, creating benchmarks, or comparing measures across multiple levels of detail in Business Analyst Training. This flexibility enables the development of sophisticated and interactive dashboards tailored to specific analytical requirements. For example, you might compare an individual store’s performance to the overall company average, or calculate rolling averages independent of the time granularity displayed. However, while LOD expressions offer advanced capabilities, it is important to follow best practices to maintain workbook performance. Overusing complex LOD calculations or applying them on large datasets without proper optimization can slow down your dashboards. Efficient use of context filters, limiting data scope, and testing calculations in simpler views can help maintain speed and responsiveness. Ultimately, LOD expressions empower Tableau users to gain deeper, more precise insights, supporting better decision-making by allowing granular, yet scalable, data analysis across a variety of business scenarios.


