Last updated on 09th Jun 2025| 11089
- Introduction
- What is Tableau Reporting?
- How Does Tableau Reporting Work?
- Key Capabilities of Tableau Reporting
- Types of Tableau Reports
- Best Practices for Tableau Reporting
- How to Create Effective Reports in Tableau
- Tableau Reporting vs. Traditional Reporting Tools
Introduction
Tableau Reporting is a powerful data visualization tool that transforms raw data into interactive, insightful dashboards and reports, enabling users to make data-driven decisions with clarity and confidence. Known for its user-friendly interface and robust analytics capabilities, Tableau allows individuals and organizations to connect to a wide range of data sources, from spreadsheets to cloud databases, and present complex information in an intuitive visual format. Whether it’s uncovering trends, identifying outliers, or tracking key performance indicators, Tableau simplifies the analytical process through dynamic visuals such as charts, graphs, maps, and dashboards. It supports real-time data updates and offers features like drag-and-drop customization, calculated fields, and filters, making it accessible for both technical and non-technical users. Additionally, it is an excellent tool for Business Analyst Training, providing hands-on experience with real-time data manipulation and analytics. With its collaborative features, stakeholders can easily share insights, ensuring everyone in the decision-making process is aligned with the latest data. Tableau also integrates with various platforms and supports scripting in languages like Python and R for advanced analytics. In today’s data-driven environment, Tableau Reporting serves as a vital tool for organizations seeking to harness the full potential of their data, enhance operational efficiency, and drive strategic growth through clear, impactful reporting.
Do You Want to Learn More About Business Analyst? Get Info From Our Business Analyst Training Today!
What is Tableau Reporting?
- Interactive Dashboards— Tableau allows users to build dashboards that offer real-time interaction, letting users drill down into data for deeper insights.
- Data Connectivity— It supports connections to a wide range of data sources, including Excel, SQL databases, cloud services, and big data platforms. For more advanced analysis, the Tableau Calculated Field guide provides users with step-by-step instructions to create custom calculations and enhance data insights.
- Drag-and-Drop Interface – Its intuitive interface enables users to create visualizations without the need for complex coding, making it accessible to non-technical users.
Tableau Reporting refers to the process of using Tableau, a leading business intelligence and data visualization tool, to create interactive, shareable dashboards and reports from various data sources. It enables users to analyze trends, monitor performance, and derive insights in a visually engaging and easy-to-understand manner. Tableau reporting helps businesses turn data into actionable knowledge, supporting better decision-making.
Key features of Tableau Reporting include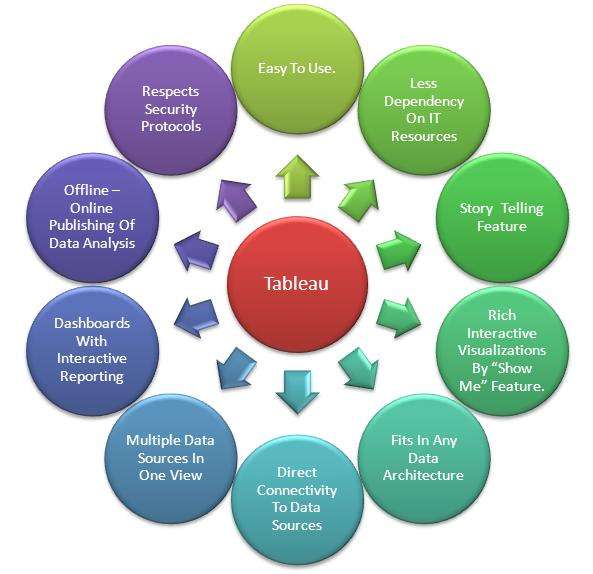
- Real-Time Data Analysis – Tableau can update dashboards in real-time, providing the most current data for timely decisions.
- Customizable Visuals – Users can choose from various chart types and formatting options to tailor reports to their specific needs.
- Collaboration and Sharing – Tableau enables easy sharing of reports via Tableau Server, Tableau Cloud, or PDFs, enhancing team collaboration and communication.
How Does Tableau Reporting Work?
Tableau Reporting works by connecting to various data sources, transforming raw data into structured formats, and visualizing it through interactive reports and dashboards. The process starts when users import data from diverse sources such as Excel, SQL databases, Google Sheets, or cloud-based services. Tableau’s powerful data engine processes this information, allowing users to clean, filter, and manipulate it using built-in tools without the need for programming skills. Through a simple drag-and-drop interface, users can select data fields and create visualizations like bar charts, line graphs, maps, and tables. This hands-on experience makes it an excellent tool for Business Analyst Training helping users develop essential skills in data visualization and analysis. Tableau also supports advanced analytics through calculated fields, trend lines, and predictive models. Reports are built into dashboards that allow for real-time interaction, users can drill down into data, apply filters, and customize views. These dashboards are then published and shared through platforms like Tableau Server or Tableau Cloud, ensuring that stakeholders can access the latest insights anytime, anywhere. Tableau also offers role-based permissions to ensure data security and access control. By automating updates and integrating with live data sources, Tableau ensures that reporting remains current and relevant, making it a critical tool for data-driven decision-making in modern businesses.
Would You Like to Know More About Business Analyst? Sign Up For Our Business Analyst Training Now!
Key Capabilities of Tableau Reporting
- Data Connectivity – Tableau connects seamlessly to various data sources, including spreadsheets, databases, cloud services, and big data platforms, enabling unified analysis across multiple systems.
- Interactive Dashboards – Users can create dashboards with filters, tooltips, and drill-down capabilities that allow viewers to explore data in real time. To enhance these dashboards, users can refer to the Create a Bullet Chart in Tableau for adding advanced visualizations that compare performance against targets effectively.
- Advanced Analytics – Tableau supports features like forecasting, trend analysis, clustering, and calculated fields to deliver deeper insights beyond basic reporting.
Tableau Reporting offers a wide range of features designed to simplify data analysis, enhance visual storytelling, and support informed decision-making. It transforms complex datasets into accessible, interactive visualizations that can be customized and shared across teams. These capabilities make Tableau a powerful tool for organizations looking to leverage data more effectively.
Key capabilities include:
- Real-Time Data Updates – With live data connections and scheduled refreshes, Tableau ensures that reports always reflect the most current information.
- User-Friendly Interface – The drag-and-drop functionality and intuitive design make it easy for both technical and non-technical users to create reports quickly.
- Collaboration and Sharing – Reports and dashboards can be securely shared through Tableau Server, Tableau Cloud, or exported, promoting collaboration and informed decision-making across teams.
- Know Your Audience – Design reports with the end users in mind. Understand their data needs, technical expertise, and decision-making requirements to create relevant and meaningful visualizations.
- Use Consistent Design Elements – Maintain uniformity in colors, fonts, and layout across dashboards to ensure a professional look and improve readability.
- Simplify Visualizations – Avoid clutter by using only necessary charts and elements. Focus on key metrics and keep visuals clean to highlight insights effectively. This approach aligns well with Business Intelligence Architecture solutions, which emphasize streamlined data presentation and efficient visualization for better decision-making.
- Optimize Performance – Use data extracts instead of live connections when possible, minimize filters, and limit complex calculations to improve loading times and performance.
- Leverage Interactivity Wisely – Include filters, tooltips, and drill-downs to allow users to explore data, but avoid overcomplicating the experience.
- Validate and Test Reports – Always verify data accuracy, test interactivity, and review usability before sharing reports with stakeholders to ensure reliability and trust.

Types of Tableau Reports
Tableau offers a wide variety of report types that cater to different business needs, enabling users to visualize and analyze data in the most effective ways. These reports are designed to present insights clearly and interactively, helping users make informed decisions. One of the most common types is Operational Reports, which track day-to-day business activities and key performance indicators (KPIs) in real time. Strategic Reports are used for long-term planning and trend analysis, providing a high-level view of organizational performance over time. Analytical Reports dive deep into data to uncover patterns, relationships, and anomalies, often using advanced calculations and visualizations. For example, the Tableau Stacked Bar Chart tutorial helps users learn how to visually compare multiple data segments within a single chart, enhancing report clarity and depth. Interactive Dashboards combine multiple visual elements like charts, maps, and filters in a single view, allowing users to explore data from different angles. Geographical Reports use Tableau’s mapping capabilities to display data based on location, which is useful for regional sales, logistics, or demographic analysis. Lastly, Storytelling Reports present data in a narrative format, guiding users through a sequence of visualizations to communicate insights clearly and persuasively. Each report type in Tableau is customizable and interactive, making it easy for users to tailor content to specific audiences and business objectives while ensuring data accuracy and accessibility.
Want to Pursue a Business Intelligence Master’s Degree? Enroll For Business Intelligence Master Program Training Course Today!
Best Practices for Tableau Reporting
Creating effective Tableau reports requires more than just visual appeal it involves thoughtful planning, clear data representation, and usability for the intended audience. By following best practices, users can ensure their dashboards and reports are not only visually engaging but also accurate, efficient, and easy to understand. These practices help in maximizing the impact of data-driven insights.
How to Create Effective Reports in Tableau
Creating effective reports in Tableau involves a strategic approach that combines clear objectives, thoughtful design, and data accuracy. The process begins by understanding the report’s purpose and the audience it serves, which helps determine the key metrics and the level of detail required. Next, connect to the appropriate data sources and ensure the data is clean, accurate, and structured for analysis. Use Tableau’s drag-and-drop interface to build visualizations that best represent the data bar charts, line graphs, maps, or tables, depending on the type of insights needed. Maintain simplicity in design by avoiding clutter and using consistent colors, labels, and formatting to improve readability. Understanding these best practices is especially valuable when exploring Tableau Developer Salary in India insights, as clear and professional dashboards can reflect the skill level that influences earning potential. Utilize calculated fields and filters to customize views and highlight trends, outliers, or comparisons. Incorporate interactive elements like drop-down menus, tooltips, and drill-downs to allow users to explore the data on their own. Group related visualizations into dashboards that provide a comprehensive, at-a-glance view of key information. Before sharing, thoroughly test the report for functionality and accuracy, and seek feedback from stakeholders. Finally, publish the report using Tableau Server or Tableau Cloud, ensuring proper permissions are in place. A well-crafted Tableau report not only delivers insights but also enhances data-driven decision-making across the organization.
Want to Learn About Business Analyst? Explore Our Business AnalystInterview Questions and Answers Featuring the Most Frequently Asked Questions in Job Interviews.
Tableau Reporting vs. Traditional Reporting Tools
Tableau Reporting significantly differs from traditional reporting tools in terms of flexibility, interactivity, and user experience. While traditional tools like Excel, Crystal Reports, or static BI platforms often rely on manual data entry, predefined templates, and limited interactivity, Tableau offers dynamic, real-time data visualization with a user-friendly, drag-and-drop interface. Traditional reports are typically static and require IT or technical teams to modify layouts or update data, which can delay decision-making. In contrast, Tableau empowers business users to explore data independently, apply filters, and drill down into details without needing coding skills.Tableau’s interactive dashboards allow for real-time data updates and visual storytelling, whereas traditional tools focus more on tabular data presentation and scheduled reporting. This makes Tableau an ideal platform for Business Analyst Training, offering a practical approach to data visualization and real-time decision-making skills. Additionally, Tableau supports a wide variety of data sources and provides seamless integration, while older tools may have limitations in connecting to modern cloud-based platforms. Collaboration is also enhanced in Tableau through its cloud-based sharing options, enabling teams to access and act on insights from anywhere. Overall, Tableau modernizes the reporting process by making it faster, more accessible, and visually engaging, helping organizations move beyond static reports to a more agile, data-driven decision-making environment.