
Last updated on 10th Jun 2025| 11362
- Introduction
- What Are Parameters in Tableau?
- Key Features of Tableau Parameters
- How to Create Parameters in Tableau
- Types of Parameters You Can Create
- How to Use Parameters in Tableau
- Advanced Uses of Parameters in Tableau
- Conclusion
Introduction
When working with data visualizations, enabling end-users to interact dynamically with the data is essential for creating engaging and insightful dashboards. Tableau parameters offer a powerful way to introduce this interactivity by allowing users to input or select values that control various aspects of the visualization in real time. Unlike filters, which are tied to specific fields, parameters are independent and can be used more flexibly to drive calculations, control reference lines, swap measures or dimensions, and adjust thresholds, among other uses. Parameters enhance user experience by making dashboards more adaptable to different scenarios and analysis needs. For example, a parameter can allow users to select a sales target, which then updates visual indicators across the dashboard to show progress against that goal for Business Analyst Training. Or it can let users choose between different metrics like profit, revenue, or quantity sold without needing separate dashboards. In this blog, we will walk through how to create parameters step-by-step in Tableau, including naming them, selecting appropriate data types, and defining allowable values such as fixed lists, ranges, or all values. We’ll also discuss best practices for displaying parameters on dashboards and integrating them with calculated fields for maximum flexibility. By understanding how to effectively implement parameters, you can build more interactive and user-friendly Tableau dashboards that empower users to explore data on their terms, uncover insights, and make better-informed decisions. This hands-on control ultimately elevates the impact and usability of your data visualizations.
Do You Want to Learn More About Business Analyst? Get Info From Our Business Analyst Training Today!
What Are Parameters in Tableau?
Parameters in Tableau are dynamic values that act as placeholders or variables, allowing users to interactively change inputs within a dashboard or worksheet. Unlike filters, which restrict data based on field values, parameters are independent and can be used in calculations, reference lines, filters, and even to swap dimensions or measures. The 8 Hidden Wastes makes it flexibility makes parameters a powerful tool for creating interactive and customizable visualizations. A parameter can accept different types of input, including single values like numbers, dates, or strings. Users can define the allowable values for a parameter as a fixed list, a range of numbers, or any value within a specified domain. This ensures that users only input valid data, which can then drive changes in the visualization dynamically. For example, you might create a parameter to let users select a target sales goal. This value can then be used in calculated fields to highlight whether sales are meeting or exceeding the target. Another common use is to allow users to switch between different metrics, such as revenue, profit, or quantity sold, without needing multiple separate dashboards.
Parameters are displayed as controls on dashboards or worksheets, such as drop-down menus, sliders, or input boxes, making them user-friendly. Because they are not tied to specific fields, they can be reused across multiple calculations and views, enhancing consistency and reducing redundancy. In summary, parameters in Tableau provide a way to add interactivity, customization, and flexibility to data visualizations, empowering end-users to explore and analyze data according to their unique needs.
Key Features of Tableau Parameters
- Dynamic Input Control: Parameters allow users to input a single dynamic value that can be used to control different aspects of a Tableau dashboard or worksheet.
- Multiple Use Cases: Parameters can be used in various scenarios, including filtering views, controlling calculations, selecting dimensions or measures, setting thresholds, and driving reference lines.
- Custom Value Ranges: When creating a parameter, you can specify the type of value it accepts such as a fixed list, a numerical range, or even all possible values.
- Integration with Calculated Fields: One of the most powerful features is using parameters inside calculated fields. Business Analytics With R Programming Languages allows you to dynamically change formulas or logic based on the parameter value, offering customizable data views.
- Interactive Dashboard Controls: Parameters can be displayed as drop-downs, sliders, or input boxes directly on dashboards. This provides users with intuitive control to influence data visualizations without needing to interact with the underlying data.
- Enhancing User Experience: Parameters help create interactive and user-friendly dashboards by enabling users to make selections and explore data from different perspectives, all within one view.
- Global Application: A single parameter can affect multiple sheets or dashboards simultaneously, offering centralized control and ensuring a consistent user experience across the workbook.
- Open the Data Pane: Start by opening your Tableau worksheet. On the left side of the screen, you’ll find the Data Pane, where all your fields and data sources are located. Right-click anywhere in the blank space within this pane to begin creating a parameter.
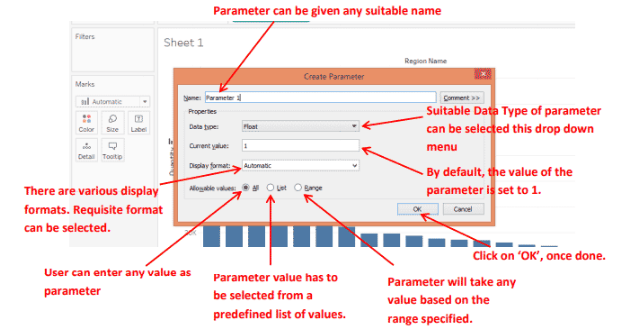
- Select “Create Parameter”: From the right-click menu, choose the option “Create Parameter.” This opens the parameter creation dialog box where you can define the parameter’s settings, such as name, data type, and values in Business Analyst Training.
- Name Your Parameter: Give your parameter a clear and descriptive name that reflects its purpose, such as “Select Metric” or “Choose Sales Target.” This helps when referencing it in calculations or when adding it to your dashboard.
- Choose the Data Type: Select the appropriate data type this could be integer, float, string, boolean, or date depending on how you intend to use the parameter.
- Set Allowable Values: Decide how users will interact with the parameter. You can define a list of values, a range of values, or allow all values. For controlled options like measure selection, use a list.
- Set a Default Value: Choose a default value that will be pre-selected when the parameter is first displayed. This improves usability and ensures the view loads properly.
- Click OK and Show Parameter Control: Once created, click OK, then right-click the parameter and select “Show Parameter” to make it visible for user interaction on the worksheet or dashboard.
- Understanding Parameters: Parameters in Tableau are dynamic values that can replace a constant in calculations, filters, or reference lines. Unlike filters, which are tied to specific fields, parameters are independent and can be used across multiple fields, calculations, and visualizations.
- Creating a Parameter: To create a parameter, right-click in the Data pane and choose “Create Parameter.” You can define its name, data type (e.g., integer, string, float, date), allowable values (fixed list, range, or all), and default value. This flexibility allows parameters to be tailored to specific use cases.
- Displaying Parameters: After creation, right-click the parameter and select “Show Parameter.” It rises a question What Are Market Structures. This displays a control on your dashboard or worksheet where users can input or select a value.
- Using Parameters in Calculations: Parameters are often used within calculated fields. For example, you can create a calculation that changes based on the selected parameter value, allowing users to control what is shown in a visualization (e.g., switching between different metrics like Sales or Profit).
- Controlling Filters with Parameters: Parameters can be used to drive filter logic. For instance, users can select a region from a parameter dropdown, and a calculated field using that parameter will filter the data accordingly.
- Switching Between Measures or Dimensions: A common use case is using a parameter to switch between different measures (e.g., Revenue vs. Quantity). This makes dashboards more interactive and user-friendly.
- Enhancing Interactivity: Parameters add a layer of interactivity to dashboards. They enable users to make selections that dynamically influence the data view, which improves user engagement and supports better decision-making.
To Explore Business Analyst in Depth, Check Out Our Comprehensive Business Analyst Training To Gain Insights From Our Experts!
How to Create Parameters in Tableau

Types of Parameters You Can Create
In Tableau, parameters come in several types that allow you to tailor user input based on your specific analysis needs. The most common types include Integer, Float, String, and Date parameters. Integer parameters accept whole numbers, making them ideal for inputs like sales targets, ranks, or counts. Float parameters handle decimal values, which are useful for precise inputs such as percentages, averages, or financial metrics requiring decimal accuracy. String parameters allow users to enter or select text values, making them perfect for choosing categories, Cost of Quality , regions, or toggling between different dimensions or measures in a dashboard. Date parameters enable users to pick specific dates or date ranges, which is essential for time-based analyses like filtering data by a start or end date. When creating parameters, you can specify allowable values as a fixed list, a range, or allow any valid value within the parameter type, ensuring users provide valid and meaningful inputs. This flexibility helps prevent errors and makes your dashboards more interactive and user-friendly. By choosing the appropriate parameter type and configuring its values properly, you can build dynamic Tableau dashboards that respond to user inputs in real time, enhancing the overall data exploration experience and supporting more informed decision-making.
Gain Your Master’s Certification in Business Intelligence by Enrolling in Our Business Intelligence Master Program Training Course.
How to Use Parameters in Tableau
Advanced Uses of Parameters in Tableau
Parameters in Tableau are not just simple input controls; they can be leveraged in advanced ways to create highly interactive and dynamic dashboards. Beyond basic uses like filtering or swapping measures, parameters can drive complex calculations, control reference lines, and even customize entire views based on user input. For example, you can use parameters to build what-if analysis tools, where users adjust assumptions such as growth rates or budgets, and instantly see the impact on key metrics and forecasts. Another advanced use is to combine parameters with calculated fields to dynamically change the logic of calculations. This allows users to toggle between different formulas or aggregation methods without needing multiple worksheets for Business Analyst Training. For instance, a parameter can let users switch between calculating sales totals, averages, or running sums within the same visualization, making the dashboard much more flexible and powerful. Parameters can also be used to control top N filters, enabling users to select how many top-performing products or regions they want to view, without predefining fixed values. This interactive control improves user experience by allowing personalized data exploration. Additionally, parameters can drive conditional formatting, where the color or size of marks changes based on parameter values, helping highlight trends or outliers dynamically. They can even be integrated with Tableau’s JavaScript API to enable advanced web-based interactions. By harnessing these advanced parameter techniques, Tableau users can build dashboards that are not only visually appealing but also deeply interactive and tailored to a variety of analytical scenarios, empowering users to derive richer insights from their data.
Go Through These Business Analyst Interview Questions and Answers to Excel in Your Upcoming Interview.
Conclusion
Tableau parameters are an essential feature for adding interactivity and flexibility to your data visualizations. They act as dynamic variables that allow users to control various elements within a dashboard, such as filters, calculations, reference lines, or even the content displayed on the entire dashboard. Unlike filters, which limit data based on specific field values, parameters can accept a wide range of inputs, including numeric ranges, lists of values, or custom user entries. This versatility makes them ideal for creating dashboards that adapt to user preferences and requirements. By mastering how to create and implement parameters in Tableau, you unlock the ability to build highly interactive and engaging visualizations. What is Build Verification Testing? For example, parameters can enable users to select different metrics to display, adjust thresholds for highlighting data, or choose the number of top-performing products they want to analyze. This user-driven customization fosters deeper data exploration and better decision-making. Parameters also allow for the creation of “what-if” scenarios where users can modify assumptions like growth rates or budget targets and immediately see the impact reflected in the dashboard. Additionally, parameters can enhance user experience by controlling conditional formatting or swapping views dynamically, making your dashboards more intuitive and powerful. Overall, leveraging Tableau parameters effectively transforms static reports into interactive tools that invite users to engage with data on their own terms. This not only improves user satisfaction but also increases the overall value and impact of your Tableau workbooks.


