Last updated on 12th Jun 2025| 10838
- Introduction
- Overview of MSBI
- Overview of Power BI
- Use Cases for MSBI
- Use Cases for Power BI
- Pros and Cons of MSBI
- Pros and Cons of Power BI
- Conclusion
Introduction
Business Intelligence (BI) has become a critical component for organizations aiming to extract valuable insights from their data. In today’s data-driven landscape, businesses require efficient tools to analyze, interpret, and visualize information effectively. Microsoft offers two powerful BI solutions: MSBI (Microsoft Business Intelligence) and Power BI. Each of these tools serves distinct purposes and caters to different user needs, making it essential to understand their core functionalities, strengths, and limitations. MSBI is a comprehensive suite that includes SQL Server Integration Services (SSIS), SQL Server Analysis Services (SSAS), and SQL Server Reporting Services (SSRS), often covered in Business Analyst Training. It is primarily designed for complex data integration, transformation, and enterprise-level reporting, making it well-suited for organizations with large-scale data warehousing needs and those requiring robust backend processing. On the other hand, Power BI focuses on self-service analytics and data visualization. It allows users to create interactive dashboards and reports with ease, providing real-time insights and seamless integration with various data sources. Power BI’s user-friendly interface makes it accessible to business users and analysts who may not have deep technical expertise. This blog will provide a detailed comparison between MSBI and Power BI, exploring their architectures, features, common use cases, and advantages. By understanding these differences, organizations can select the right tool that aligns with their BI strategy, budget, and technical requirements, ultimately enhancing their data-driven decision-making capabilities.
Interested in Obtaining Your Business Analyst Certificate? View The Business Analyst Training Offered By ACTE Right Now!
Overview of MSBI
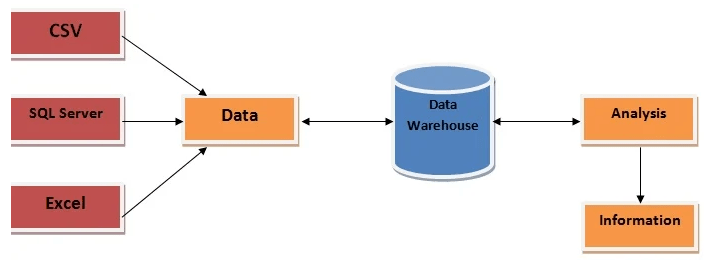
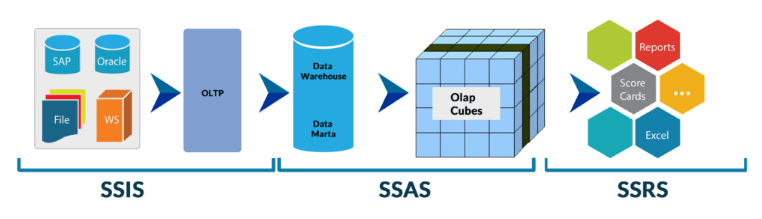
MSBI, or Microsoft Business Intelligence, is a powerful suite of tools designed to deliver end-to-end business intelligence solutions, including data integration, transformation, analysis, and reporting. It enables organizations to collect data from diverse sources, process and structure that data, and present it in an insightful and visually understandable format. MSBI is widely used for its scalability, reliability, and ability to handle large volumes of data across enterprise environments, similar to the capabilities highlighted in What is Splunk. The architecture of MSBI is structured around the traditional ETL (Extract, Transform, Load) process, ensuring that raw data is efficiently converted into meaningful information. It begins with the Data Source layer, where data is extracted from multiple sources such as SQL Server, Excel spreadsheets, Oracle databases, flat files, or cloud services. The ETL Process is managed through SQL Server Integration Services (SSIS), which extracts the data, transforms it to meet business rules, and loads it into the destination system. Once transformed, the data is stored in a Data Warehouse, typically hosted on SQL Server. This centralized storage allows for consistent, historical, and structured data to support business analytics.
For deeper insights, SQL Server Analysis Services (SSAS) is used to build multidimensional or tabular data models, enabling faster and more dynamic analysis. Finally, SQL Server Reporting Services (SSRS) provides robust reporting capabilities, allowing users to create detailed, paginated reports that can be delivered across various platforms. Together, these components of MSBI offer a comprehensive, integrated BI solution suitable for enterprise-level data management and decision-making.
Overview of Power BI
- What is Power BI: Power BI is a Microsoft business analytics service for creating interactive data visualizations and reports to support data-driven decision-making.
- Components: It includes Power BI Desktop, Power BI Service, Power BI Mobile, and Power BI Gateway, each serving roles from report creation to sharing and data connectivity.
- Data Connectivity: Power BI connects to numerous data sources like Excel, SQL Server, Azure, SharePoint, and Google Analytics, enabling seamless data integration.
- Data Modeling and Transformation: Users leverage Power Query and DAX to clean, transform, and model data for complex calculations and analysis, aligning with the principles of What is Six Sigma.
- Interactive Visualizations: The platform offers a wide range of customizable visuals and supports importing custom visuals for enriched data storytelling.
- Collaboration and Sharing: Reports can be published and shared via the Power BI Service, allowing real-time collaboration and scheduled data refreshes.
- Scalability and Integration: Power BI scales from small businesses to enterprises and integrates smoothly with Microsoft tools like Excel, Azure, and Teams.
- Data Integration: MSBI integrates data from various sources like SQL Server, Oracle, Excel, and flat files into a unified data warehouse using SSIS.
- Data Warehousing: It helps build structured data warehouses to store historical and current data for efficient querying and reporting, a key concept in Business Analyst Training.
- ETL Process Automation: MSBI automates the Extract, Transform, Load process, ensuring timely and accurate data migration to maintain data consistency.
- Business Reporting: Using SSRS, MSBI creates detailed, paginated reports for operational, financial, and compliance needs, delivering actionable insights.
- Data Analysis and Visualization: Power BI enables interactive data analysis, dashboards, and visualizations to track trends and KPIs for informed decision-making.
- Performance Monitoring: MSBI tracks key business metrics in real-time, alerting stakeholders to important changes and improving responsiveness.
- Integration with Microsoft Ecosystem: It integrates smoothly with Excel, SharePoint, Azure, and other Microsoft tools, facilitating collaboration and data sharing.
- Comprehensive Suite: MSBI provides a complete set of tools SSIS, SSAS, SSRS, and Power BI that handle data integration, analysis, reporting, and visualization within one platform.
- Integration with Microsoft Ecosystem: It integrates seamlessly with Microsoft products like SQL Server, Azure, Excel, and SharePoint, offering a familiar environment and easy data sharing.
- Scalability: MSBI supports projects of all sizes, from small businesses to large enterprises, making it suitable for various data warehousing and analytics needs earning its place among the Top Business Analytics Tools.
- Powerful ETL Capabilities: SSIS offers advanced ETL functionalities with numerous connectors and transformations, enabling efficient management of complex data workflows.
- Steep Learning Curve: MSBI tools such as SSIS and SSAS can be complex, requiring specialized skills which might be challenging for beginners or small teams.
- Cost: Licensing fees for SQL Server and MSBI components can be expensive, especially for enterprise-scale implementations.
- Limited Support for Non-Microsoft Platforms: MSBI is optimized for Microsoft environments, so integration with non-Microsoft data sources or platforms may be less efficient and more difficult.
To Earn Your Business Analyst Certification, Gain Insights From Leading Data Science Experts And Advance Your Career With ACTE’s Business Analyst Training Today!
Use Cases for MSBI

Use Cases for Power BI
Power BI is a versatile business intelligence tool from Microsoft that enables users to visualize and analyze data through interactive dashboards and reports. Its ease of use, integration capabilities, and powerful features make it suitable for a wide range of business use cases across various industries. One of the most common use cases for Power BI is real-time performance monitoring. Organizations use it to track key performance indicators (KPIs) across departments such as sales, marketing, finance, and operations. Dashboards provide live updates, allowing decision-makers to respond quickly to business changes. Another significant use case is financial reporting. Power BI simplifies the process of consolidating data from multiple financial systems, making it easier to generate income statements, balance sheets, and expense reports using Time Series Analysis Tactics. Finance teams can create dynamic visualizations to analyze costs, forecast budgets, and identify financial trends. In sales and marketing analytics, Power BI helps teams evaluate campaign performance, customer behavior, and lead conversion rates. By integrating data from CRM tools, email platforms, and social media, organizations can get a holistic view of their marketing ROI. Power BI is also used for supply chain and inventory management. Companies can track stock levels, supplier performance, and order fulfillment metrics to optimize operations. Additional use cases include customer support analysis, HR reporting, and project management dashboards, where teams monitor progress, identify bottlenecks, and allocate resources more efficiently. Overall, Power BI enables businesses to make informed, data-driven decisions by turning raw data into actionable insights through accessible and interactive visualizations.
Looking to Master Business Intelligence? Discover the Business Intelligence Master Program Training Course Available at ACTE Now!
Pros and Cons of MSBI
Pros and Cons of Power BI
Power BI is a widely adopted business intelligence tool developed by Microsoft, known for its robust data visualization, user-friendly interface, and seamless integration with various data sources. Like any tool, it comes with both advantages and limitations that organizations should consider before adoption. One of the major pros of Power BI is its ease of use. With a drag-and-drop interface and pre-built templates, even non-technical users can create compelling reports and dashboards. It also integrates well with Microsoft products such as Excel, Azure, and SQL Server, making it a natural choice for businesses already within the Microsoft ecosystem highlighting one of the Essential Skills Need to Master in Data Analyst. Another advantage is its cost-effectiveness, with flexible pricing models that cater to small businesses as well as large enterprises. Additionally, Power BI offers real-time data access and collaboration, allowing teams to share insights instantly and make timely decisions. Its AI capabilities, including natural language queries and predictive analytics, further enhance its appeal. However, Power BI also has its cons. One limitation is its performance with very large datasets, which can slow down if not optimized properly or if the Pro version is used instead of Premium. While it’s user-friendly, advanced data modeling and DAX (Data Analysis Expressions) can be challenging for beginners. Some users also report limited customization options compared to other visualization tools like Tableau. Additionally, Power BI’s dependence on the internet for the cloud-based service can be a drawback in environments with restricted connectivity. Despite these drawbacks, Power BI remains a powerful and flexible BI solution for most organizations.
Go Through These Business Analyst Interview Questions and Answers to Excel in Your Upcoming Interview.
Conclusion
Both MSBI (Microsoft Business Intelligence) and Power BI are robust business intelligence tools offered by Microsoft, each designed to meet different organizational needs. While they share the common goal of turning raw data into meaningful insights, their use cases, complexity, and target audiences differ significantly. MSBI is a comprehensive suite of tools, including SSIS for data integration, SSAS for analytics, and SSRS for reporting. It is best suited for large enterprises that handle massive amounts of structured data and require complex ETL processes, data warehousing, and traditional reporting. Its architecture supports in-depth data modeling and detailed, paginated reports ideal for industries like finance, healthcare, and manufacturing where regulatory reporting and historical data analysis are crucial, topics often covered in Business Analyst Training. On the other hand, Power BI is a modern, cloud-based BI platform designed for self-service analytics and real-time data visualization. It is ideal for smaller businesses or departments that need quick insights without deep technical expertise. With an intuitive interface and seamless integration with Excel, Azure, and other Microsoft tools, Power BI empowers users to build interactive dashboards and reports rapidly, encouraging a more data-driven culture. Ultimately, the choice between MSBI and Power BI depends on your organization’s size, infrastructure, budget, and specific BI objectives. In many cases, they can be used together with MSBI for backend processing and data preparation, and Power BI for front-end visualization and reporting. Choosing the right tool or combination ensures that your business intelligence strategy is both scalable and effective.


