- Definition of Business Intelligence (BI)
- Definition of Data Analytics
- Key Differences Between BI and Data Analytics
- Role of BI in Decision-Making
- Role of Data Analytics in Predictive Insights
- Tools Used in BI vs. Data Analytics
- Data Processing Techniques in BI vs. Analytics
- Reporting and Visualization Differences
- Industry Applications of BI and Data Analytics
- Integration of BI and Data Analytics in Businesses
- Future Trends in BI and Data Analytics
- Conclusion
Definition of Business Intelligence (BI)
Business Intelligence (BI) is the technology-driven process of collecting, organizing, analyzing, and presenting business data to support better decision-making. It encompasses a broad range of methodologies, tools, and applications, while Business Analyst Training equips professionals to help organizations transform raw data into meaningful insights. BI primarily focuses on descriptive and diagnostic analytics, aiming to answer questions such as “What happened?” and “Why did it happen?” At its core, BI provides a comprehensive view of an organization’s current and historical data. Through dashboards, reports, and scorecards, it visualizes performance metrics and key performance indicators (KPIs) that help executives and managers monitor business operations efficiently. BI tools such as Power BI, Tableau, and Qlik Sense enable businesses to gather data from multiple sources like sales, finance, operations, and marketing and present it in an easy-to-understand format for data-driven decision-making.
Are You Interested in Learning More About Business Analyst? Sign Up For Our Business Analyst Training Today!
Definition of Data Analytics
Data Analytics (DA), on the other hand, is a broader and more advanced discipline that involves examining raw data to uncover trends, correlations, and patterns that can predict future outcomes. Unlike BI, which focuses on describing what has already happened, data analytics seeks to answer “What will happen?” and “What should we do next?” by using statistical methods, algorithms, and machine learning models.
- Data analytics is categorized into four main types:
- Descriptive Analytics: Summarizes what happened historically.
- Diagnostic Analytics: Explains why something happened.
- Predictive Analytics: Forecasts future trends based on historical data.
Through these categories, data analytics enables organizations to move beyond static reporting and make strategic, evidence-based decisions that improve efficiency, profitability, and customer satisfaction. For those looking to streamline data preparation, understanding What is Tableau Prep? can be especially valuable.
Key Differences Between BI and Data Analytics
While BI and Data Analytics are closely related and often overlap, they differ in focus, purpose, and execution.
- Objective: BI is focused on operational efficiency and tracking performance, whereas Data Analytics aims to explore data for new patterns and future predictions.
- Data Scope: BI typically deals with structured data from internal sources. Data Analytics works with both structured and unstructured data, often from varied and external sources.
- Techniques Used: BI relies on dashboards, queries, and reports. Data Analytics employs statistical modeling, data mining, and machine learning.
- End Users: BI is used by managers, executives, and business users; Data Analytics is used by data scientists, analysts, and technical teams.
- Output: BI provides visual summaries and key metrics, while Data Analytics offers deep insights, forecasts, and actionable predictions, helping organizations decide between tools like Tableau vs Looker for their reporting and analytics needs.
In essence, Business Intelligence tells you what’s happening now, while Data Analytics tells you what’s likely to happen next and how you can influence those outcomes.
Role of BI in Decision-Making
Business Intelligence plays a pivotal role in enhancing decision-making by converting raw data into actionable insights. It provides leaders with a clear, real-time picture of their business performance, enabling them to make quick, informed, and data-backed decisions. For instance, BI dashboards can reveal underperforming regions in a sales network or identify which products are generating the most revenue.
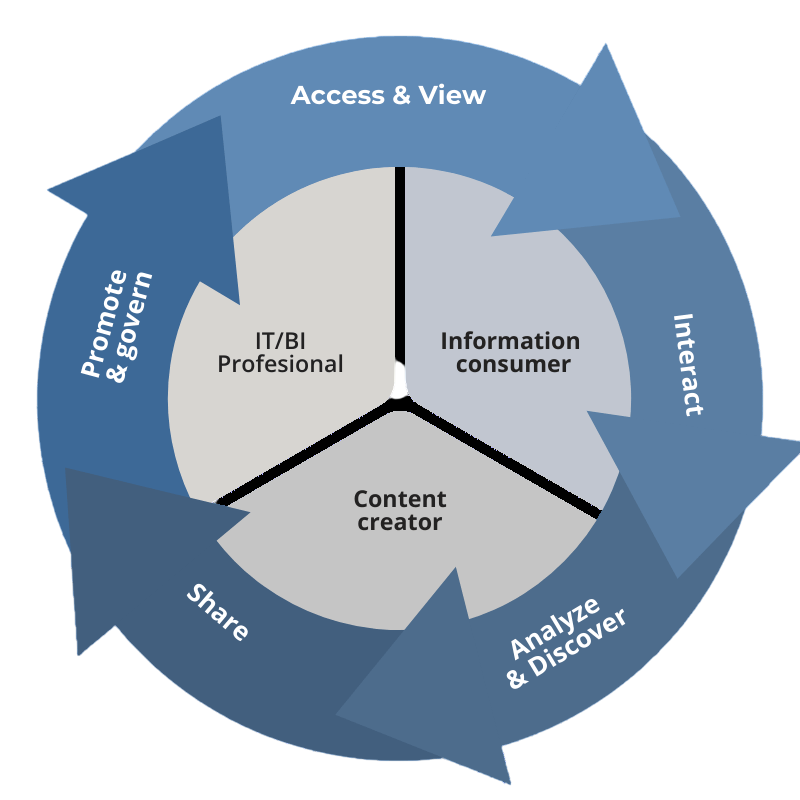
This allows management to allocate resources more effectively or adjust marketing strategies accordingly, a decision-making process similar to evaluating career paths like PGDM vs MBA for strategic growth. BI also facilitates data democratization, meaning that even non-technical employees can access and interpret data easily. Moreover, BI tools support strategic planning by consolidating metrics across departments. By tracking KPIs such as sales growth, customer satisfaction, and inventory turnover, organizations can identify trends early and take corrective actions before small issues escalate into major problems.
Role of Data Analytics in Predictive Insights
Where BI focuses on descriptive insights, Data Analytics excels at predictive and prescriptive insights. It helps organizations understand patterns hidden within large datasets and forecasts potential future scenarios. For example, a retail company can leverage predictive analytics along with Data Warehouse Tools to forecast seasonal demand, optimize inventory levels, and personalize promotions effectively. Financial institutions employ it to predict credit defaults and detect fraudulent activities, while healthcare providers use it to anticipate patient readmissions or disease outbreaks. Through machine learning models and advanced algorithms, data analytics goes beyond static reporting it dynamically adapts and improves predictions over time. As a result, organizations can transition from reactive to proactive operations, gaining a competitive edge by anticipating customer needs and market trends.
Tools Used in BI vs. Data Analytics
- Business Intelligence Tools:
- Microsoft Power BI: Integrates seamlessly with Excel and Azure, offering strong visualization and collaboration features.
- Qlik Sense: Enables associative data modeling for deeper insights.
- Google Looker Studio: A free cloud-based tool for interactive reports.
- Python and R: Used for data manipulation, visualization, and machine learning.
- Apache Spark: Handles large-scale data processing and real-time analytics.
- SAS and MATLAB: Preferred in scientific and financial analytics.
BI tools are designed to simplify data visualization, reporting, and performance tracking. Popular BI tools include:
BI tools focus on ease of use and self-service analytics, making them accessible to non-technical users, especially when supported by Business Analyst Training .
Data Analytics Tools:Data analytics tools are more technical and are often used for deep statistical and predictive modeling. Common tools include:
While BI tools prioritize visualization and decision support, data analytics tools emphasize computation, modeling, and predictive capabilities.
Looking to master Business Analyst? Sign up for ACTE’s Business Intelligence Master Program Training Course and begin your journey today!
Data Processing Techniques in BI vs. Analytics
The process of handling and transforming data differs significantly between BI and Data Analytics. In Business Intelligence, data undergoes ETL (Extract, Transform, Load) operations. It’s extracted from transactional systems, transformed into a consistent format, and loaded into a data warehouse. BI tools then pull data from the warehouse for visualization and reporting. This structured process ensures consistency and reliability in business reports. In contrast, Data Analytics uses ELT (Extract, Load, Transform) workflows that are more flexible for large and unstructured datasets. It incorporates data cleaning, feature selection, and statistical modeling. Analytical systems often integrate with data lakes, where both structured and unstructured data are stored. These techniques allow data scientists to run experiments, train predictive models, and derive real-time insights, helping them choose between tools like Alteryx vs Tableau for efficient data preparation and visualization.
Reporting and Visualization Differences
Reporting and visualization are central to both BI and analytics, but they serve different purposes. In Business Intelligence, visualization focuses on clarity, consistency, and accessibility. Dashboards present performance metrics, financial results, or operational KPIs in visually appealing charts and graphs. Tools like Power BI and Tableau allow users to interact with data dynamically but maintain a business-friendly design for decision-makers. Data Analytics visualization, however, is more exploratory and technical. It may include scatter plots, heat maps, regression lines, and correlation matrices. Analysts use these visuals to test hypotheses, identify patterns, and communicate findings to technical and business teams. In short, BI visualizations are for monitoring, while analytics visualizations are for discovery.
Preparing for Business Analyst interviews? Visit our blog for the best Business Analyst Interview Questions and Answers
Industry Applications of BI and Data Analytics
Both BI and Data Analytics are applied across multiple sectors, driving efficiency and innovation.
- Retail: BI helps track daily sales and inventory, while analytics predicts consumer demand and optimizes pricing.
- Finance: BI supports financial reporting and compliance, while analytics detects fraud and forecasts market risks.
- Manufacturing: BI monitors production efficiency, while analytics enables predictive maintenance and quality control.
- Education: BI tracks student performance and funding, while analytics personalizes learning experiences and identifies at-risk students.
- Telecommunications: BI monitors customer service metrics, and analytics predicts churn and improves retention strategies.
These use cases demonstrate how BI improves operational visibility and enables Root Cause Analysis , while analytics drives innovation through data exploration.
Integration of BI and Data Analytics in Businesses
Modern organizations are increasingly integrating BI and Data Analytics into a unified ecosystem. While BI provides structured insights for day-to-day management, analytics adds depth through predictive and prescriptive modeling. For example, a BI dashboard, using platforms like MicroStrategy vs Power BI , may show that customer satisfaction scores have dropped, while analytics can determine the underlying reasons and predict which customers are likely to churn. Integrating both enables organizations to have a complete data intelligence cycle from monitoring to prediction to optimization. Cloud platforms like Microsoft Azure, Google Cloud, and AWS now offer integrated environments that combine BI dashboards with machine learning pipelines. This hybrid approach empowers companies to leverage both operational intelligence and predictive analytics under one ecosystem.
Future Trends in BI and Data Analytics
The line between BI and Data Analytics is rapidly blurring as both evolve with technological advancements.
- Augmented Analytics: BI platforms are integrating AI to automate data preparation and generate insights with minimal user input.
- Real-Time Analytics: As IoT and streaming data grow, organizations are adopting tools that provide instant insights from live data.
- Natural Language Processing (NLP): BI tools in modern Business Intelligence platforms now allow users to query data using voice commands or natural text.
- Self-Service BI: Empowering non-technical users to create their own reports without IT intervention.
- Predictive BI: The next generation of BI tools will integrate AI and ML to forecast outcomes directly within dashboards.
These trends signify a convergence where BI becomes more intelligent and analytics becomes more accessible paving the way for data-driven enterprises of the future.
Conclusion
In conclusion, Business Intelligence and Data Analytics are two sides of the same coin, both essential for thriving in today’s data-driven world. BI focuses on understanding the present, tracking performance, visualizing data, and improving efficiency, while Business Analyst Training equips professionals to leverage these insights, and Data Analytics explores the future, predicting outcomes and recommending strategic actions. Organizations that leverage both gain the ability to analyze the past, understand the present, and shape the future. BI provides the foundation for reliable reporting, and Data Analytics builds upon it to drive innovation. As technologies like AI, ML, and cloud computing evolve, the integration of BI and analytics will become not just beneficial but essential for every business that aspires to compete intelligently in the digital age.


