- Introduction
- Key Features of Power BI Desktop
- How Power BI Desktop Works
- Advantages of Power BI Desktop
- Limitations of Power BI Desktop
- Power BI Desktop vs. Power BI Service
- How to Download and Install Power BI Desktop
- Conclusion
Introduction
In the world of business analytics, Power BI has established itself as one of the most powerful tools for transforming raw data into meaningful insights. At the heart of this ecosystem is Power BI Desktop, a free, Windows-based application designed specifically for creating reports and visualizations. Whether you are an individual analyst or part of a larger team, Power BI Desktop provides a versatile platform to connect to a wide range of data sources, transform and clean that data, and build interactive reports and dashboards. Power BI Desktop supports connections to various data sources, including databases, Excel files, cloud services, and web APIs. Once data is imported, users can leverage its robust data transformation tools to shape and model the data to fit specific business needs, a key skill taught in Business Analyst Training. With a rich set of visualization options, including charts, graphs, maps, and custom visuals, users can create engaging and interactive reports that make complex data easier to understand. Moreover, Power BI Desktop seamlessly integrates with the broader Power BI ecosystem. Reports created in Power BI Desktop can be published to the Power BI Service, enabling sharing and collaboration across an organization. This cloud-based platform allows stakeholders to access reports and dashboards on any device, ensuring that insights are available anytime, anywhere. This blog will provide an in-depth look at Power BI Desktop, highlighting its key features and demonstrating how it fits within the larger Power BI environment. By the end of this guide, you will have a clear understanding of how to use Power BI Desktop effectively to meet your data analytics needs and drive better business decisions.
Do You Want to Learn More About Business Analyst? Get Info From Our Business Analyst Training Today!
Key Features of Power BI Desktop
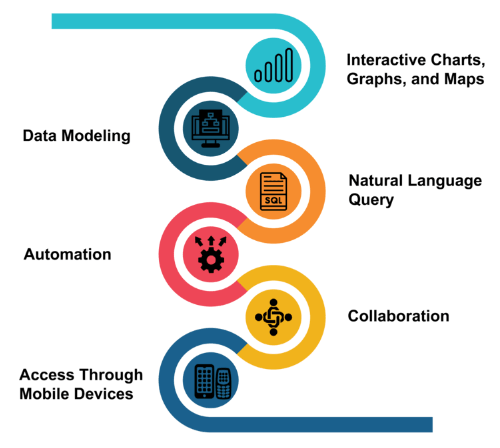
Power BI Desktop is a feature-rich tool designed to empower data analysts and business intelligence professionals with the ability to transform raw data into meaningful insights. One of its standout capabilities is the seamless process of importing, cleaning, and modeling data from various sources, including databases, Excel files, and cloud services. This flexibility allows users to prepare their data accurately and efficiently, setting a solid foundation for analysis. Once the data is ready, Power BI Desktop enables the creation of detailed, multi-page reports that incorporate a wide range of visualizations such as bar charts, line graphs, maps, and tables, similar to techniques used in Business Analytics With R Programming Languages. These interactive visuals help users explore data trends and patterns effectively. After building reports, Power BI Desktop provides multiple options for sharing and collaboration. Users can publish their reports directly to the Power BI Service, a cloud platform that makes reports accessible to team members and stakeholders across the organization. This ensures everyone stays up-to-date with the latest information and insights. Additionally, reports can be exported into formats like PDF or PowerPoint, making it easy to share findings in meetings or with external audiences. A key feature of Power BI is the ability to create dashboards by pinning visuals from reports onto a single-page interface within the Power BI Service.

Dashboards offer a consolidated view of critical metrics, enabling quicker decision-making. The collaborative features of Power BI Desktop and the Power BI Service promote a data-driven culture, allowing organizations to make informed decisions based on real-time, shared insights. Overall, Power BI Desktop combines powerful reporting and collaboration tools that support effective data analysis and business intelligence.
How Power BI Desktop Works
- Data Connection: Power BI Desktop connects to a wide range of data sources such as databases, Excel files, cloud services, and web APIs. Users select their data sources to import data for analysis.
- Data Transformation: Using Power Query Editor, users clean and transform raw data by filtering rows, merging tables, removing errors, and shaping data to fit analytical needs all without needing complex coding.
- Data Modeling: After transformation, users create relationships between different data tables and define calculated columns or measures using DAX to build a robust data model, which is crucial for understanding What Is the Importance Of Financial Analysis.
- Report Creation: Users design reports by dragging and dropping various visual elements charts, maps, tables onto report pages. They can customize visuals with colors, filters, and slicers to make insights clear.
- Interactive Visuals: Power BI Desktop enables adding interactivity to reports, allowing users to filter and drill down into data directly within visuals for deeper exploration.
- Data Refresh: Users set up scheduled or manual refreshes to keep data current, ensuring that reports and dashboards reflect the latest information when published.
- Publishing: Once reports are ready, users publish them to the Power BI Service (cloud), where they can be shared, collaborated on, and embedded in apps or websites for wider access.
- Free to Use: Power BI Desktop is available as a free download, allowing individuals and small businesses to create powerful data reports without upfront costs.
- Easy Data Integration: It supports connecting to hundreds of data sources, including files, databases, cloud services, and web APIs, enabling comprehensive data analysis from multiple platforms, a capability emphasized in Business Analyst Training.
- Powerful Data Transformation: With its built-in Power Query Editor, users can clean, shape, and transform data easily, even without coding skills, preparing data efficiently for accurate reporting.
- Advanced Data Modeling: Users can create complex relationships between data tables and use DAX (Data Analysis Expressions) to build custom calculations, enhancing the depth of analysis.
- Rich Visualization Options: Power BI Desktop offers a wide variety of customizable visuals charts, maps, gauges, and more that help present data in a meaningful and interactive way.
- Offline Report Creation: Unlike the cloud-based Power BI Service, Power BI Desktop allows users to work and build reports offline, which is ideal for secure or low-connectivity environments.
- Seamless Publishing and Sharing: Once reports are created, users can easily publish them to the Power BI Service for collaboration, sharing, and access across multiple devices.
- Purpose: Power BI Desktop is a Windows application designed for data preparation, modeling, and report creation. Power BI Service is a cloud-based platform focused on sharing, collaboration, and dashboard management.
- Installation: Power BI Desktop requires installation on a local machine, whereas Power BI Service is accessed through a web browser with no installation needed.
- Data Connectivity & Transformation: Desktop offers extensive tools for connecting, transforming, and modeling data using Power Query and DAX, which are essential for analyzing What Are Market Structures.
- Report Creation: Power BI Desktop is the primary tool to create and design detailed reports and complex data models. The Service supports creating dashboards by pinning visuals but offers limited report-building features.
- Collaboration: Power BI Service enables collaboration through sharing reports and dashboards with teams, commenting, and setting permissions. Desktop is mainly for individual use before publishing.
- Data Refresh: The Service supports automatic scheduled data refreshes from various sources, keeping reports up to date. Desktop requires manual refresh and republishing for updated data.
- Accessibility: Power BI Service is accessible anywhere with the internet on any device (desktop, mobile, tablet). Power BI Desktop works only on Windows computers and offline, making it less flexible.
Would You Like to Know More About Business Analyst? Sign Up For Our Business Analyst Training Now!
Advantages of Power BI Desktop

Limitations of Power BI Desktop
Power BI Desktop is a powerful tool for data analysis and visualization, but it does have some limitations that users should be aware of. One of the primary constraints is related to data size and performance. While Power BI Desktop can handle large datasets, working with extremely large or complex data models may result in slower report loading times and reduced interactivity. This can impact user experience, especially when dealing with millions of rows or complex calculations. Another limitation is that Power BI Desktop is primarily designed for individual report creation and data modeling. Collaboration features are limited within the desktop application itself, as sharing and collaboration are mainly handled through the Power BI Service, which requires an internet connection and often additional licensing, highlighting differences between Data Mining Vs Statistics. Power BI Desktop also has some restrictions in terms of data refresh capabilities. Unlike the Power BI Service, which supports scheduled data refreshes, Power BI Desktop requires manual refresh of the data, making it less suitable for scenarios that demand fully automated and frequent updates without user intervention. Additionally, while Power BI Desktop offers a wide range of data connectors, some niche or proprietary data sources may not be supported directly. Users may need to employ workarounds or third-party connectors to access these sources. Finally, certain advanced features, such as AI-driven analytics or paginated reports, are only available through other components of the Power BI ecosystem, like Power BI Service or Power BI Premium. Despite these limitations, Power BI Desktop remains a versatile and essential tool for individual data analysts and small teams.
Looking to Master Business Intelligence? Discover the Business Intelligence Master Program Training Course Available at ACTE Now!
Power BI Desktop vs. Power BI Service
How to Download and Install Power BI Desktop
Downloading and installing Power BI Desktop is a straightforward process that allows users to quickly start creating data visualizations and reports. To begin, visit the official Microsoft Power BI website or directly access the Microsoft Store if you are using a Windows 10 or later operating system. The Microsoft Store version offers the advantage of automatic updates, ensuring you always have the latest features and security improvements. If you prefer, you can also download the Power BI Desktop installer as an executable file (.exe) from the Power BI website. This option is ideal for environments where users do not have access to the Microsoft Store or for organizations that prefer manual installation and update control, helping to address issues related to Where Are The 8 Hidden Wastes. Once you have downloaded the installer, run the setup file and follow the on-screen instructions. The installation wizard will guide you through accepting the license terms, choosing the installation location, and completing the setup. The process usually takes only a few minutes depending on your system performance. After installation, launch Power BI Desktop from the Start menu or desktop shortcut. You may need to sign in with your Microsoft or organizational account to access additional features like publishing reports to the Power BI service. It’s important to ensure your system meets the minimum requirements, such as having a compatible Windows version and sufficient memory and storage space. By following these steps, you can easily download and install Power BI Desktop, giving you access to a powerful tool for data analysis, reporting, and visualization to support your business intelligence needs.
Want to Learn About Business Analyst? Explore Our Business Analyst Interview Questions and Answers Featuring the Most Frequently Asked Questions in Job Interviews.
Conclusion
Power BI Desktop is a robust and powerful tool designed to help users transform raw data into insightful reports and interactive dashboards. Its intuitive interface makes it accessible for both beginners and experienced business intelligence professionals, allowing users to quickly connect to a wide variety of data sources such as databases, Excel files, cloud services, and more. This flexibility enables organizations to bring together data from disparate systems into a unified view for better analysis. One of the key strengths of Power BI Desktop is its powerful data transformation capabilities. Using Power Query, users can clean, reshape, and model their data without needing advanced programming skills. This process ensures that the data is accurate, consistent, and ready for analysis, which is critical for generating reliable insights, a fundamental focus of Business Analyst Training. Power BI Desktop offers a vast selection of visualization options, including charts, graphs, maps, and custom visuals, allowing users to create compelling and interactive reports. These reports can be tailored to specific audiences, whether it’s for team members, executives, or external stakeholders. Additionally, users can incorporate calculated measures and complex calculations using DAX (Data Analysis Expressions) to deepen their analysis. By mastering Power BI Desktop, users can unlock the full potential of their data. They gain the ability to generate actionable insights that drive better business decisions. Whether you are preparing reports for a small team or designing dashboards for a large organization, Power BI Desktop equips you with the tools to analyze data effectively and efficiently, making it an essential solution in today’s data-driven world.


