
Last updated on 05th Jan 2022| 2693
- Have you been in a situation where you expected your machine learning model to perform really well, but it shows poor accuracy? You’ve done all the hard work – so where did the classification model go wrong? How can you fix it?
- There are lots of ways to measure the performance of your classification model but none have stood the test of time like the confusion matrix. It helps us evaluate how our model performed, where it went wrong and guides us to correct our path.
- In this article, we’ll explore how a confusion matrix gives a holistic view of your model’s performance. And contrary to its name, you will realise that a confusion matrix is a very simple yet powerful concept. So let’s solve the mystery of the Confusion Matrix!
Introduction to confusion Matrix
Confusion Matrix – Not so confusing!
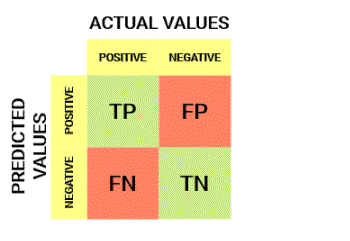
- True Positive (TP)
- Understanding True Positive, True Negative, False Positive and False Negative in a Confusion Matrix
- True Positive (TP)
- Estimated price matches the actual price
- the actual value was positive and the model predicted a positive value
- True Negative (TN)
- Estimated price matches the actual price
- The actual value was negative and the model predicted a negative value
- False Positive (FP) – Type 1 Error
- Estimated value was estimated incorrectly
- Actual value was negative but the model predicted a positive value
- also known as type 1 error
- False Negative (FN) – Type 2 Error
- Estimated value was estimated incorrectly
- Actual value was positive but model predicted negative value
- Also known as type 2 error
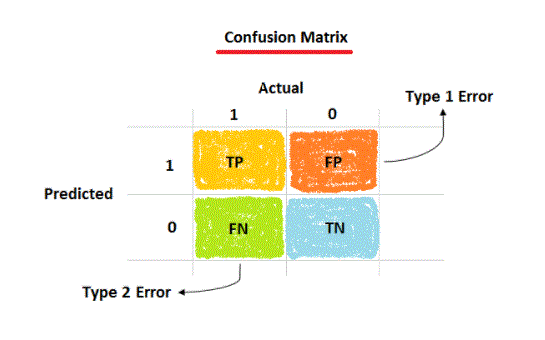
- True Positive (TP) = 560; Mean 560 positive class data points were correctly classified by the model
- True Negative (TN) = 330; Meaning 330 negative class data points were classified correctly by the model
- false positive (FP) = 60; Mean 60 negative class data points were incorrectly classified as belonging to positive class by the model
- false negative (fn) = 50; Meaning 50 positive class data points were incorrectly classified as belonging to negative class by the model
- Given the relatively large number of true positive and true negative values, it proved to be a very good classifier for our dataset.
Understanding True Positive, True Negative, False Positive and False Negative in a Confusion Matrix
Let me give you an example to understand it better. Suppose we had a classification dataset containing 1000 data points. We fit a classifier on it and get the confusion matrix as below:
The different values of the confusion matrix will be as follows:
- Below is the process of computing a confusion matrix.
- You need a test dataset or validation dataset with expected result values.
- Make a prediction for each row in your test dataset.
- From the calculation of expected results and predictions:
- Number of correct predictions for each class.
- The number of incorrect predictions for each class organised by the predicted class.
- These numbers are then arranged in a table or matrix as follows:
- Downward expected: Each row of the matrix corresponds to a predicted square.
- Prediction at the top: Each column of the matrix corresponds to a real class.
- Then the count of correct and incorrect classifications is entered in the table.
How to Calculate a Confusion Matrix:
- expected, expected
- man Woman
- man, man
- female, female
- man, man
- female male
- female, female
- female, female
- man, man
- man Woman
- female, female
- Let’s start with and calculate the classification accuracy for this set of predictors.
- The algorithm corrected 7 out of 10 predictions with an accuracy of 70%.
- Accuracy = Total correct predictions / Total predictions made * 100
- Accuracy = 7/10 * 100
- But what kind of errors were made?
- Let’s turn our results into a confusion matrix.
- First, we must count the number of correct predictions for each class.
- Men classified as men: 3
- Women classified as women: 4
- Now, we can count the number of incorrect predictions for each class organised by the predicted value.
- Men classified as women: 2
- Women classified as men: 1
- Now we can arrange these values into a 2-square confusion matrix:
- Men and women
- male 3 1
- female 2 4
- We can learn a lot from this table.
- The total actual males in the dataset is the sum of the values of the males column (3+2)
- The total number of actual females in the dataset is the sum of the values in the Female column (1 + 4).
- The true values are arranged in a diagonal line from top-left to bottom-right of the matrix (3 + 4).
- More errors were made by predicting men as women than by predicting women as men.
2-Class Confusion Matrix Case Study:
Let’s imagine that we have a two-class classification problem of predicting whether a picture is male or female. We have a test dataset of 10 records with expected results and a set of predictions from our classification algorithm.
- This gives us:
- “True positive” for correctly predicted event values.
- “False positives” for incorrectly estimated event values.
- “True negative” for correctly estimated no-event values.
- “False negative” for an incorrectly estimated no-event value.
- We can summarise this in a confusion matrix:
- event no-event
- event true positive false positive
- no event false negative true negative
Two-Class Problems Are Special:
In a two-class problem, we often want to discriminate between observations with specific results from general observations. Like no disease state or event from no disease state or no event. In this way, we can assign the event row as “positive” and the no-event row as “negative”. Then we can assign the event column of the predictor as “true” and the no-event as “false”.
This can help us calculate more advanced classification metrics such as accuracy, recall, specificity, and sensitivity of our classifiers. For example, classification accuracy is calculated as true positive + true negative. Consider the case where there are two classes. […] The top row of the table corresponds to the samples whose occurrences have been predicted. Some are predicted correctly (true positives, or TP) while others are classified incorrectly (false positives, or FP). Similarly, in the second row there are predicted negatives with true negative (TN) and false negative (FN). Now that we’ve worked through a simple 2-class confusion matrix case study, let’s look at how we can calculate confusion matrix in modern machine learning tools.
- When you use them in practice with real data and tools, these examples will give you a reference of what you have learned about confusion matrices.
- Example confusion matrix in Weka
- Weka Machine Learning Workbench will automatically display a confusion matrix when assessing the skill of the model in the Explorer interface.
- Below is a screenshot from the Weka Explorer interface after training the K-nearest neighbour algorithm on the Pima Indians diabetes dataset.
- The confusion matrix is listed below, and you can see that a wealth of classification statistics is also presented.
- The confusion matrix assigns the class values to the letters a and b and provides the expected class values in the rows and the predicted class values (“classified”) for each column.
Code Examples of the Confusion Matrix:
This section provides some examples of confusion using top machine learning platforms.
- # Example of a confusion matrix in Python
- import confusion_matrix from sklearn.metrics
- expected = [1, 1, 0, 1, 0, 0, 1, 0, 0, 0]
- Approximate = [1, 0, 0, 1, 0, 0, 1, 1, 1, 0]
- result = confusion_matrix(expected, predicted)
- print (result)
- Running this example prints a confusion matrix array that summarises the results of the 2nd class problem.
- [[4 2]
- [1 3]]
- Learn more about the confusion_matrix() function in the scikit-learn API documentation.
- Example confusion matrix in R with caret
- The caret library for machine learning in R can calculate a confusion matrix.
- Given a list of expected values and a list of predictions from your machine learning model, the confusionMatrix() function will calculate a confusion matrix and return the result as a detailed report. You can then print this report and interpret the results.
- # R. Example of a confusion matrix in
- library (carat)
- expected <- factor(c(1, 1, 0, 1, 0, 0, 1, 0, 0, 0))
- Approximate <- factor(c(1, 0, 0, 1, 0, 0, 1, 1, 1, 0))
- result <- confusion matrix (data = estimated, context = expected)
- print (result)
- Running this example reports a confusion matrix and calculates the associated statistics and prints the results.
- Confusion Matrix and Statistics
- Reference
- prediction 0 1
- 0 4 1
- 1 2 3
- Accuracy: 0.7
- 95% CI : (0.3475, 0.9333)
- No Information Rate: 0.6
- p-value [ACC > NIR]: 0.3823
- Kappa : 0.4
- McNemar’s test p-value: 1.0000
- Sensitivity: 0.6667
- Specification: 0.7500
- Position Ex Value: 0.8000
- Negative prior value: 0.6000
- Spread: 0.6000
- Detection rate: 0.4000
- Probe spread: 0.5000
- Balanced Accuracy: 0.7083
- ‘Positive’ class: 0
Example Confusion Matrix in Python with scikit-learn:
The scikit-learn library for machine learning in Python can compute a confusion matrix. Given an array or list of expected values and a list of predictions from your machine learning model, the confusion_matrix() function will calculate a confusion matrix and return the result as an array. You can then print this array and interpret the results.

Develop Your Skills with Advanced Tibco ActiveMatrix SOA Certification Training
Weekday / Weekend BatchesSee Batch DetailsThere is a lot of information in this report, at least there is no confusion.
Need for Confusion Matrix in Machine learning:
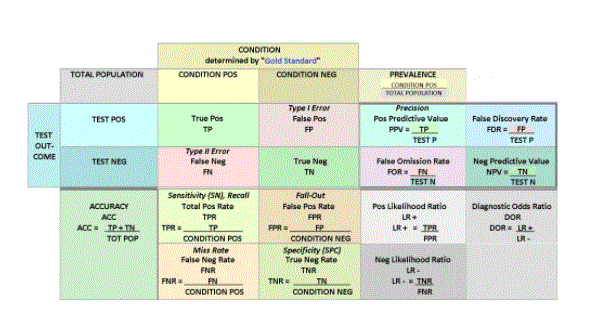
It evaluates the performance of classification models when they make predictions on test data, and tells us how well our classification model performs. It tells not only the error committed by the classifier but also the types of errors such that it is either Type-I or Type-II error. With the help of a confusion matrix, we can calculate various parameters for the model, such as accuracy, accuracy, etc. Example: We can understand the confusion matrix by using an example. Suppose we are trying to build a model that can predict the outcome of a disease whether a person has that disease or not. So, the confusion matrix for this is given as:
The table is given for a two-class classifier, with two predictions “yes” and “no”. Here, yes defines that the patient has the disease, and no defines that the patient does not have that disease. The classifier made a total of 100 predictions. Out of 100 predictions, 89 are correct predictions, and 11 are incorrect predictions. The model predicted “yes” 32 times and “no” 68 times. Whereas the actual “yes” was 27, and the actual “no” was 73 times.
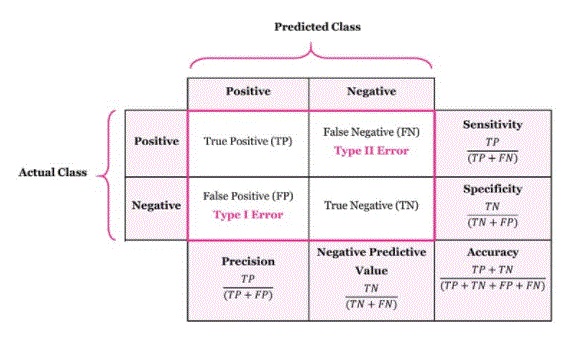
Classification accuracy: It is one of the important parameters to determine the accuracy of classification problems. It defines how many times the model predicts the correct output. It can be calculated as the ratio of the number of correct predictions made by the classifier to the number of all predictions made by the classifier.
Misclassification rate: This is also called the error rate, and defines how often the model makes incorrect predictions. The value of the error rate can be calculated as the number of incorrect predictions of all the predictions made by the classifier.
Precision: It can be defined as the number of correct outputs provided by the model or out of all the positive classes that have been correctly predicted by the model, how many of them were actually true. It can be calculated using the following formula:
Recall: this is defined out of the total number of positive classes as how correctly our model predicted. The recall should be as high as possible.
F-measure: If two models have low precision and high recall, or vice versa, it is difficult to compare these models. So, for this purpose, we can use an F-score. This score helps us to evaluate recall and accuracy at the same time. If recall is equal to accuracy then the F-score is maximum.
- For 2 prediction classes of the classifier, the matrix is of 2 * 2 tables, for 3 classes, it is of 3 * 3 tables, and so on.
- The matrix is divided into two dimensions, which are the predicted value and the actual value as well as the total number of predictions.
- Predicted values are the values that are predicted by the model, and the actual values are the true values for the given observations.
Conclusion:
In this post, you explored the Confusion Matrix for Machine Learning.
Specifically, you learned about: The limits of classification accuracy and when it can hide important details. The confusion matrix and how to calculate it from scratch and interpret the results.
How to calculate a confusion matrix with Weka, Python scikit-learn and R caret libraries
The confusion matrix is a matrix used to determine the performance of a classification model for a given set of test data. This can be determined only if the true values of the test data are known. The matrix is easily understood, but the associated terminology can be confusing. Since it shows the errors in the performance of the model in the form of a matrix, it is also known as the error matrix. Some of the features of Confusion Matrix are given below: