Last updated on 08th Jul 2020| 1839
What Is Clustering?
- Clustering is the most popular technique in unsupervised learning where data is grouped based on the similarity of the data-points.
- Clustering has many real-life applications where it can be used in a variety of situations.
- The basic principle behind cluster is the assignment of a given set of observations into subgroups or clusters such that observations present in the same cluster possess a degree of similarity.
- It is the implementation of the human cognitive ability to discern objects based on their nature.
- For example, when you go out for grocery shopping, you easily distinguish between apples and oranges in a given set containing both of them.
- You distinguish these two objects based on their color, texture and other sensory information that is processed by your brain.
- Clustering is an emulation of this process so that machines are able to distinguish between different objects.
- It is a method of unsupervised learning since there is no external label attached to the object.
- The machine has to learn the features and patterns all by itself without any given input-output mapping.
- The algorithm is able to extract inferences from the nature of data objects and then create distinct classes to group them appropriately.
- In clustering machine learning, the algorithm divides the population into different groups such that each data point is similar to the data-points in the same group and dissimilar to the data points in the other groups.
- On the basis of similarity and dissimilarity, it then assigns appropriate sub-group to the object.
Why Clustering ?
- Clustering is very much important as it determines the intrinsic grouping among the unlabeled data present.
- There are no criteria for a good clustering. It depends on the user, what is the criteria they may use which satisfy their need.
- For instance, we could be interested in finding representatives for homogeneous groups (data reduction), in finding “natural clusters” and describe their unknown properties (“natural” data types), in finding useful and suitable groupings (“useful” data classes) or in finding unusual data objects (outlier detection).
- This algorithm must make some assumptions which constitute the similarity of points and each assumption make different and equally valid clusters.
Clustering Methods :
Density-Based Methods :
These methods consider the clusters as the dense region having some similarity and different from the lower dense region of the space. These methods have good accuracy and ability to merge two clusters.Example DBSCAN (Density-Based Spatial Clustering of Applications with Noise), OPTICS (Ordering Points to Identify Clustering Structure) etc.
Hierarchical Based Methods :
The clusters formed in this method forms a tree-type structure based on the hierarchy. New clusters are formed using the previously formed one. It is divided into two category
- Agglomerative (bottom up approach)
- Divisive (top down approach)
examples CURE (Clustering Using Representatives), BIRCH (Balanced Iterative Reducing Clustering and using Hierarchies) etc.
Partitioning Methods :
These methods partition the objects into k clusters and each partition forms one cluster. This method is used to optimize an objective criterion similarity function such as when the distance is a major parameter example K-means, CLARANS (Clustering Large Applications based upon Randomized Search) etc.
Grid-based Methods :
In this method the data space is formulated into a finite number of cells that form a grid-like structure. All the clustering operation done on these grids are fast and independent of the number of data objects example STING (Statistical Information Grid), wave cluster, CLIQUE (CLustering In Quest) etc.
Clustering :
“Clustering” is the process of grouping similar entities together. The goal of this unsupervised machine learning technique is to find similarities in the data point and group similar data points together.
Use Clustering :
Grouping similar entities together help profile the attributes of different groups. In other words, this will give us insight into underlying patterns of different groups. There are many applications of grouping unlabeled data, for example, you can identify different groups/segments of customers and market each group in a different way to maximize the revenue. Another example is grouping documents together which belong to the similar topics etc.
Clustering Algorithms Work
There are many algorithms developed to implement this technique but for this post, let’s stick the most popular and widely used algorithms in machine learning.
- K-mean Clustering
- Hierarchical Clustering
K-mean Clustering :
- It starts with K as the input which is how many clusters you want to find. Place K centroids in random locations in your space.
- Now, using the euclidean distance between data points and centroids, assign each data point to the cluster which is close to it.
- Recalculate the cluster centers as a mean of data points assigned to it.
- Repeat 2 and 3 until no further changes occur.
Now, you might be thinking that how do I decide the value of K in the first step.
- One of the methods is called “Elbow” method can be used to decide an optimal number of clusters. Here you would run K-mean clustering on a range of K values and plot the “percentage of variance explained” on the Y-axis and “K” on X-axis.
- In the picture below you would notice that as we add more clusters after 3 it doesn’t give much better modeling on the data. The first cluster adds much information, but at some point, the marginal gain will start dropping.
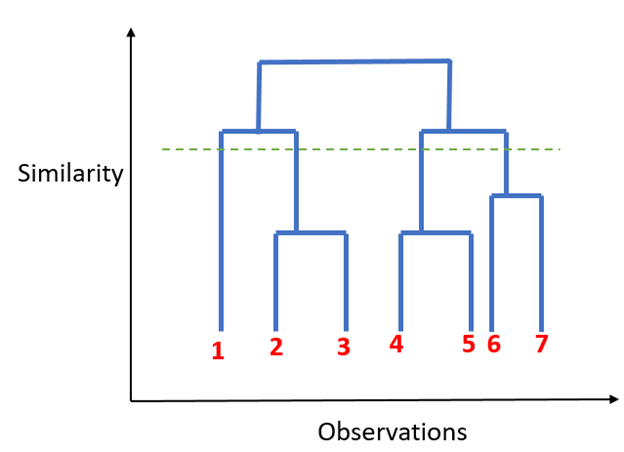
Hierarchical Clustering : Unlike K-mean clustering Hierarchical clustering starts by assigning all data points as their own cluster. As the name suggests it builds the hierarchy and in the next step, it combines the two nearest data point and merges it together to one cluster.
- Assign each data point to its own cluster.
- Find closest pair of cluster using euclidean distance and merge them in to single cluster.
- Calculate distance between two nearest clusters and combine until all items are clustered in to a single cluster.
In this technique, you can decide the optimal number of clusters by noticing which vertical lines can be cut by horizontal line without intersecting a cluster and covers the maximum distance.
Unsupervised Learning :
Unsupervised learning is a type of machine learning algorithm used to draw inferences from datasets consisting of input data without labeled responses. The most common unsupervised learning method is cluster analysis, which is used for exploratory data analysis to find hidden patterns or grouping in data. The clusters are modeled using a measure of similarity which is defined upon metrics such as Euclidean or probabilistic distance.
Common clustering algorithms include:
- Hierarchical Clustering: builds a multilevel hierarchy of clusters by creating a cluster tree
- k-Means Clustering: partitions data into k distinct clusters based on distance to the centroid of a cluster
- Gaussian Mixture Models: models clusters as a mixture of multivariate normal density components
- Self-organizing Maps: uses neural networks that learn the topology and distribution of the data
- Hidden Markov Models: uses observed data to recover the sequence of states
Why Unsupervised Learning?
Here, are prime reasons for using Unsupervised Learning:
- Unsupervised machine learning finds all kind of unknown patterns in data.
- Unsupervised methods help you to find features which can be useful for categorization.
- It is taken place in real time, so all the input data to be analyzed and labeled in the presence of learners.
- It is easier to get unlabeled data from a computer than labeled data, which needs manual intervention.
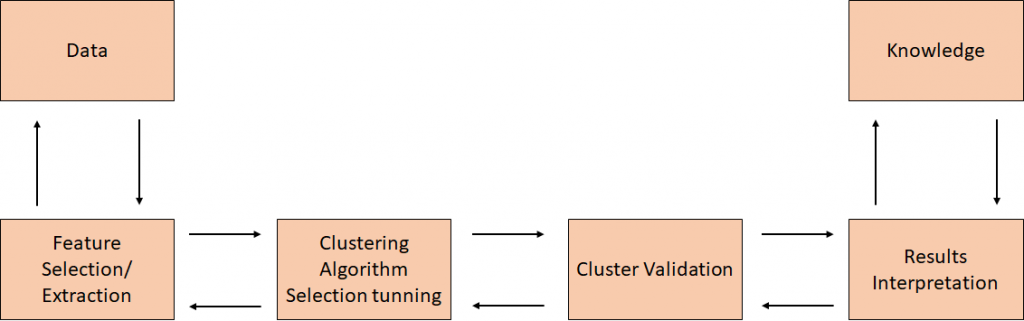
Unsupervised Learning Analysis Process :
The overall process that we will follow when developing an unsupervised learning model can be summarized in the following chart:
Unsupervised Learning Main Applications Are:
- Segmenting datasets by some shared atributes.
- Detecting anomalies that do not fit to any group.
- Simplify datasets by aggregating variables with similar atributes.
PREPARING DATA FOR UNSUPERVISED LEARNING
- For our example, we’ll use the Iris dataset to make predictions. The dataset contains a set of 150 records under four attributes — petal length, petal width, sepal length, sepal width, and three iris classes: setosa, virginica and versicolor. We’ll feed the four features of our flower to the unsupervised algorithm and it will predict which class the iris belongs to.
- We use the scikit-learn library in Python to load the Iris dataset and matplotlib for data visualization. Below is the code snippet for exploring the dataset.
# Importing Modules
- from sklearn import datasets
- import matplotlib.pyplot as plt
# Loading dataset
- iris_df = datasets.load_iris()
# Available methods on dataset
- print(dir(iris_df))
# Features
- print(iris_df.feature_names)
# Targets
- print(iris_df.target)
# Target Names
- print(iris_df.target_names)
- label = {0: ‘red’, 1: ‘blue’, 2: ‘green’}
# Dataset Slicing
- x_axis = iris_df.data[:, 0] # Sepal Length
- y_axis = iris_df.data[:, 2] # Sepal Width
# Plotting
- plt.scatter(x_axis, y_axis, c=iris_df.target)
- plt.show()
- [‘DESCR’, ‘data’, ‘feature_names’, ‘target’, ‘target_names’]
- [‘sepal length (cm)’, ‘sepal width (cm)’, ‘petal length (cm)’, ‘petal width (cm)’]
[0 0 0 0 0 0 0 0 0 0 0 0 0 0 0 0 0 0 0 0 0 0 0 0 0 0 0 0 0 0 0 0 0 0 0 0 0 0 0 0 0 0 0 0 0 0 0 0 0 0 1 1 1 1 1 1 1 1 1 1 1 1 1 1 1 1 1 1 1 1 1 1 1 1 1 1 1 1 1 1 1 1 1 1 1 1 1 1 1 1 1 1 1 1 1 1 1 1 1 1 2 2 2 2 2 2 2 2 2 2 2 2 2 2 2 2 2 2 2 2 2 2 2 2 2 2 2 2 2 2 2 2 2 2 2 2 2 2 2 2 2 2 2 2 2 2 2 2 2 2]
Types Of Clustering :
Broadly speaking, clustering can be divided into two subgroups :
- Hard Clustering: In hard clustering, each data point either belongs to a cluster completely or not. For example, in the above example each customer is put into one group out of the 10 groups.
- Soft Clustering: In soft clustering, instead of putting each data point into a separate cluster, a probability or likelihood of that data point to be in those clusters is assigned. For example, from the above scenario each costumer is assigned a probability to be in either of 10 clusters of the retail store.

Enhance Your Career with Machine Learning Training By Experts Trainers
- Instructor-led Sessions
- Real-life Case Studies
- Assignments
K Means Clustering
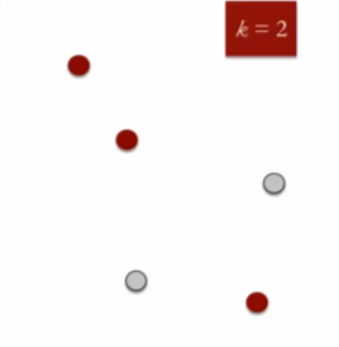
K means is an iterative clustering algorithm that aims to find local maxima in each iteration. This algorithm works in these 5 steps :
- Specify the desired number of clusters K : Let us choose k=2 for these 5 data points in 2-D space.

2. Randomly assign each data point to a cluster : Let’s assign three points in cluster 1 shown using red color and two points in cluster 2 shown using grey color.
3. Compute cluster centroids : The centroid of data points in the red cluster is shown using red cross and those in grey cluster using grey cross.
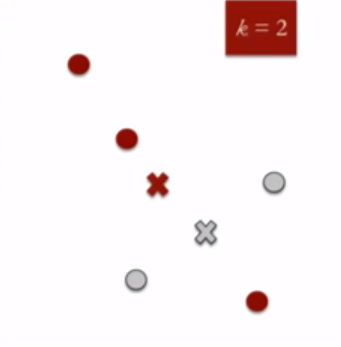
4. Re-assign each point to the closest cluster centroid : Note that only the data point at the bottom is assigned to the red cluster even though its closer to the centroid of grey cluster. Thus, we assign that data point into grey cluster.
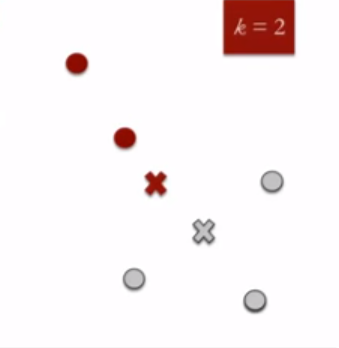
5. Re-compute Cluster Centroids : Now, re-computing the centroids for both the clusters.
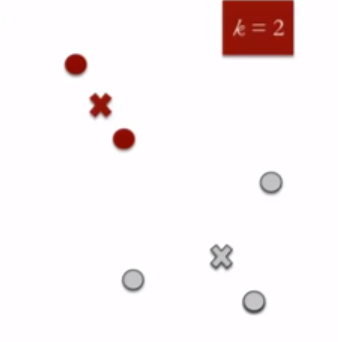
Repeat steps 4 and 5 until no improvements are possible : Similarly, we’ll repeat the 4th and 5th steps until we’ll reach global optima. When there will be no further switching of data points between two clusters for two successive repeats. It will mark the termination of the algorithm if not explicitly mentioned. Here is a live coding window where you can try out K Means Algorithm using scikit-learn library.
Applications Of Clustering :
Clustering has a large no. of applications spread across various domains. Some of the most popular applications of clustering are:
- Recommendation engines
- Market segmentation
- Social network analysis
- Search result grouping
- Medical imaging
- Image segmentation
- Anomaly detection
Unsupervised Learning: Clustering
Libraries :
- import numpy as np
- import pandas as pd
- import os
- import seaborn as sns
- import matplotlib.pyplot as plt
- from tqdm import tqdm_notebook
- from sklearn import datasets
- from sklearn.cluster import KMeans, MeanShift, DBSCAN, Birch
- from sklearn import metrics
Data :
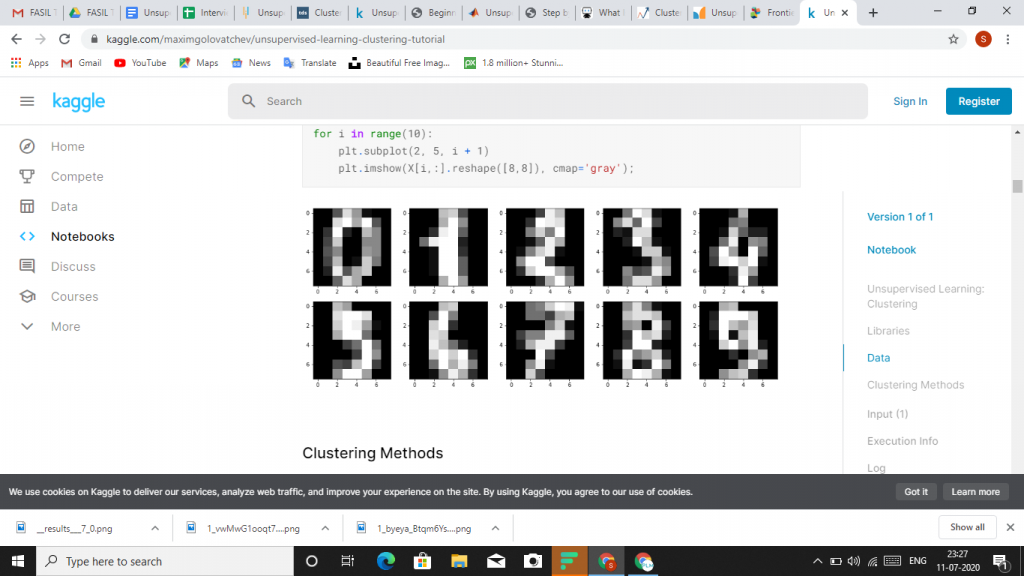
In order to make it easy to compare results of this tutorial with Yorko’s I will use the same dataset, MNIST dataset.
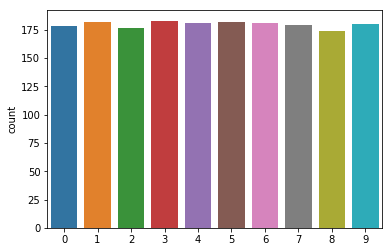
As you can see we need to take care of ideally balanced multiclass data set. Now let’s visualize our data.
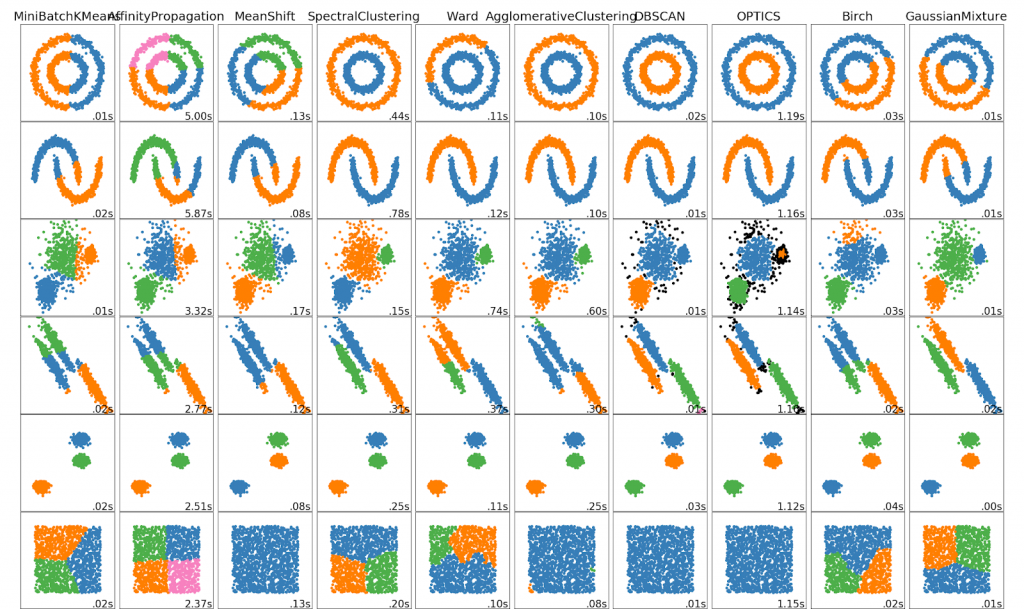
Clustering Methods :
K-Means
The most well known clustering algorithm is definitely K-means. It was discussed in Yorko’s tutorial, so I will not pay too much attention to this method, I will remind it’s basic steps, and later K-means will be used as a baseline model. It is easy to undersatnd and easy to implement K-means. K-means tries to choose centroids (‘means’) in order to minimize within-cluster inertia.
Basic iterations of K-means look like this:
- We randomly initialize K cluster centers. Centers of clusters are simply some of the observation from given dataset;
- For each observation from dataset is computed the distance between one and all clusters’ centers. Observations relate to a cluster, which centers is the closest to them;
- Centers of clusters are recomputed based on values of all data points within a given cluster;
Steps 2-3 are repeated until convergence is not reached.
Advantages:
- Simplicity – It’s easy to understand and interpret;
- Speed – Algorithm will converge very fast, comparing to other methods;
Drawbacks:
- There is need to specify number of clusters;
- Algorithm starts from random points, which may lead to different results.
Mean-Shift :
Mean-shift is a clustering algorithm, which aims to locate centers of clusters in the most dense area of data points. Mean-shift starts from a ramdom point, where it locates a circular sliding window of radius r (which is a parameter we are able to specify). Mean-shift is shifting step-by-step center point to a region with higher density. The algorithm will shift the sliding window untill he can not find a direction with higher density of data points. When multiple sliding windows overlap each other, then the window, which contains the biggest number of data points, is choosed as a final cluster.
Advantages:
- There is no need to specify number of clusters;
- Algorithm is guaranteed to converge;
Drawbacks:
- Algorithm is most highly scalable;
- In sklearn there is no need to specify r, still selection of this parameter is not trivial.

Learn Hands-On Experience with Machine Learning Certification Course
Weekday / Weekend BatchesSee Batch DetailsDBSCAN :
- DBSCAN is a clustering algorithm, which core idea is finding high density area. So it is quite similar to Mean-shift, still there is a difference between them. DBSCAN works this way:
- DBSCAN starts with an arbitrary data point, which is not labeled as visited. Using parameter epsilon, which has to be set by user, an algorithm extracts the neighborhood of this data point. Neighborhood are all points within distance epsilon.
- There is one more parameter, which has to be set – min_samples. If there are min_samples within neighborhood, than starts clustering process, and this data point becomes the first data point in cluster. If there are less data pioint in neighborhood than min_samples, than this data point is labeled as outlier, but it is also labeled as visited.
- For the first data point belonging to a cluster all data points in it’s neighborhood also become part of this cluster.
- The process from 2-3 is repetated for all data points in cluster, untill there are no unvisited data points.
- When the algorithm managed to visit all data points in the first cluster, it starts with another arbitrary data point, which has not been visited. Then process from 2-4 is repeated for all new clusters. In the end there are no unvisited data points, all of them belong to some clusters or labeled as outliers.
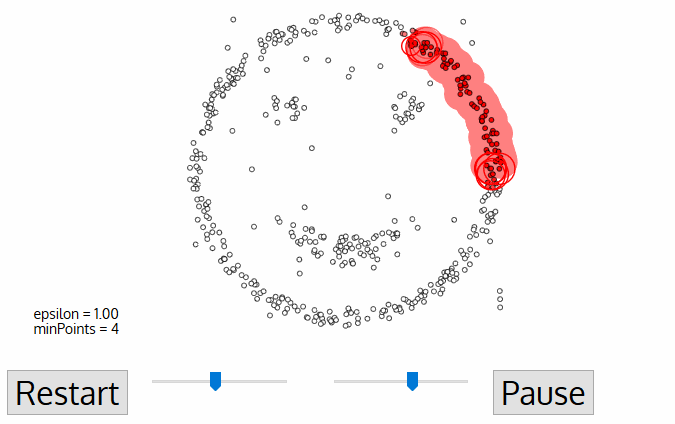
Advantages:
- There is no need to specify number of clusters;
- Algorithm is able to identify outliers;
- Algorithm is capabale of finding cluster of arbitrary shape and size;
Drawbacks:
- It is not easy to estimate epsilon and min_samples;
- Algorithm does not perform well on data with varying density.
Birch :
- Birch is a clustering algorithm, which can handle a large amount of data. Birch builds so called Characteristic Feature Tree (CFT) to form a set of Characteristic Feature Nodes (CFN). Inside CFN there are some Characteristic Feature Subclusters (CFS), which hold sufficient information about data. As you can see there is no need to store all the data in memory, because every valuable information can be found in CFS, thus Birch algorithm can be thought as a data reduction method CFS contains information:
- Number of samples in a subcluster;
- Linear Sum : A n-dimensional vector holding the sum of all samples;
- Squared Sum : Sum of the squared L2 norm of all samples;
- Centroids : To avoid recalculation linear sum / n_samples;
- Squared norm of the centroids.
Advantages:
- Birch can handle large datasets;
Drawbacks:
- There is need to specify number of clusters;
- Apart from number of clusters we have to specify two more parameters;
- Birch doesn’t perform well on high dimensional data (if there are >20 features, you’d better use something else).
Conclusion
Clustering and unsupervised learning in general can be a very useful tool if you want to understand the types of data you have. However, the insight you gain from it depends on you and your understanding on the data. It’s ultimately up to you to decide what your clusters mean and how to use them.