Best Microsoft Advanced Excel Training in Velachery Master Excel | Updated 2025

Microsoft Advanced Excel Course for All Graduates, NON-IT, Diploma & Career Gaps — ₹30,680/- only.

Download Brouchure
Join Our 100% Job Guaranteed

Microsoft Advanced Excel Course in Velachery

  • Join the Best Microsoft Advanced Excel Training Institute in Velachery to master the art of Data Analysis.
  • Our Microsoft Advanced Excel Course in Velachery Covers Formulas, VBA & projects.
  • Get hands-on experience with expert-led sessions to boost your Excel skills.
  • Choose weekday, weekend, or fast-track batches for flexible learning now.
  • Earn a Microsoft Advanced Excel Certification in Velachery with 100% placement assistance.
  • We also provide portfolio building, Interview & career guidance to excel professionally.

WANT IT JOB

Become a Excel Expert in 3 Months

Freshers Salary

3 LPA

To

8 LPA

Quality Training With Affordable Fees in Velachery!
INR ₹33000
INR ₹30680

10975+

(Placed)
Freshers To IT

5799+

(Placed)
NON-IT To IT

8947+

(Placed)
Career Gap

4997+

(Placed)
Less Then 60%

Our Hiring Partners

Overview of Microsoft Advanced Excel Course

The Microsoft Advanced Excel Course in Velachery is perfect for freshers who want to build strong Excel skills from the ground up. This Advanced Excel Training covers essential topics such as formulas, pivot tables, macros, and data analysis. You’ll gain hands-on experience through real-time projects, boosting your confidence and practical knowledge. Upon completion, you’ll earn a Microsoft Advanced Excel Certification in Velachery, a valuable credential that enhances your professional profile. Our placement assistance ensures you’re fully prepared to kick-start your career. Join now to master advanced Excel techniques and unlock exciting job opportunities in Velachery.

What You'll Learn From Microsoft Advanced Excel Training

In this Microsoft Advanced Excel Course in Velachery, you’ll develop in-depth expertise in advanced Excel tools, including formulas, functions, and data analysis techniques.

Learn to efficiently organize, manage, and analyze large datasets using Excel PivotTables, Power Query, and advanced data tools, enabling faster insights and accurate decision-making.

Enhance productivity by mastering automation through Macros and VBA programming, making complex tasks effortless.

Gain skills in data visualization to design insightful charts and interactive dashboards that bring your data to life.

Understand data validation and error-checking techniques to maintain accuracy and reliability in your spreadsheets.

Apply your learning through hands-on projects, preparing you to tackle real-world business challenges with confidence.

Additional Info

Course Highlights

  • Kickstart Your Excel Mastery in Velachery Learn advanced formulas, PivotTables, Macros, VBA, and data analysis in one comprehensive Microsoft Excel course.
  • Gain an edge with dedicated job support and placement opportunities from top companies actively hiring skilled Excel professionals.
  • Join a thriving community of 10,000+ students successfully trained and placed through our 300+ hiring partners.
  • Learn directly from industry experts with 10+ years of experience in Excel and data management.
  • Experience beginner-friendly sessions, real-time projects, and complete career guidance designed to accelerate your growth.
  • Enjoy affordable fees, flexible batch timings, and 100% placement assistance ideal for freshers and career changers ready to step into the corporate world.

Benefits You Gain from a Microsoft Advanced Excel Course in Velachery

  • Boosts Data Management - Easily manage and efficiently organize large datasets with Microsoft Advanced Excel. Quickly sort, filter, and group information to reduce errors, improve accuracy, and ensure highly structured, streamlined, and professional data handling for better decision-making.
  • Enhances Data Analysis - Gain advanced expertise in Excel formulas, PivotTables, and data functions to analyze trends and patterns efficiently. Transform raw and complex datasets into meaningful insights, create visually appealing and smart reports, and empower businesses to make faster, more informed, and strategic decisions.
  • Automates Repetitive Tasks - Automate your daily processes seamlessly using Macros and VBA programming in Excel. Save valuable time, reduce manual effort, and significantly boost productivity, while allowing Excel to efficiently handle repetitive tasks with complete accuracy and zero errors, enabling you to focus on higher-value work and smarter decision-making.
  • Improves Reporting Skills - Create highly interactive and dynamic reports and dashboards using Excel charts, visuals, and advanced formatting techniques. Present data clearly, effectively, and visually appealing, making even complex information easy to understand and interpret for managers, clients, and stakeholders, enabling smarter business decisions.
  • Increases Job Opportunities - Advanced Excel is a highly sought-after and in-demand skill across multiple industries. Enroll for Microsoft Advanced Excel Certification in Velachery to unlock rewarding career opportunities in finance, data analysis, marketing, business operations, and more, while enhancing your efficiency, decision-making skills, and professional credibility.

Popular Tools Taught in Microsoft Advanced Excel Training in Velachery

  • PivotTables - Summarize, organize, and analyze large datasets effortlessly using Excel PivotTables. Build detailed and comprehensive reports without altering the original data, calculate totals, averages, and other key metrics, and uncover hidden trends and patterns to gain clear, actionable, and meaningful data insights for smarter business decisions.
  • Macros - Automate complex formatting, calculations, and routine daily tasks effortlessly using Excel Macros. Record, replay, and customize actions to save valuable time, eliminate repetitive work, improve workflow speed, and significantly reduce manual errors, enabling more efficient, accurate, and productive data management.
  • VLOOKUP and HLOOKUP - Use powerful Excel functions like VLOOKUP and HLOOKUP to quickly find, match, and retrieve specific data in seconds. These tools help you merge, compare, and cross-reference information from multiple sheets efficiently, saving time, simplifying complex data management, and ensuring accurate, error-free results for smarter decision-making.
  • Power Query - Collect, clean, and transform data from multiple sources effortlessly using Excel Power Query. Import files, databases, or web-based data, and prepare them for in-depth analysis with automated workflows that save valuable time, reduce errors, and streamline the data preparation process, enabling faster, more accurate, and actionable insights.
  • Conditional Formatting - Automatically highlight key values, trends, and patterns using Excel’s color-based conditional formatting rules. This powerful tool helps you quickly track changes, identify important data points, and present information visually, making complex datasets easier to understand, accelerating analysis, and enabling faster, smarter, and more informed decision-making.

Top Frameworks Every Microsoft Advanced Excel Professional Should Know

  • Data Analysis Framework - Learn to efficiently organize, analyze, and interpret large datasets using advanced Excel formulas, filters, and PivotTables. This powerful framework transforms raw and unstructured information into meaningful, actionable insights, helping businesses make smarter decisions, optimize strategies, and drive better performance across all operations.
  • Automation Framework - Use Macros and VBA in Excel to automate repetitive tasks such as reporting, formatting, and data processing. This powerful framework enhances accuracy, minimizes time spent on manual work, eliminates errors, and significantly increases your daily productivity, allowing you to focus on higher-value tasks and smarter decision-making.
  • Reporting Framework - Master the art of creating impactful visual reports using Excel charts, interactive dashboards, and dynamic visuals. This comprehensive framework helps you communicate insights clearly, effectively, and professionally to management, team members, and stakeholders, making complex data easy to understand and enabling smarter, faster business decisions.
  • Data Cleaning Framework - Use Excel Power Query, advanced text functions, and versatile filters to efficiently clean, organize, and transform messy datasets. This powerful approach ensures highly accurate results, produces reliable and comprehensive reports, and significantly improves the overall quality of data analysis, enabling faster, smarter, and more informed business decisions.
  • Lookup and Reference Framework - Combine and integrate datasets across multiple sheets efficiently using Excel functions like VLOOKUP, INDEX, and MATCH. This robust framework saves valuable time, ensures precise and accurate connections between diverse data sources, eliminates errors, and streamlines data analysis, enabling clearer insights and more informed decision-making for business operations.

Essential Skills You’ll Learn in a Microsoft Advanced Excel Course

  • Advanced Formula Expertise - Master advanced and complex Excel formulas to perform accurate calculations quickly and efficiently. This essential skill helps automate data analysis, streamline workflows, and confidently tackle real-world business problems with precision, speed, and reliability, enabling smarter decisions and enhanced productivity across all professional tasks.
  • Data Visualization - Create compelling charts, graphs, and interactive dashboards in Excel to showcase trends, patterns, and key metrics clearly and effectively. Visualizing data in this way makes reports more professional, enhances understanding, and allows teams and stakeholders to easily interpret information, enabling faster, smarter, and well-informed business decisions.
  • Automation with Macros and VBA - Automate repetitive and time-consuming Excel tasks efficiently using Macros and VBA programming. Save valuable time, minimize errors, and boost overall productivity by allowing Excel to perform manual operations automatically, freeing you to focus on critical analysis, strategic decision-making, and higher-value tasks with greater accuracy and efficiency.
  • Data Analysis Using PivotTables - Summarize, explore, and analyze large datasets easily using Excel PivotTables. Quickly identify trends, patterns, and key insights without relying on complex formulas, improving your analytical capabilities, enabling faster decision-making, and providing a clear and actionable understanding of data for more informed business strategies.
  • Efficient Data Management - Learn to efficiently clean, sort, and organize large datasets using Excel’s advanced tools like filters, conditional formatting, and Power Query. Ensure accurate, error-free results, streamline workflows, and create professional, well-structured data presentations that enhance analysis, improve decision-making, and boost overall productivity.

Key Roles and Responsibilities of Microsoft Advanced Excel Course

  • Data Analyst - Use Excel to efficiently collect, organize, and analyze data to support informed business decisions. Create detailed reports, interactive dashboards, and visual summaries that help companies monitor performance, uncover trends, identify growth opportunities, and make smarter, data-driven strategic choices across all operations.
  • Financial Analyst - Develop detailed budgets, forecasts, and comprehensive financial reports using advanced Excel formulas, PivotTables, and functions. Excel empowers financial analysts to efficiently analyze business performance, uncover trends, generate accurate projections, and make well-informed financial decisions that drive growth and strategic planning.
  • Business Analyst - Evaluate and interpret business data, create detailed charts, and generate actionable insights to support effective decision-making. Excel’s powerful tools help analyze key performance metrics, visualize trends, and present results in clear, professional, and easy-to-understand formats, enabling smarter business strategies and data-driven growth.
  • Operations Manager - Use Excel to efficiently monitor business performance, manage inventory, and track sales across multiple operations. With real-time and accurate data at your fingertips, operations managers can make smarter, data-driven decisions, optimize workflows, improve efficiency, and drive overall business growth and improvement with confidence.
  • Project Coordinator - Plan, schedule, and track project progress effectively using Excel sheets. Manage timelines, budgets, resource allocation, and team updates efficiently with automated reports, organized spreadsheets, and advanced tracking tools, enabling project managers to monitor progress, identify potential issues early, and ensure projects are completed on time and within budget.

Why Microsoft Advanced Excel Is the Smart Choice for Freshers

  • High Demand in Job Market – Many companies need employees who can handle data efficiently and advanced Excel skills are highly valued. Freshers with Excel training stand out because they can manage, analyze and present data effectively. This skill creates employment opportunities across a range of businesses. Developing your Excel skills makes your resume stronger and more appealing to employers.
  • Boosts Productivity – Understanding advanced Excel makes it easier to finish jobs more quickly and with fewer mistakes. It shows you to intelligently arrange data and automate tedious tasks. This skill saves time and increases your efficiency at work. Employers appreciate candidates who can get more done in less time.
  • Versatile Skill Set – Excel is used in many fields like finance, marketing, sales and administration. By learning Microsoft Advanced Excel, freshers gain skills that apply to different jobs and industries. Your chances of landing a job you enjoy are increased by this adaptability. Excel knowledge gives you the flexibility to explore various career paths.
  • Foundation for Data-Driven Roles – Excel is the starting point for many data related jobs such as data analysis and business intelligence. Training in advanced Excel builds a strong foundation for learning other tools and technologies later. It prepares recruits for future growth and aids in their understanding of data ideas. A successful data profession requires proficiency in Excel.
  • Cost-Effective Learning – Microsoft Advanced Excel training is widely accessible and reasonably priced when compared to many other technical courses. Freshers can quickly gain useful skills without investing too much time or money. This makes it an excellent choice for those starting their career journey. Its a smart investment with great returns in job opportunities.

Landing Remote Jobs with Microsoft Advanced Excel Skills

  • Work from Anywhere – With advanced Excel skills, you can handle data tasks and reports easily from your home or any location. Many remote jobs require strong Excel knowledge because work is mostly done on spreadsheets and data files. Being good at Excel allows to complete projects online without needing to be in an office. This flexibility is perfect for remote work.
  • Handle Data Independently – Operating remotely frequently means having little oversight. Proficiency in Excel enables you to successfully handle, evaluate, and display data on your own. You can make reports and fix problems without continual assistance. Remote employers place a great value on this independence.
  • Efficient Communication through Reports – Excel helps to create clear and professional reports, charts and dashboards that can be shared easily via email or cloud platforms. Good reporting skills improve communication with your team and managers, even if you are working remotely. Being able to present data clearly boosts your chances of success in remote roles.
  • Automate Tasks to Save Time – Managing several tasks well is a common requirement for remote work. You can do tasks more quickly and with less repeated labor if you use Excel macros and VBA automation. Even while working from home, having this ability helps to stay productive and meet deadlines. Excel facilitates time management, which is essential in remote work.
  • Work with Global Teams – Many remote jobs involve collaborating with teams across different countries. Excel skills allow to standardize data and reports so everyone understands the information clearly. This makes teamwork smoother and avoids confusion. Being proficient in Excel makes a valuable member of any remote team.

What to Expect in Your First Microsoft Advanced Excel Job

  • Handling Large Data Sets – In your first job, you’ll work with big amounts of data that need organizing and cleaning. You’ll use Excel tools like sorting, filtering and formulas to manage this data effectively. This helps your team make sense of complex information. Getting comfortable with large datasets is a key part of the role.
  • Creating Reports and Dashboards – You will often prepare reports and visual dashboards to show important data insights. Using charts, PivotTables and conditional formatting, you’ll make data easy to understand for others. These reports help managers make decisions quickly. Being able to present data clearly is an important skill you’ll develop.
  • Automating Repetitive Tasks – Macros and VBA will teach you how to automate repetitive chores, such as updating reports or formatting sheets. By reducing errors and saving time, automation improves the efficiency of your work. Being able to do more work with less effort is possible with this skill. You should anticipate developing these automation skills on the job over time.
  • Collaborating with Team Members – Your role will involve working closely with colleagues from different departments. You’ll share Excel files and data reports, making sure everyone understands the information. Good communication and teamwork are important to complete projects smoothly. Collaboration helps you learn new ways to use Excel too.
  • Meeting Deadlines and Accuracy – Your job will require delivering accurate data and reports on time. Attention to detail is important because mistakes can affect business decisions. You’ll learn to balance speed with accuracy as you handle daily tasks. Meeting deadlines while ensuring data quality is a vital part of the job.

Top Companies of Microsoft Advanced Excel Professionals

  • Microsoft – As the creator of Excel, Microsoft actively seeks professionals proficient in advanced Excel functionalities for roles in product development, data analysis and customer support. To improve and develop inside the Office suite, their teams frequently need Excel proficiency. Knowing Excel well can lead to a number of chances within the organization.
  • Goldman Sachs – Excel is used extensively by Goldman Sachs, a well-known international investment banking company, for trading, risk analysis and financial modeling. To handle intricate financial data and assist in decision-making, they usually employ experts with superior Excel skills. Proficiency in Excel is essential for positions in the company that involve quantitative analysis and finance.
  • Accenture – The multinational consulting and professional services firm Accenture makes substantial use of Excel for client reporting, financial modeling and data analysis. They employ experts with advanced Excel abilities for consulting, analytics and advisory services positions across a range of sectors. Delivering data driven insights and solutions to clients requires proficiency with Excel.
  • Walmart – Walmart, a multinational retail corporation, leverages Excel for inventory management, sales forecasting and financial analysis. They employ professionals skilled in advanced Excel to optimize supply chain operations and business analytics. Excel proficiency is vital for roles in retail operations and business intelligence within the company.
  • Infosys – Infosys a multinational technology company, offers various roles that require advanced Excel skills for data analysis, reporting and process automation. They seek professionals adept in Excel to support business operations and client projects. Excel proficiency is beneficial for roles in business analysis, finance and operations within Infosys.
Show More

Upcoming Batches For Classroom and Online

Weekdays
13 - Oct - 2025
08:00 AM & 10:00 AM
Weekdays
15 - Oct - 2025
08:00 AM & 10:00 AM
Weekends
18 - Oct - 2025
(10:00 AM - 01:30 PM)
Weekends
19 - Oct - 2025
(09:00 AM - 02:00 PM)
Can't find a batch you were looking for?
INR ₹30680
INR ₹33000

OFF Expires in

Who Should Take a Microsoft Advanced Excel Course

IT Professionals

Non-IT Career Switchers

Fresh Graduates

Working Professionals

Diploma Holders

Professionals from Other Fields

Salary Hike

Graduates with Less Than 60%

Show More

Job Roles For Microsoft Advanced Excel Course in Offline

Data Analyst

Financial Analyst

Business Analyst

Accountant

Operations Manager

Project Manager

Sales Analyst

Marketing Analyst

Show More

Tools Covered For Microsoft Advanced Excel Training

Qualys PivotTables Power Query Solver Power Pivot Macros (VBA) Data Analysis Toolpak Conditional Formatting

What’s included ?

Convenient learning format

📊 Free Aptitude and Technical Skills Training

  • Learn basic maths and logical thinking to solve problems easily.
  • Understand simple coding and technical concepts step by step.
  • Get ready for exams and interviews with regular practice.
Dedicated career services

🛠️ Hands-On Projects

  • Work on real-time projects to apply what you learn.
  • Build mini apps and tools daily to enhance your coding skills.
  • Gain practical experience just like in real jobs.
Learn from the best

🧠 AI Powered Self Interview Practice Portal

  • Practice interview questions with instant AI feedback.
  • Improve your answers by speaking and reviewing them.
  • Build confidence with real-time mock interview sessions.
Learn from the best

🎯 Interview Preparation For Freshers

  • Practice company-based interview questions.
  • Take online assessment tests to crack interviews
  • Practice confidently with real-world interview and project-based questions.
Learn from the best

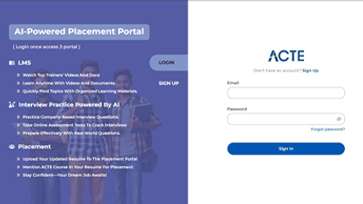
🧪 LMS Online Learning Platform

  • Explore expert trainer videos and documents to boost your learning.
  • Study anytime with on-demand videos and detailed documents.
  • Quickly find topics with organized learning materials.

Microsoft Advanced Excel course Syllabus

  • 🏫 Classroom Training
  • 💻 Online Training
  • 🚫 No Pre Request (Any Vertical)
  • 🏭 Industrial Expert

Our Microsoft Advanced Excel Training in Velachery is perfect for beginners and anyone looking to enhance their Excel expertise. Learn advanced formulas, PivotTables, Macros, VBA, and data analysis with ease. Gain skills in creating charts and dashboards to visualize your data effectively. Get hands-on experience through real-time projects and Microsoft Advanced Excel Internships in Velachery. We also provide full placement support, including resume building, interview practice, and guidance to secure the right job.

  • Introduction to Excel – Start with the basics of Excel, including formulas, functions, formatting and data types to build a strong foundation.
  • Advanced Tools and Features – Learn advanced topics like PivotTables, Macros, VBA and data analysis techniques for professional use.
  • Hands-On Project Work – Practice with real-time projects like dashboards, reports and data automation to gain practical experience.
  • Excel Tools and Integration – Use tools like Power Query and Excel Add-ins and learn to integrate Excel with other platforms for smarter workflows.
Excel Basics and User Interface
Formulas and Functions
Data Management Techniques
Data Analysis with PivotTables and PivotCharts
Advanced Excel Functions
Data Visualization and Dashboarding
Automation with Macros and Introduction to VBA

Build a strong foundation in Microsoft Excel essentials:

  • Excel Environment – Learn the ribbon, toolbars, menus and navigation
  • Workbook and Worksheet Management – Creating, saving and organizing data
  • Data Entry Techniques – Efficient methods to enter and edit data
  • Cell Formatting – Use of fonts, colors, borders and conditional formatting

Learn how to compute, assess, and change data:

  • Basic Functions – SUM, AVERAGE, MIN, MAX, COUNT
  • Logical Functions – IF, AND, OR, NOT for decision-making logic
  • Text Functions – LEFT, RIGHT, MID, CONCATENATE, TEXTJOIN
  • Date and Time Functions – TODAY, NOW, DATEDIF, NETWORKDAYS

Learn to organize, clean and structure data efficiently:

  • Sorting and Filtering – Basic and advanced options
  • Data Validation – Create dropdowns, restrict inputs
  • Remove Duplicates – Clean datasets with built in tools
  • Flash Fill and AutoFill – Speed up repetitive data entry

Summarize and analyze large datasets with dynamic tools:

  • Creating PivotTables – Grouping, summarizing and filtering data
  • PivotChart Creation – Visualize PivotTable results
  • Slicers and Timelines – Add interactivity to PivotTables
  • Calculated Fields – Perform custom calculations inside PivotTables

Dive deeper into data analysis using complex formulas:

  • Lookup Functions – VLOOKUP, HLOOKUP, INDEX, MATCH
  • Nested Functions – Combine functions for advanced logic
  • Array Formulas – Use of dynamic and legacy array functions
  • Error Handling – IFERROR, ISERROR and other error-checking tools

Present data clearly using professional visual tools:

  • Chart Types – Line, Column, Bar, Pie, Combo and more
  • Dynamic Charts – Use of named ranges and drop-down filters
  • Conditional Formatting – Highlight trends, outliers and duplicates
  • Mini Charts & Sparklines – Show data trends in a single cell

Automate processes to cut down on human labor and save time:

  • Recording Macros – Automate repetitive actions without coding
  • Macro-enabled Workbooks – Saving and managing macro files
  • Intro to VBA – Basics of Visual Basic for Applications
  • Running & Editing Macros – Modify simple VBA scripts

🎁 Free Addon Programs

Aptitude, Spoken English.

🎯 Our Placement Activities

Daily Task, Soft Skills, Projects, Group Discussions, Resume Preparation, Mock Interview.

Hands-on Real Time Microsoft Advanced Excel Projects

Placement Support Overview

Today's Top Job Openings for Microsoft Advanced Excel Professionals

Excel VBA Developer

Company Code: MPV669

Chennai, Tamil Nadu

₹20,000 to ₹50,000 per month

BBA

Exp 0–2 years

  • We’re actively seeking freshers for the role of Excel VBA Developer. You will learn to create Macros, use VBA coding and work with PivotTables to automate daily business tasks and improve efficiency.
  • Easy Apply

    MIS Executive

    Company Code: SLT129

    Chennai, Tamil Nadu

    ₹25,000 - ₹55,000 per month

    Any Degree

    Exp 0-1 year

  • Opportunities are now open for freshers as MIS Executives. You will work with advanced Excel functions like formulas and charts to prepare regular reports that help business teams make decisions.
  • Easy Apply

    Customer Service Data Analyst

    Company Code: AAT980

    Chennai, Tamil Nadu

    ₹15,000 - ₹48,000 per month

    Any Degree

    Exp 0–1 year

  • We’re looking to add fresh talent for the role of Customer Service Data Analyst. This job involves using Excel formulas, VLOOKUP and PivotTables to organize customer data and create useful reports.
  • Easy Apply

    Business Performance Analyst

    Company Code: FST576

    Chennai, Tamil Nadu

    ₹18,000 - ₹46,000per month

    BCA / BBA / MBA

    Exp 0–1 year

  • Now accepting applications for Business Performance Analysts. Freshers will learn to build Excel dashboards, use charts and analyze data to support business growth and performance tracking.
  • Easy Apply

    Advanced Excel / Power BI Specialist

    Company Code: HST452

    Chennai, Tamil Nadu

    ₹15,000–₹35,000 per month

    BBA

    Exp 0–1 year

  • We’re expanding and hiring freshers for Advanced Excel & Power BI Specialist roles. You will get hands-on experience with Excel functions, Power Query and Power BI for data analysis and reporting.
  • Easy Apply

    Junior MIS Executive

    Company Code: STC286

    Chennai, Tamil Nadu

    ₹15,000 - ₹20,000 per month

    Any Degree

    Exp 0–1 year

  • We’re actively seeking freshers as Junior MIS Executives. This role focuses on learning to prepare reports using advanced Excel tools like dashboards and formulas to help management.
  • Easy Apply

    Business Data Analyst

    Company Code: PGT369

    Chennai, Tamil Nadu

    ₹20,000 to ₹50,000 per month

    BBA / MBA / B.com

    Exp 0-2 yr

  • Opportunities available for freshers as Business Data Analysts. You will work with Excel, SQL basics and data visualization tools to support data-driven decision-making.
  • Easy Apply

    Finance Assistant

    Company Code: HST765

    Chennai, Tamil Nadu

    ₹15,000 - ₹20,000 per month

    B.com/ M.com

    Exp 0–1 year

  • Now accepting applications for Finance Assistant roles. Freshers will assist in budgeting, financial data entry and reporting using Excel formulas, PivotTables and simple Macros.
  • Easy Apply

    Highlights for Microsoft Advanced Excel Internships in Velachery

    Real Time Projects

    • 1. Gain hands-on experience by working on live Microsoft Advanced Excel-based applications.
    • 2. Understand real-world problem-solving through scenarios.
    Book Session

    Skill Development Workshops

    • 1. Participate in focused sessions on trending technologies and tools.
    • 2. Learn directly from industry experts through guided practical exercises.
    Book Session

    Employee Welfare

    • 1. Enjoy benefits like health coverage, flexible hours, and wellness programs.
    • 2. Companies prioritize mental well-being and work-life balance for all employees.
    Book Session

    Mentorship & Peer Learning

    • 1. Learn under experienced mentors who guide your technical and career growth.
    • 2. Collaborate with peers to enhance learning through code reviews and group projects.
    Book Session

    Soft Skills & Career Readiness

    • 1. Improve communication, teamwork, and time management skills.
    • 2. Prepare for interviews and workplace dynamics with mock sessions and guidance.
    Book Session

    Certification

    • 1. Earn recognized credentials to validate your Microsoft Advanced Excel skills.
    • 2. Boost your resume with course or project completion certificates from reputed platforms.
    Book Session

    Sample Resume for Microsoft Advanced Excel (Fresher)

    • 1. Simple and Neat Resume Format

      – Use a clean layout with clear sections like summary, skills, education, and projects.

    • 2. List of Technologies You Know

      – Mention skills like Data Analysis, Advanced Formulas, Pivot Tables, VLOOKUP & INDEX-MATCH, Dashboard Creation, Charting, Power Query, MS Excel.

    • 3. Real-Time Projects and Achievements

      – Add 1–2 real-time projects with a short description and the tools used.

    Top MicroSoft Advanced Excel Interview Questions and Answers (2025 Guide)

    Ans:

    Microsoft Excel is a powerful spreadsheet program for data management, analysis, and organization. It provides rows, columns, formulas, charts, graphs, and PivotTables to simplify calculations and insights.

    Ans:

    A cell is the smallest unit in Excel where a row and column intersect. Each cell has a unique address like "A1" and stores text, numbers, or formulas, forming the basic building blocks of any spreadsheet.

    Ans:

    A spreadsheet is a grid of rows and columns used to enter, calculate, and analyze data. Cells hold information, making it easy to organize, visualize, and manage budgets, reports, and other business data efficiently.

    Ans:

    A cell address identifies a cell’s location in a sheet using a column letter and row number, like “B2.” It’s used to reference data in formulas, quickly locate information, or link cells across sheets.

    Ans:

    Yes, new cells can be added by right-clicking a row or column and selecting "Insert." Excel shifts existing rows or columns to create space, allowing you to expand your worksheet as needed.

    Ans:

    Excel allows formatting cells with fonts, colors, alignment, number formats, and borders. Formatting improves readability, highlights important data, and makes reports visually appealing and easier to interpret.

    Ans:

    Yes, you can insert comments in any cell for notes or explanations. A small indicator shows the comment, which appears when hovered over. This helps with collaboration, reminders, and clarifying data entries.

    Ans:

    Absolutely. Additional rows or columns can be inserted anytime to accommodate more data. This ensures spreadsheets remain organized, flexible, and easy to manage as information grows.

    Ans:

    The Ribbon is the toolbar under the title bar containing tabs like Home, Insert, and Formulas. Each tab organizes Excel tools into groups for easy access to commands and features efficiently.

    Ans:

    Select the cell below the row and right of the column to freeze. Choose "Freeze Panes" to keep rows/columns visible while scrolling. This helps view headers or key sections without losing context.

    Company-Specific Interview Questions from Top MNCs

    1. What does a Data Analyst do?

    Ans:

    A Data Analyst collects, organizes, and examines data to support business decisions. Using Excel, they identify trends and patterns, helping organizations improve strategies and operations efficiently.

    2. Which tools are commonly used by Data Analysts?

    Ans:

    Data Analysts use Excel for data management, SQL for queries, Python or R for advanced analysis, and visualization tools like Power BI or Tableau to present insights clearly.

    3. How do you manage missing information in Excel datasets?

    Ans:

    Missing data can be handled by removing incomplete rows, filling gaps with average/median values, or flagging missing entries. This ensures accurate and meaningful analysis.

    4. What distinguishes a data warehouse from a database?

    Ans:

    A database stores operational data for daily use, while a data warehouse compiles historical data from multiple sources to support reporting and analysis in Excel.

    5. Why is cleaning data important before analysis?

    Ans:

    Cleaning Excel data removes duplicates, fixes errors, and standardizes formats. This step ensures data accuracy and reliable analysis for better business decisions.

    6. What does data normalization mean in Excel?

    Ans:

    Normalization organizes data to reduce repetition and improve clarity. Structured tables ensure consistency, making spreadsheets easier to manage and analyze effectively.

    7. How can you create a pivot table in Excel?

    Ans:

    Select your data, go to Insert Pivot Table, and arrange fields in rows, columns, values, and filters. PivotTables summarize and analyze large datasets efficiently.

    8. Can you explain the concept of joins and how Excel handles data merging?

    Ans:

    Joins combine multiple tables in databases. In Excel, use VLOOKUP, HLOOKUP, or XLOOKUP to merge and relate data across sheets for consolidated insights.

    9. What is data visualization and why is it useful in Excel?

    Ans:

    Data visualization uses charts and graphs to show trends and patterns clearly. Excel charts help communicate insights and simplify complex datasets for decision-making.

    10. How do you perform data validation in Excel?

    Ans:

    Data validation restricts cell input to specific values, ranges, or dropdown lists. This ensures accurate data entry and prevents errors in analysis or reporting.

    1. What are the differences between Excel's absolute and relative cell references?

    Ans:

    Absolute references (like $A$1) keep the exact cell fixed when copying formulas, while relative references (like A1) change based on the position of the formula. Using absolute and relative references correctly helps control how formulas adjust across your worksheet.

    2. How do you calculate accuracy metrics like precision or recall in Excel?

    Ans:

    You can calculate metrics like precision and recall by using Excel formulas to count True Positives, False Positives and False Negatives. Functions like COUNTIF help tally results and simple formulas then calculate these rates for performance evaluation.

    3. What techniques do you use to handle imbalanced datasets in Excel?

    Ans:

    For imbalanced data in Excel, you might use filtering and sorting to isolate smaller groups, apply weighting by creating helper columns with adjusted values or duplicate entries manually or with formulas to simulate oversampling.

    4. How do you validate your Excel model to ensure reliability?

    Ans:

    Model validation in Excel involves splitting your data into test and training sets (manually or using formulas), checking model outputs on both sets and using techniques like cross-validation by cycling through different data samples to confirm consistent performance.

    5. What is multicollinearity and how can you detect and resolve it in Excel?

    Ans:

    Multicollinearity happens when two or more variables in your Excel dataset are highly correlated, which can affect analysis results. You can detect it by calculating correlation coefficients using the CORREL function and reduce it by removing or combining correlated columns.

    6. How can you assess the quality of data grouping or clustering in Excel?

    Ans:

    To evaluate clusters in Excel, you can calculate distance metrics manually, use conditional formatting to visualize groupings or plot data points using scatter plots and visually inspect how well groups separate.

    7. Can you explain the Central Limit Theorem in relation to Excel?

    Ans:

    The Central Limit Theorem states that if you take multiple samples from your data in Excel and calculate their averages, the averages will eventually form a normal distribution as the number of samples increases, regardless of the starting data distribution.

    8. What is A/B testing and how can you perform it using Excel?

    Ans:

    A/B testing compares two sets of data (Group A and Group B). In Excel, you can organize data into separate columns, calculate summary statistics (mean, variance) and perform hypothesis testing like the t-test using built-in functions like T.TEST to analyze differences.

    9. How does a decision tree concept translate into Excel?

    Ans:

    While Excel doesn't build decision trees automatically, you can simulate decision trees by creating nested IF statements or using the IFS function to split data based on criteria, mimicking the branching logic used in decision trees.

    10. What is overfitting in Excel models and how can you avoid it?

    Ans:

    Overfitting in Excel happens when your model is too closely tailored to your sample data, capturing noise instead of true trends. To avoid this, simplify formulas, test models on different data subsets and avoid overly complex nested functions that don’t generalize well.

    1. Who is a Data Analyst and what do they do using Excel?

    Ans:

    A person who collects, arranges and analyzes data in order to get valuable insights is known as a data analyst. Using Excel they clean data, perform calculations and create charts or reports that help businesses make smarter decisions based on the information they uncover.

    2. What are the common tools for data analysis and how does Excel fit in?

    Ans:

    Data analysts often use tools like Excel, SQL, Python and visualization software such as Power BI or Tableau. With tools like formulae, pivot tables and charts that make data analysis easier to understand, Excel is essential for basic to advanced data processing.

    3. How do you deal with missing data in Excel?

    Ans:

    In Excel missing data can be managed by filtering out blank cells, filling gaps using functions like AVERAGE or IF to impute values or highlighting missing values using conditional formatting. These methods help maintain data quality before analysis.

    4. What is the difference between labeled and unlabeled data in Excel terms?

    Ans:

    Labeled data means you have clear categories or outcomes associated with your data entries (like “Yes” or “No”) which Excel can use for sorting or conditional formulas. Unlabeled data lacks such categories and might require exploratory analysis, like sorting or clustering, to uncover patterns.

    5. How can you explain regression analysis using Excel?

    Ans:

    Regression analysis in Excel involves examining how one or more independent variables relate to a dependent variable. You can use Excel’s built-in tools like the Data Analysis Toolpak to perform linear regression, helping predict outcomes based on input data.

    6. What types of regression can you perform with Excel?

    Ans:

    Excel mainly supports linear regression through the Data Analysis Toolpak. While it doesn’t directly support logistic regression or regularization methods like Ridge or Lasso simple linear models can be created and more advanced techniques may require add-ins or external tools.

    7. How do you maintain data quality in Excel?

    Ans:

    To ensure data quality in Excel, you can use data validation rules to restrict input, clean data by removing duplicates or correcting errors and regularly audit your spreadsheets with filters and error-checking tools to keep your dataset accurate.

    8. What does data normalization mean in Excel and why is it useful?

    Ans:

    Data normalization in Excel means adjusting values to a common scale, often between 0 and 1, so that no single variable outweighs others in calculations. This is useful when comparing data from different units or preparing for analyses like clustering.

    9. What is a pivot table in Excel and why is it important?

    Ans:

    One of Excel's most useful tools for rapidly summarizing, organizing and analyzing big data sets is the pivot table. It assists in transforming unstructured data into insightful reports, facilitating trend identification and figure comparison without the need for intricate calculations.

    10. What does the p-value indicate and can you calculate it in Excel?

    Ans:

    The significance of your statistical test results can be ascertained with the use of the p-value. Using Excel functions like T.TEST, you can compute p-values to determine if your results are likely the result of chance or reflect actual effects in your data.

    1. How can you identify patterns in data using Excel?

    Ans:

    In Excel, patterns in data can be identified using tools like conditional formatting, sorting, filtering and charts. Features like trendlines in graphs and functions such as FORECAST, CORREL or LINEST help spot relationships between data points.

    2. What is the importance of balancing data analysis complexity in Excel?

    Ans:

    When analyzing data in Excel, its important to strike a balance between oversimplifying (which might miss key insights) and overcomplicating (which can confuse users). Using the right level of formulas, functions or pivot tables helps maintain both clarity and accuracy.

    3. What is data validation in Excel and why is it important?

    Ans:

    Excel data validation makes ensuring that the information entered into a cell complies with predetermined guidelines. For example, it can restrict inputs to a number range or specific text values. This helps maintain clean, accurate data and avoids errors in analysis.

    4. What is a confusion matrix equivalent in Excel and how can you represent classification results?

    Ans:

    In Excel, you can build a confusion matrix manually using count functions like COUNTIFS to compare predicted and actual outcomes. From there, you can calculate performance metrics like Accuracy, Precision, Recall and F1-Score using Excel formulas.

    5. What is the purpose of using constraint-based formulas (like data caps) in Excel analysis?

    Ans:

    Adding constraints (such as maximum values or target thresholds using MIN, MAX or IF statements) in Excel helps control data behavior, reduce errors and avoid overfitting the analysis to just one dataset similar to how regularization works in machine learning.

    6. How can you use Excel for combining multiple models or forecasts?

    Ans:

    Excel allows you to average multiple forecast outputs or scenarios using AVERAGE, WEIGHTED AVERAGE or IF logic to blend different models. This is similar to "bagging" in machine learning, where multiple results are combined to improve overall accuracy.

    7. How does the concept of optimization apply in Excel?

    Ans:

    In Excel, optimization can be done using tools like Solver, which finds the best value for a formula under certain constraints. This is comparable to how gradient descent in M minimizes or maximizes a value by gradually modifying variables.

    8. What is the difference between combining data sets randomly vs. sequentially in Excel?

    Ans:

    When combining datasets randomly (like shuffling or sampling), you're applying a concept like bagging. Sequential combination, where results depend on previous steps (e.g., building formulas in stages), is more like boosting each step improves on the last.

    9. How do you deal with blank or missing values in Excel?

    Ans:

    You can manage missing data in Excel by using IF(ISBLANK()), filtering out empty cells or replacing blanks with values like averages using IF and AVERAGE functions. Additionally, pivot tables make it possible to efficiently disregard or summarize missing data.

    10. How can data be made simpler and what does Excel's dimensionality reduction mean?

    Ans:

    While Excel doesn’t have PCA directly you can reduce dimensions by removing irrelevant columns, using correlation analysis to detect redundancy or summarizing data with pivot tables. This simplifies your data and focuses your analysis on key variables.

    1. How can hidden factors affect Excel data analysis?

    Ans:

    In Excel-based analysis, hidden or external variables can impact the results of your calculations these are similar to confounding variables. For example, when analyzing how hours studied affect exam scores, an untracked factor like prior subject knowledge might influence both. This can lead to misleading conclusions unless the variable is accounted for. Excel doesn't detect this automatically, but you can explore the influence of extra variables using filters, pivot tables or regression tools in the Data Analysis ToolPak.

    2. How does Excel help you analyze a sample versus a population?

    Ans:

    In Excel, you can work with either the full population dataset or a sample of it. A population includes all data points (e.g., every customer purchase in a year), while a sample is a smaller portion (e.g., purchases from one month). Summary statistics like average, median or standard deviation can be calculated using functions like AVERAGE() or STDEV.S() for a sample and STDEV.P() for a population.

    3. How might bias and variation impact your trends or forecasts in Excel?

    Ans:

    If you're building trendlines or forecasts in Excel (using charts or regression), bias and variance impact accuracy. High bias may result from using overly simple trendlines (like linear when the pattern is curved), while high variance can happen if you try to match the data too closely, overfitting noise. Excel allows testing this by comparing predicted vs. actual values across different samples and adjusting the trendline type accordingly.

    4. Can Excel replicate the concept of neural networks?

    Ans:

    While Excel isn't designed for neural networks, you can simulate basic logic or layers using nested formulas, matrix multiplication and conditional functions (IF(), MMULT(), etc.). Excel also supports add-ins or Power Query and can be linked with Python for more advanced models if needed.

    5. How is image pattern recognition like CNNs related to Excel?

    Ans:

    Though CNNs (Convolutional Neural Networks) are used for image processing in machine learning, in Excel you can analyze structured image data like pixel matrices. With conditional formatting or matrix formulas, you can identify patterns or high-intensity areas, but full CNN functionality is outside Excel’s core features.

    6. How does Excel help with analyzing sequences, similar to RNNs?

    Ans:

    Recurrent Neural Networks (RNNs) are used for time-based data. In Excel, you can analyze time series using formulas, lags and rolling averages. Use OFFSET() or INDEX() functions to refer to previous rows, allowing you to simulate memory-like behavior for analyzing trends over time.

    7. What is autocorrelation and can Excel show it?

    Ans:

    Autocorrelation tells you whether past values in a time series relate to current ones. In Excel, you can calculate autocorrelation by creating lagged versions of a time series and using CORREL() to compare them. This is useful for detecting patterns or cycles in time-based data.

    8. How can Excel demonstrate the Law of Large Numbers?

    Ans:

    To visualize the Law of Large Numbers in Excel, you can simulate repeated trials using random numbers (RAND() or RANDBETWEEN()) and calculate the running average with AVERAGE() over increasing data ranges. You'll observe that as more trials are added, the average stabilizes toward the expected value.

    9. Can Excel be used in real-world analytics like machine learning models?

    Ans:

    Yes, Excel can be used as a deployment mechanism for machine learning reasoning that has been simplified. You can export coefficients from a model you've made in Python or another language and use formulas to apply them in Excel. For instance, SUMPRODUCT() can be used to apply linear regression weights to forecast results depending on Excel user inputs.

    10. Can Excel support recommendation-like systems, similar to collaborative filtering?

    Ans:

    Excel can mimic collaborative filtering by analyzing user preferences across items using pivot tables and similarity scores. You can calculate correlations between users or items using CORREL() and suggest items that similar users rated highly. Though basic, this offers a simple recommendation model in Excel.

    Disclaimer Note:

    The details mentioned here are for supportive purposes only. There are no tie-ups or links with the corresponding PGs.

    Ladies PG Accommodation

      Velachery
    • Sanz Live Women's PG : 72007 19990
    • Krishnaveni Castle : 90801 95007
    • Anna Nagar
    • Pentos Women's PG : 93427 57797
    • Women's Nest - Ladies PG : 94451 25894
    • OMR
    • MSR Luxury PG : 89399 91922
    • Porur
    • Sree Shakthi Ladies Hostel : 90031 98767
    • Friends Ladies Hostel : 73389 19836
    • Tambaram
    • CK HIVE Girls Ladies PG90948 58303
    • Layaa Women’s Hostel63797 00573

    Mens PG Accommodation

      Velachery
    • Stayflix PG for Men's : 96000 45088
    • DJ Men's PG Velachery : 90803 19242
    • Anna Nagar
    • Stay Inn Men's Hostel(PG) : 94454 87884
    • Brights Boys Hostel : 88387 88921
    • OMR
    • Sree Siddhi Vinayaka Mens PG : 95577 95579
    • Rudhra Men’s PG : 93636 45199
    • Porur
    • SIDDHANS Men's PG : 88259 71908
    • Jaswanth Raaj Mens PG : 89255 15888
    • Tambaram
    • Sri Sai Grn Men's PG : 81228 24076
    • Rolexx Men's PG : 80988 84848

    Top Microsoft Advanced Excel Job Opportunities for Freshers

    • 1. Microsoft Jobs at Startups and IT Companies
    • 2. Campus Placements and IT Service Jobs
    • 3. Internship-to-Job Programs
    • 4. Apply Through Job Portals
    • 5. Skills That Help You Get Hired

    Getting Started With Advanced Excel Course in Velachery

    No Coding
    8 Lakhs+ CTC
    No Work Pressure
    WFH Jobs (Remote)

    Why Microsoft Excel is the Ultimate Career Choice

    High Demand

    Companies prefer multi-skilled professionals who can handle entire project cycles.

    Global Opportunities

    Open doors to remote and international job markets.

    High Salary

    Enjoy competitive salaries and rapid career advancement.

    Flexible Career Path

    Explore roles such as developer, architect, freelancer, or entrepreneur.

    Future-Proof Career

    Stay relevant with skills that are consistently in demand in the evolving tech landscape.

    Versatility Across Industries

    Work in various domains like e-commerce, healthcare, finance, and more.

    Career Support

    Placement Assistance

    Exclusive access to ACTE Job portal

    Mock Interview Preparation

    1 on 1 Career Mentoring Sessions

    Career Oriented Sessions

    Resume & LinkedIn Profile Building

    Get Microsoft Advanced Excel Certification

    You'll receive a certificate proving your industry readiness.Just complete your projects and pass the pre-placement assessment.This certification validates your skills and prepares you for real-world roles.

    Popular Excel certifications you can pursue include:

    • Microsoft Office Specialist (MOS) Excel Expert
    • Microsoft Certified: Excel Associate
    • Microsoft Certified: Data Analyst Associate (using Excel and Power BI)
    • Microsoft Excel Specialist Certification

    Excel certification demonstrates your advanced skills in formulas, data analysis, and reporting. With our 100% job guarantee and full placement support, you gain complete job readiness, build confidence, and secure a strong advantage in today’s highly competitive job market.

    The amount of time it takes to become certified in Excel depends on your study habits and existing ability level. Beginners may need to practice and study consistently for one to three months. For users who are already familiar with the fundamentals of Excel, becoming ready might just take a few weeks. Understanding the exam objectives and practicing frequently with real datasets are important.

    • Validates your expertise in Excel and data management
    • Opens up more job opportunities in fields like finance, marketing and operations
    • Increases your earning potential and career growth prospects
    • Enhances your professional credibility and trustworthiness
    • Provides you with practical skills for efficient data analysis and reporting
    • Study the official exam topics and practice all key Excel features
    • Use sample tests and practice exams regularly to track progress
    • Focus on mastering formulas, pivot tables, charts and data tools
    • Join Excel training classes or online study groups for support
    • Take timed practice exams to mimic exam settings and develop time management skills.

    Complete Your Course

    A Downloadable Certificate in PDF Format, Immediately Available to You When You Complete Your Course.

    Get Certified

    A Physical Version of Your Officially Branded and Security-Marked Certificate.

    Get Certified

    Lowest Microsoft Excel Course Fees

    Affordable, Quality Training for Freshers to Launch IT Careers & Land Top Placements.

    Call Course Advisor

    How is ACTE's Microsoft Excel Course in Velachery Different?

    Feature

    ACTE Technologies

    Other Institutes

    Affordable Fees

    Competitive Pricing With Flexible Payment Options.

    Higher Microsoft Advanced Excel Fees With Limited Payment Options.

    Industry Experts

    Well Experienced Trainer From a Relevant Field With Practical Microsoft Advanced Excel Training

    Theoretical Class With Limited Practical

    Updated Syllabus

    Updated and Industry-relevant Microsoft Advanced Excel Course Curriculum With Hands-on Learning.

    Outdated Curriculum With Limited Practical Training.

    Hands-on projects

    Real-world Microsoft Advanced Excel Projects With Live Case Studies and Collaboration With Companies.

    Basic Projects With Limited Real-world Application.

    Certification

    Industry-recognized Microsoft Advanced Excel Certifications With Global Validity.

    Basic Microsoft Advanced Excel Certifications With Limited Recognition.

    Placement Support

    Strong Placement Support With Tie-ups With Top Companies and Mock Interviews.

    Basic Placement Support

    Industry Partnerships

    Strong Ties With Top Tech Companies for Internships and Placements

    No Partnerships, Limited Opportunities

    Batch Size

    Small Batch Sizes for Personalized Attention.

    Large Batch Sizes With Limited Individual Focus.

    LMS Features

    Lifetime Access Course video Materials in LMS, Online Interview Practice, upload resumes in Placement Portal.

    No LMS Features or Perks.

    Training Support

    Dedicated Mentors, 24/7 Doubt Resolution, and Personalized Guidance.

    Limited Mentor Support and No After-hours Assistance.

    Microsoft Advanced Excel Course FAQs

    1. What basic skills should I have before starting advanced Excel training?

    It’s helpful to have a solid understanding of Excel basics such as formulas, formatting, and data entry. Familiarity with the Excel interface makes learning advanced features easier and faster.
    Advanced Excel skills are highly valued in finance, marketing, operations, and data analysis. Professionals who can automate tasks, analyze large datasets, and create dynamic reports are highly sought after.
    Courses cover advanced functions like VLOOKUP, INDEX-MATCH, and conditional formulas, as well as PivotTables, Power Query, Macros, VBA for automation, and data visualization using charts and dashboards.
    Yes, practical projects are included to help learners apply their knowledge. Projects often involve creating financial models, automated reports, and interactive dashboards.
    Many courses guide learners to build a portfolio showcasing completed projects, templates, and reports, which enhances credibility when applying for jobs.
    Anyone with basic Excel knowledge and a desire to improve their data handling skills can enroll. Students, professionals, analysts, and managers from any field are welcome.
    No formal qualifications are required. A firm understanding of Excel basics is enough, and most courses include a quick refresher to bring everyone up to speed.
    While helpful, prior experience is not mandatory. Courses often include introductory lessons covering essential skills like formulas, formatting, and navigation.
    Yes, beginners can join after a brief self-study or foundational Excel course. The program builds on existing skills and introduces advanced Excel tools.

    1. What kind of job placement assistance is offered?

    Programs provide resume reviews, interview coaching, and access to job boards. Some courses also connect learners with companies seeking Excel-skilled candidates.

    2. Are course projects useful for job applications?

    Yes, projects demonstrate practical Excel skills and can be included in portfolios or resumes to showcase capabilities in reporting, automation, and data analysis.

    3. Can I apply to top companies after completing advanced Excel training?

    Yes, training improves your eligibility for reputable companies, especially in finance, consulting, and IT, where advanced Excel skills are highly valued.

    4. Is placement support available for freshers and career changers?

    Yes, many programs offer additional support for new graduates or professionals switching careers, including interview practice and guidance on showcasing Excel expertise.
    Yes, learners receive a certificate validating their advanced Excel skills, which can be added to resumes and LinkedIn profiles to demonstrate expertise to employers.
    Absolutely. Certification signals proficiency in handling complex data tasks, often leading to better job prospects, higher pay, and career advancement opportunities.
    A basic understanding of Excel and interest in improving data analysis and automation skills is sufficient. Prior professional experience helps but is not essential.
    The course equips learners to analyze data, automate workflows, and present insights effectively, making them stand out in roles requiring strong analytical capabilities.
    Skills include advanced formulas, PivotTables, charts, automation via Macros and VBA, large dataset management, data visualization, and reporting for business decision-making.

    1. Is job support included in the course fee?

    Yes, most courses include job placement assistance, such as resume building, interview preparation, and career counseling to help learners transition into Excel-focused roles.
    Fees depend on factors like instructor experience, course content, availability of learning materials, and additional services such as one-on-one coaching or lifetime access.
    Many providers offer flexible payment plans, early-bird discounts, or scholarships, making training accessible for learners at different experience levels.
    No, fees are consistent across locations, ensuring equal access to quality training for all learners, whether in a major city or smaller town.
    Learn (Advanced Formulas + PivotTables & Charts + Power Query + Dashboards + VBA & Macros + Data Analysis) at a 30,680/- Only.
    Acte Technologies WhatsApp

    Microsoft Advanced Excel Course for All Graduates, NON-IT, Diploma & Career Gaps — ₹30,680/- only.

    Download Brouchure