Last updated on 22nd Jun 2020| 2673
What is Clustering?
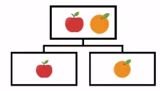
Imagine that you have a group of chocolates and liquorice candies. You are required to separate the two eatables. Intuitively, you are able to separate them based on their appearances. The process of segregating objects into groups based on their respective characteristics is called clustering. In clusters, the features of objects in a group are similar to other objects present in the same group.
Clustering is used in various fields like image recognition, pattern analysis, medical informatics, genomics, data compression etc. It is part of the unsupervised learning algorithm in machine learning. This is because the data-points present are not labelled and there is no explicit mapping of input and outputs. As such, based on the patterns present inside, clustering takes place.
Types of Clustering
Clustering is a type of unsupervised learning wherein data points are grouped into different sets based on their degree of similarity. There are primarily two categories of clustering:
- Hierarchical clustering
- Partitioning clustering
Hierarchical clustering is further subdivided into:
- Agglomerative clustering
- Divisive clustering
Partitioning clustering is further subdivided into:
- K-Means clustering
- Fuzzy C-Means clustering
Hierarchical Clustering
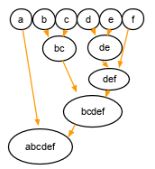
Hierarchical clustering uses a tree-like structure, like so:
In agglomerative clustering, there is a bottom-up approach. We begin with each element as a separate cluster and merge them into successively more massive clusters, as shown below:
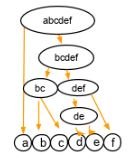
Divisive clustering is a top-down approach. We begin with the whole set and proceed to divide it into successively smaller clusters, as you can see below:
Partitioning Clustering
Partitioning clustering is split into two subtypes – K-Means clustering and Fuzzy C-Means.
In k-means clustering, the objects are divided into several clusters mentioned by the number ‘K.’ So if we say K = 2, the objects are divided into two clusters, c1 and c2, as shown:
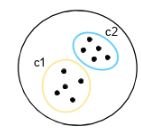
Here, the features or characteristics are compared, and all objects having similar characteristics are clustered together.
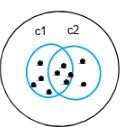
Fuzzy c-means is very similar to k-means in the sense that it clusters objects that have similar characteristics together. In k-means clustering, a single object cannot belong to two different clusters. But in c-means, objects can belong to more than one cluster, as shown.
During data analysis many a times we want to group similar looking or behaving data points together. For example, it can be important for a marketing campaign organizer to identify different groups of customers and their characteristics so that he can roll out different marketing campaigns customized to those groups or it can be important for an educational institute to identify the groups of students so that they can launch the teaching plans accordingly. Classification and clustering are two fundamental tasks which are there in data mining for long, Classification is used in supervised learning (Where we have a dependent variable) while clustering is used in un-supervised learning where we don’t have any knowledge about dependent variable.
Clustering helps to group similar data points together while these groups are significantly different from each other.
Applications of K-Means Clustering
K-Means clustering is used in a variety of examples or business cases in real life, like:
- Academic performance
- Diagnostic systems
- Search engines
- Wireless sensor networks
Academic Performance
Based on the scores, students are categorized into grades like A, B, or C.
Diagnostic systems
The medical profession uses k-means in creating smarter medical decision support systems, especially in the treatment of liver ailments.
Search engines
Clustering forms a backbone of search engines. When a search is performed, the search results need to be grouped, and the search engines very often use clustering to do this.
Wireless sensor networks
The clustering algorithm plays the role of finding the cluster heads, which collects all the data in its respective cluster.
K-Means Clustering
There are multiple ways to cluster the data but K-Means algorithm is the most used algorithm. Which tries to improve the inter group similarity while keeping the groups as far as possible from each other.
Basically K-Means runs on distance calculations, which again uses “Euclidean Distance” for this purpose. Euclidean distance calculates the distance between two given points using the following formula:
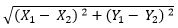
Euclidean Distance =
Above formula captures the distance in 2-Dimensional space but the same is applicable in multi-dimensional space as well with increase in number of terms getting added. “K” in K-Means represents the number of clusters in which we want our data to divide into. The basic restriction for K-Means algorithm is that your data should be continuous in nature. It won’t work if data is categorical in nature.
Data Preparation
As discussed, K-Means and most of the other clustering techniques work on the concept of distances. They calculate distance from a specific given points and try to reduce it. The problem occurs when different variables have different units, e.g., we want to segment population of India but weight is given in KGs but height is given in CMs. One can understand that the distance matric discussed above is highly susceptible to the units of variables. Hence, it is advisable to standardize your data before moving towards clustering exercise.
Algorithm
K-Means is an iterative process of clustering; which keeps iterating until it reaches the best solution or clusters in our problem space. Following pseudo example talks about the basic steps in K-Means clustering which is generally used to cluster our data
Start with number of clusters we want e.g., 3 in this case. K-Means algorithm start the process with random centers in data, and then tries to attach the nearest points to these centers
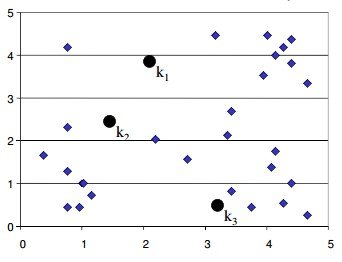
Algorithm then moves the randomly allocated centers to the means of created groups

Get K-Means Clustering Algorithm Training Course and Get Hired By TOP MNCs
Weekday / Weekend BatchesSee Batch Details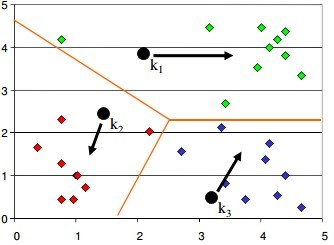
In the next step, data points are again reassigned to these newly created centers
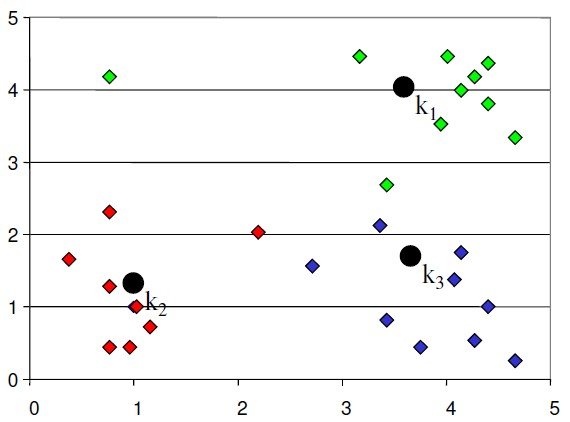
Steps 2 & 3 are repeated until no member changes their association/ groups
Implementation in R
The step-wise pseudo code above explains about the K-Means clustering algorithm, but the basic question which should arrive is that how to decide the number of clusters (K)? How did someone identified that we need 3 clusters in above example? The objective of clustering exercise is to get the groups in a fashion that they are homogeneous within clusters and distinct from other groups. The very objective works as the solution to decide number of clusters “K” which we want to have in data. There is no mathematical formula which can directly give us Steps 2 & 3 are repeated until no member changes their association/ groupsanswer to “K” but it is an iterative process where we need to run multiple iterations with various values of “K” and choose the one which is best fulfilling our purpose (As explained above).
How the K-means algorithm works
To process the learning data, the K-means algorithm in data mining starts with a first group of randomly selected centroids, which are used as the beginning points for every cluster, and then performs iterative (repetitive) calculations to optimize the positions of the centroids
It halts creating and optimizing clusters when either:
- The centroids have stabilized — there is no change in their values because the clustering has been successful.
- The defined number of iterations has been achieved.
K-means algorithm example problem
Let’s see the steps on how the K-means machine learning algorithm works using the Python programming language.
We’ll use the Scikit-learn library and some random data to illustrate a K-means clustering simple explanation.
Step 1: Import libraries
- import pandas as pdimport numpy as npimport matplotlib.pyplot as pltfrom sklearn.cluster import KMeans%matplotlib inline
As you can see from the above code, we’ll import the following libraries in our project:
- Pandas for reading and writing spreadsheets
- Numpy for carrying out efficient computations
- Matplotlib for visualization of data
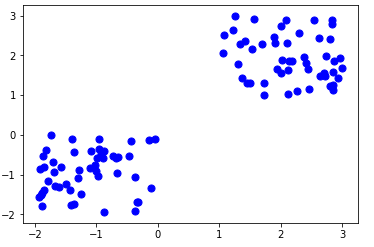
Step 2: Generate random data
Here is the code for generating some random data in a two-dimensional space:
- X= -2 * np.random.rand(100,2)X1 = 1 + 2 * np.random.rand(50,2)X[50:100, :] = X1plt.scatter(X[ : , 0], X[ :, 1], s = 50, c = ‘b’)plt.show()
A total of 100 data points has been generated and divided into two groups, of 50 points each.
Here is how the data is displayed on a two-dimensional space:

Best K-Means Clustering Algorithm Training from Real-Time Experts to Build Your Skills
- Instructor-led Sessions
- Real-life Case Studies
- Assignments
Step 3: Use Scikit-Learn
We’ll use some of the available functions in the Scikit-learn library to process the randomly generated data.
Here is the code:
- from sklearn.cluster import KMeansKmean = KMeans(n_clusters=2)Kmean.fit(X)
In this case, we arbitrarily gave k (n_clusters) an arbitrary value of two.
Here is the output of the K-means parameters we get if we run the code:
- KMeans(algorithm=’auto’, copy_x=True, init=’k-means++’, max_iter=300 n_clusters=2, n_init=10, n_jobs=1, precompute_distances=’auto’, random_state=None, tol=0.0001, verbose=0)
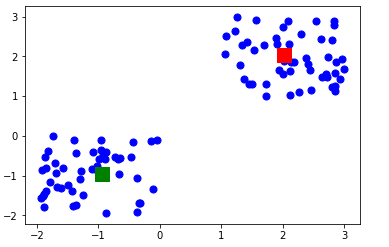
Step 4: Finding the centroid
Here is the code for finding the center of the clusters:
- Kmean.cluster_centers_
Here is the result of the value of the centroids:
- array([[-0.94665068, -0.97138368], [ 2.01559419, 2.02597093]])
Let’s display the cluster centroids (using green and red color).
- plt.scatter(X[ : , 0], X[ : , 1], s =50, c=’b’)plt.scatter(-0.94665068, -0.97138368, s=200, c=’g’, marker=’s’)plt.scatter(2.01559419, 2.02597093, s=200, c=’r’, marker=’s’)plt.show()
Here is the output:
Step 5: Testing the algorithm
Here is the code for getting the labels property of the K-means clustering example dataset; that is, how the data points are categorized into the two clusters.
- Kmean.labels_
Here is the result of running the above K-means algorithm code:
- array([0, 0, 0, 0, 0, 0, 0, 0, 0, 0, 0, 0, 0, 0, 0, 0, 0, 0, 0, 0, 0, 0, 0, 0, 0, 0, 0, 0, 0, 0, 0, 0, 0, 0, 0, 0, 0, 0, 0, 0, 0, 0, 0, 0, 0, 0, 0, 0, 0, 0, 1, 1, 1, 1, 1, 1, 1, 1, 1, 1, 1, 1, 1, 1, 1, 1, 1, 1, 1, 1, 1, 1, 1, 1, 1, 1, 1, 1, 1, 1, 1, 1, 1, 1, 1, 1, 1, 1, 1, 1, 1, 1, 1, 1, 1, 1, 1, 1, 1, 1])
As you can see above, 50 data points belong to the 0 cluster while the rest belong to the 1 cluster.
For example, let’s use the code below for predicting the cluster of a data point:
- sample_test=np.array([-3.0,-3.0])second_test=sample_test.reshape(1, -1)Kmean.predict(second_test)
Here is the result:
- array([0])
It shows that the test data point belongs to the 0 (green centroid) cluster.
Conclusion:
K–means clustering technique is a simple quick algorithm that can be applied to large datasets to separate them into different partitions; analysis of these partitions may provide a better characterization of neck pathologies and may be of additional benefit in distinguishing benign and malignant .Hope you have found all the details that you were looking for, in this article.