Last updated on 26th Jul 2025| 12031
- Introduction to Trading Indicators?
- Types of Technical Indicators
- Trend Indicators: Moving Averages, MACD
- Momentum Indicators: RSI, Stochastic Oscillator
- Volume-Based Indicators: OBV, VWAP
- Volatility Indicators: Bollinger Bands, ATR
- Sentiment Indicators and Market Psychology
- Combining Multiple Indicators Effectively
- Indicator Use in Different Markets (Forex, Stocks, Crypto)
- Conclusion
Introduction To Technical Trading Indicators
Technical Trading Indicators are tools used in technical analysis to forecast future price movements based on historical data such as price, volume, and volatility. These indicators use mathematical formulas to generate signals that help traders make informed decisions. Common types include trend indicators like Moving Averages and MACD, best trading indicators which identify the direction of the market; momentum indicators such as RSI and the Stochastic Oscillator, Market Psychology which measure the speed of price changes; volatility indicators like Bollinger Bands and ATR, which show how much the index trading is fluctuating; and volume indicators such as On-Balance Volume, which analyze the strength of price movements based on trading volume. Traders use these indicators to confirm trends, generate buy or sell signals, and manage risk by setting stop-loss or take-profit levels. However, no indicator is completely reliable on its own, so traders often combine several to improve accuracy and reduce the chance of false signals. Overall, trading indicators are essential for simplifying complex market data into actionable insights, making them valuable tools for both beginner and experienced traders.
Do You Want to Learn More About Database? Get Info From Our Database Online Training Today!
Types of Technical Indicators
- Trend Indicators: Trend indicators help identify the direction and strength of a market trend. They show whether the market is moving upward, downward, or sideways. Traders use them to determine entry and exit points based on the trend’s behavior.
- Momentum Indicators: Momentum indicators measure the speed at which prices move. They help identify whether an asset is overbought or oversold, signaling potential reversals or continuations. These indicators are useful for spotting changes in price strength.
- Volatility Indicators: Volatility indicators show the degree of price movement over a specific period. They help best trading indicators understand market activity and risk. High volatility may indicate large price swings, while low volatility suggests a stable market.
- Volume Indicators: Volume indicators analyze the number of shares or contracts traded in a given period. They help confirm the strength of price movements. Increasing volume during a price move typically signals stronger momentum behind the trend.
- Support and Resistance Tools: Support and resistance tools identify key price levels where the market tends to reverse or consolidate. Support is a level where buying interest is strong enough to prevent the index trading from falling further, while resistance is a level where selling pressure may stop the price from rising.
Trend Indicators: Moving Averages, MACD
- Moving Averages (MA): Moving Averages smooth out price data to help identify the overall direction of a trend. They reduce short-term fluctuations and make it easier to see the underlying trend.
- Simple Moving Average (SMA): The SMA calculates the average of closing prices over a specific period (e.g., 10-day, 50-day). It gives equal weight to all prices in the period and is useful for identifying long-term trends
- Exponential Moving Average (EMA): The EMA also calculates the average price over a specific period but gives more weight to recent prices. This makes it more responsive to recent market changes and better suited for short-term trading signals.
- MACD (Moving Average Convergence Divergence): MACD is a trend-following momentum indicator that shows the relationship between two EMAs, typically the 12-day and 26-day. It generates signals based on crossovers, divergence, and the histogram to identify potential buy or sell opportunities.
- Above 70: Overbought (potential reversal)
- Below 30: Oversold (potential rebound)
- %K: Fast line
- %D: Moving average of %K
- Readings above 80 = Overbought
- Readings below 20 = Oversold
- Crossover signals potential entry/exit
- Momentum indicators are excellent for short-term trading strategies.
- Developed by John Bollinger, these consist of
- A 20-period SMA (middle band)
- An upper band: +2 standard deviations
- A lower band: –2 standard deviations
- Price near upper band: Overbought
- Price near lower band: Oversold
- Band squeeze: Impending volatility spike
- High ATR: Volatile market
- Low ATR: Consolidation
- Trend: Use MA to confirm direction
- Momentum: RSI to gauge strength
- Volume: OBV or VWAP to confirm breakout
- Volatility: ATR to set stops
- Avoid using multiple indicators from the same category (e.g., RSI + Stochastic).
- Look for agreement among trend, momentum, and volume signals.
- Less is more 2–3 well-understood indicators are better than 7 misunderstood ones.
- The goal is to increase signal reliability and reduce false entries.
- Key Indicators: MACD, RSI, ATR, Moving Averages
- Unique Considerations: High liquidity and 24-hour market
- Key Indicators: OBV, VWAP, Bollinger Bands
- Unique Factors: Volume and earnings impact prices
Would You Like to Know More About Database? Sign Up For Our Database Online Training Now!
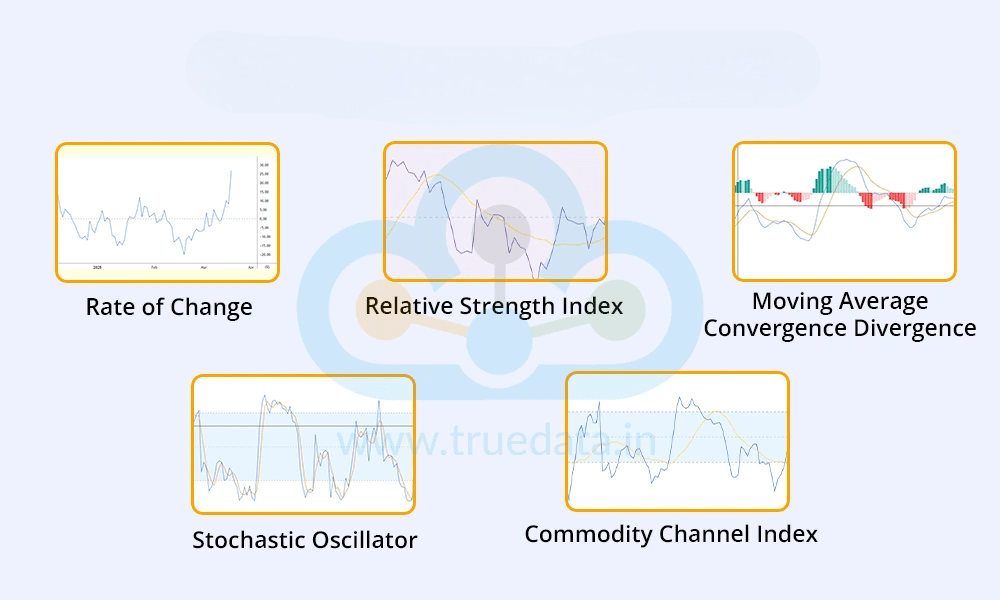
Momentum Indicators: RSI, Stochastic Oscillator
Relative Strength Index (RSI)
SI measures the speed and change of price movements on a scale of 0 to 100.
RSI Divergence
Price makes a new high, RSI doesn’t – signals weakening momentum.
Stochastic Oscillator
This compares a stock’s closing price to its price range over a set period.
Interpretation:

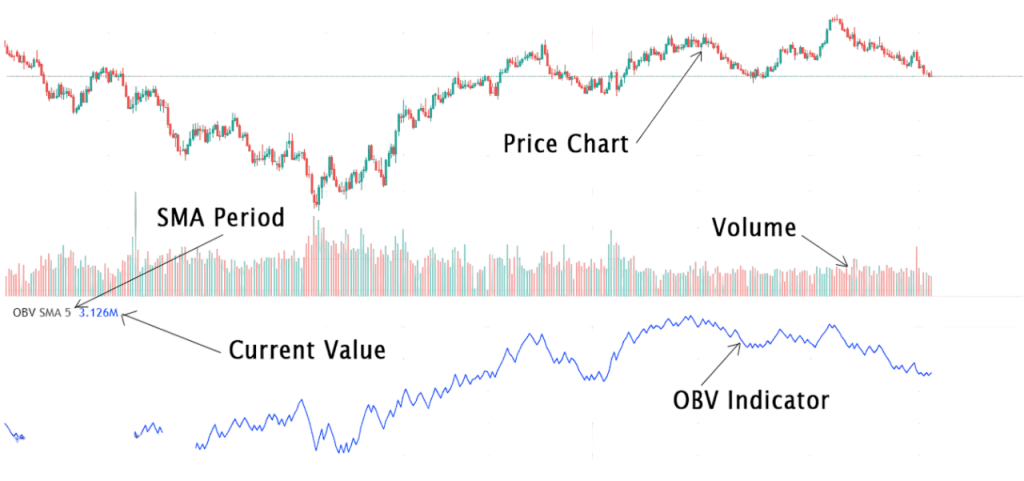
Volume-Based Indicators: OBV, VWAP
On-Balance Volume (OBV) : is a technical analysis indicator that uses trading volume to predict changes in price. It works on the principle that volume precedes price movement, meaning that if a security is seeing increased volume without significant price change, a price move may soon follow. OBV adds volume on up days and subtracts it on down days to create a cumulative total, which helps identify buying or selling pressure. When OBV is rising, it suggests that buyers are accumulating shares, which could lead to higher prices. Conversely, a falling OBV indicates selling pressure and the potential for a price decline. Traders often use Volume-Based Indicators OBV to confirm trends or spot divergences between volume and price, which can signal a possible reversal.
VWAP (Volume Weighted Average Price):VWAP (Volume Weighted Average Price) is a trading indicator that calculates the average price of a security throughout the trading day, weighted by volume. Its price action insight into the true average index trading at which a stock has traded and is commonly used by institutional best trading indicators to gauge the market’s value. VWAP is calculated by taking the total value traded (price multiplied by volume) and dividing it by the total volume. It resets at the beginning of each trading day and is especially useful for intraday trading. When the price is above the VWAP, it indicates bullish sentiment, best trading indicators, suggesting buyers are in control. When the price is below the VWAP, it reflects bearish sentiment. Traders use VWAP as a dynamic support or resistance level and to avoid buying too far above or selling too far below the average market price.
To Earn Your Database Certification, Gain Insights From Leading Blockchain Experts And Advance Your Career With ACTE’s Database Online Training Today!
Volatility Indicators: Bollinger Bands, ATR
Bollinger Bands
Interpretation:
ATR (Average True Range)
ATR measures market volatility by averaging the true range over a specific period.
Sentiment Indicators and Market Psychology
Sentiment indicators measure the overall mood or attitude of traders and investors toward a particular market or asset. They help gauge whether market participants are feeling optimistic (bullish) or pessimistic (bearish), which can influence price movements. These indicators often include metrics like the put-call ratio, volatility indexes, or surveys of investor confidence. Understanding market psychology is crucial because emotions such as fear and greed can drive prices away from their fundamental values, leading to overbought or oversold conditions. By analyzing sentiment indicators, traders can identify potential turning points when the majority opinion may be wrong, helping them anticipate reversals or continuations in market trends. In essence, sentiment indicators price action insight into the collective psychology behind market behavior, Volume-Based Indicators, complementing technical and fundamental analysis for better decision-making.
Preparing for a Database Job? Have a Look at Our Blog on Database Interview Questions and Answers To Ace Your Interview!
Combining Multiple Indicators Effectively
Relying on a single indicator can be misleading. Instead, many traders use confluence combining different indicators to validate signals.
Example Strategy:
Rules of Thumb:
Indicator Pitfalls and Misinterpretations
Technical Trading Indicators pitfalls and misinterpretations occur when traders rely too heavily or incorrectly on technical indicators, leading to poor decisions. One common issue is treating indicators as foolproof signals rather than tools that provide probabilities, which can cause traders to act on false or lagging signals. Indicators often work best when combined with other analysis methods, but overloading charts with too many indicators can create confusion and conflicting information. Another pitfall is ignoring the market context indicators may behave differently in trending versus ranging markets, so applying them without understanding the current market conditions can lead to mistakes. Additionally, many indicators lag price action because they are based on past data, so reacting solely to their signals may result in late entries or exits. Misinterpretation can also happen when traders fail to understand how an indicator is calculated or when its signals are valid. Being aware of these limitations and using indicators as part of a broader strategy,Volume-Based Indicators helps avoid common mistakes and improves trading effectiveness.
Indicator Pitfalls and Misinterpretations
Forex Trading
Volatility tools like ATR help set stop-losses.
Stock Market
Stock traders may use fundamentals alongside indicators.
Cryptocurrency Trading
- Key Indicators: RSI, MACD, Bollinger Bands
- Unique Traits: Extreme volatility and sentiment-driven moves
- 24/7 Trading: Requires indicators suitable for all hours
In crypto, momentum and sentiment indicators carry more weight due to speculative nature.
Conclusion
In conclusion, technical trading Indicators are vital tools in technical analysis that help traders interpret market behavior and make strategic decisions. By analyzing trends, momentum, volatility, and volume, these indicators provide insights that can enhance timing, improve risk management, and increase the accuracy of trades. While no single indicator guarantees success, using a combination of them thoughtfully can significantly improve a trader’s edge in the markeTrading indicators are powerful tools that can enhance price action, identify opportunities, and manage risks. Whether you’re a beginner or experienced trader, understanding how to use trend, momentum, volume, volatility, and sentiment indicators is critical to navigating financial markets.By mastering , best trading indicators and integrating technical indicators with sound risk management and market psychology, traders can achieve index trading , discipline, and long-term success.