Last updated on 26th Jul 2025| 11587
- Definition of a Bond and Its Purpose
- Key Characteristics: Face Value, Coupon, Maturity
- Types of Bonds: Government, Corporate, Municipal
- Bond Markets and How Bonds are Traded
- How Interest Rates Affect Bond Prices
- Yield to Maturity (YTM) and Other Yield Metrics
- Credit Ratings and Risk Assessment
- Callable, Convertible, and Zero-Coupon Bonds
- Bond Investment Strategies
- Bonds vs. Stocks: Comparative Analysis
- Role of Bonds in a Diversified Portfolio
- Recent Trends in Bond Investing and ESG Bonds
- Conclusion
Definition of a Bond and Its Purpose
A bond is a fixed-income financial instrument representing a loan made by an investor to a borrower, typically a corporation, government, or municipality. Bonds are used by entities to raise capital for various projects, operational needs, or refinancing existing debts. When investors purchase bonds, they effectively lend money to the issuer in exchange for periodic interest payments (coupons) and the return of the bond’s face value at maturity. The primary purpose of bonds is to provide issuers with funds without diluting ownership, as occurs in equity financing. Bonds offer investors a relatively predictable income stream and capital preservation, making them a critical component in diversified investment portfolios.
Do You Want to Learn More About Database? Get Info From Our Database Online Training Today!
Key Characteristics: Face Value, Coupon, Maturity
Bonds are complex financial instruments with several key features that investors need to grasp. The face value, usually ₹1,000 or ₹100, is the principal amount investors will get when the bond matures. It also serves as the basis for calculating interest payments. The coupon rate, which is a percentage of the face value, decides the annual interest the issuer pays. For example, a 6% coupon on a ₹1,000 bond gives ₹60 each year, typically paid in two installments. Maturity dates can vary significantly, from short-term, which is under one year, to long-term, which is over ten years. This variety offers flexibility for investors. When bonds are first issued, they are usually priced close to their face value. The yield reflects the effective return, which can change based on the purchase price and holding period. Knowing these basic elements helps investors make informed choices and navigate the bond market more effectively.
Types of Bonds: Government, Corporate, Municipal
- Government Bonds: Issued by national governments (e.g., India’s Government Securities or G-Secs). These are generally considered low-risk because of the government’s taxing power.
- Corporate Bonds: Issued by companies to finance expansion, acquisitions, or operations. Risk and returns vary widely based on the issuing company’s creditworthiness.
- Municipal Bonds: Issued by state or local governments or agencies to fund public projects like infrastructure, schools, or hospitals. Often come with tax advantages for investors.
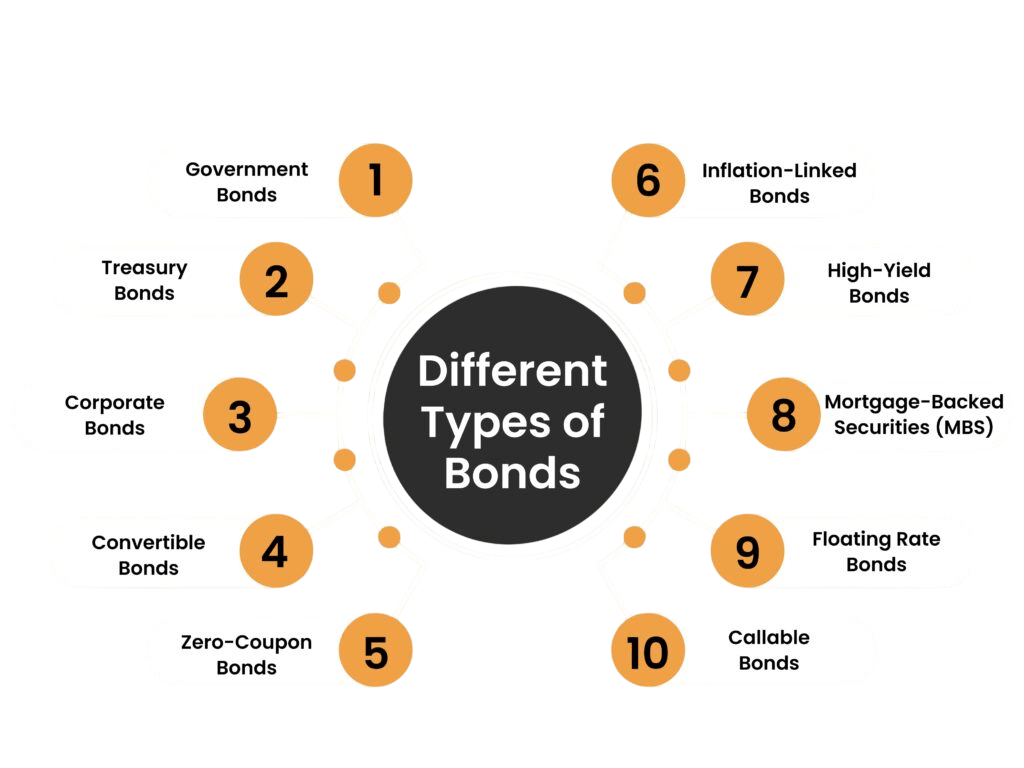
Other specialized types include agency bonds, supranational bonds, and sovereign bonds issued by foreign governments.
Would You Like to Know More About Database? Sign Up For Our Database Online Training Now!
Bond Markets and How Bonds are Traded
Bonds are traded in two primary markets:
- Primary Market: This is where bonds are issued for the first time. Governments or corporations sell them directly to investors, often through auctions or public offerings. It’s how issuers raise fresh capital.
- Secondary Market: Once bonds are issued, they can be traded among investors on this market. It provides liquidity meaning bondholders can sell before maturity and it helps establish market value through price discovery.
Bond trading occurs over-the-counter (OTC) rather than centralized exchanges, though some countries have bond exchanges. Prices fluctuate based on interest rates, issuer credit quality, and market demand. Market participants include institutional investors (banks, pension funds), retail investors, and governments. Transparent pricing and efficient trading systems have made bond markets critical to global finance.

How Interest Rates Affect Bond Prices
In the bond investment world, bond prices and interest rates have an important inverse relationship that investors need to grasp. When interest rates increase, the prices of existing bonds typically drop. This happens because fixed coupon payments look less attractive compared to new bonds that offer higher yields. On the other hand, when interest rates decrease, the prices of existing bonds rise, showing the greater value of their fixed coupon payments. For example, a bond with a 5% coupon is less appealing if new bonds are available at 6%. As a result, its price decreases to stay competitive in the market. Savvy investors use metrics like duration and convexity to manage and forecast interest rate risks effectively. This helps them make better investment choices in a constantly changing financial environment.
To Earn Your Database Certification, Gain Insights From Leading Blockchain Experts And Advance Your Career With ACTE’s Database Online Training Today!
Yield to Maturity (YTM) and Other Yield Metrics
Yield to Maturity (YTM) shows the total expected return on a bond if held until its maturity date. It considers coupon payments and possible gains or losses from buying at a discount or premium. YTM is an important financial measure that reflects the internal rate of return (IRR) on a bond’s cash flows. This helps investors understand potential investment performance better. In addition to YTM, other key yield measures include Current Yield, which looks at annual coupon payments in relation to the current market price, and Yield to Call (YTC), which assesses possible returns if a bond is redeemed early by the issuer. Investors also use Yield Spread to evaluate credit risk by comparing yields between different bonds. Overall, YTM provides a strong and flexible way to compare bonds with various characteristics, helping investors make more informed and strategic decisions.
Credit Ratings and Risk Assessment
Credit ratings evaluate the issuer’s ability to meet its financial obligations. Agencies like Moody’s, Standard & Poor’s, and Fitch assign ratings from AAA (highest quality) to D (default). Ratings affect borrowing costs; higher-rated issuers enjoy lower interest expenses, while lower-rated or junk bonds carry higher yields reflecting greater risk. Investors use ratings to assess default risk, adjust portfolios, and comply with regulatory or mandate requirements.
Preparing for a Database Job? Have a Look at Our Blog on Database Interview Questions and Answers To Ace Your Interview!
Callable, Convertible, and Zero-Coupon Bonds
- Callable Bonds: These allow issuers to redeem the bond before maturity at a preset call price. Investors are compensated for the risk of early redemption especially during falling interest rates with higher yields.
- Convertible Bonds: Can be converted into a predetermined number of equity shares, combining the stability of fixed income with potential for capital appreciation if the issuer’s stock performs well.
- Zero-Coupon Bonds: Sold at a significant discount and do not pay periodic interest. The investor’s return comes from the difference between purchase price and face value paid at maturity ideal for long-term planning like education or retirement.
Each bond type caters to different investor goals whether seeking income, growth, or managing interest rate and market risk.
Bond Investment Strategies
Investors deploy various strategies depending on objectives and market conditions:
- Buy and Hold: Investors purchase bonds and hold them until maturity. This strategy focuses on reliable income and capital preservation, especially in stable interest rate environments.
- Laddering: A portfolio of bonds is structured with staggered maturities. This improves liquidity and reduces reinvestment risk, offering regular cash flows and flexibility.
- Barbell Strategy: Combines short-term and long-term bonds while skipping mid-term maturities. It balances higher yield potential with short-term responsiveness to interest rate changes.
- Active Trading: Investors frequently buy and sell bonds, aiming to profit from market fluctuations, yield curve movements, or macroeconomic shifts. Requires sharp timing and market insight.
- Credit Risk Diversification: A mix of bonds with varying credit ratings allows investors to balance safety (high-rated) with potential returns (low-rated), optimizing portfolio performance.
Strategic use of bonds helps manage portfolio volatility, generate income, and preserve capital.
Bonds vs. Stocks: Comparative Analysis
In the investment world, bonds and stocks have unique benefits that appeal to different types of investors. Bonds are usually seen as less risky. They offer fixed income and have priority over stocks in case of liquidation, along with predictable coupon payments. On the other hand, stocks signify ownership and often provide higher returns. However, they come with increased market volatility and less dependable dividend income. Smart investors understand how these investment options work together. They often mix bonds and stocks to build diversified portfolios that balance risk and possible returns. Additionally, bonds can effectively protect against stock market drops, offering stability to investors in uncertain financial situations. By choosing investments that match their risk tolerance and financial goals, investors can create strong portfolios that help grow their wealth over time.
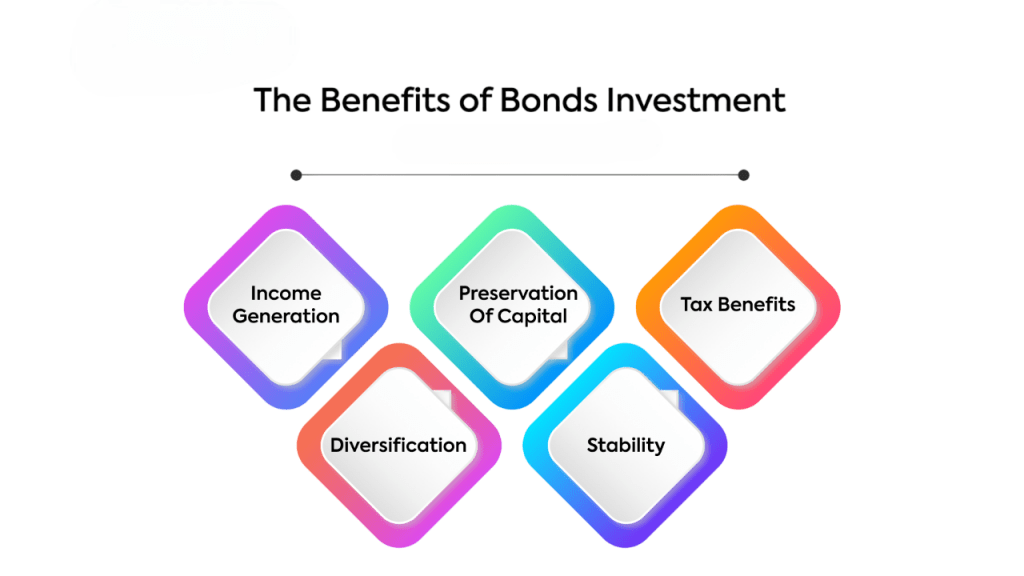
Role of Bonds in a Diversified Portfolio
Bonds play critical roles in investment portfolios by:
- Providing Stability: Bonds typically exhibit lower price volatility than equities, helping smooth portfolio performance over time.
- Generating Income: They deliver regular interest payments, making them valuable for retirees or income-focused investors.
- Risk Mitigation: Bonds act as a counterbalance to equities, especially during market downturns, reducing overall portfolio risk.
- Liquidity: Many bonds are traded in active secondary markets, allowing investors to buy or sell with relative ease.
- Inflation Protection: Instruments like inflation-linked bonds adjust payouts with inflation, preserving purchasing power.
The right bond allocation depends on the investor’s age, goals, risk appetite, and market outlook.
Recent Trends in Bond Investing and ESG Bonds
These trends reflect a broader evolution in fixed-income investing, where sustainability, technology, and data-driven strategies are reshaping how investors assess risk, generate returns, and contribute to global development goals.
- ESG Bonds: Increasing interest in ESG (Environmental, Social, Governance) bonds that finance sustainable projects.
- Green Bonds: Growth of green bonds targeting environmental initiatives.
- Bond ETFs & Digital Platforms: Advances in bond ETFs and digital trading platforms improving accessibility and liquidity.
- Low/Negative Interest Rates: PLow or negative interest rate environments prompting search for yield.
- AI & Big Data in Credit Analysis: Incorporation of AI and big data for credit analysis and portfolio management.
ESG bonds have gained traction as investors prioritize sustainable impact alongside financial returns, reshaping fixed-income markets worldwide.
Conclusion
Bonds remain indispensable in global finance, offering a diverse range of instruments tailored for income, risk management, and capital preservation. Their key characteristics, from face value to maturity, define their risk-return profiles. Government, corporate, and municipal bonds meet varied issuer needs and investor preferences. Interest rate movements, credit quality, and bond features like callability or convertibility influence prices and yields. Through sound investment strategies and portfolio diversification, bonds help achieve balanced financial goals. With evolving market trends and the rise of ESG investing, bonds continue to adapt, providing investors with opportunities that align with both financial and social objectives.