
Last updated on 26th Jul 2025| 11656
- Introduction to Break-Even Analysis
- Fixed vs Variable Costs
- Calculating the Break-Even Point
- Break-Even Charts and Interpretation
- Contribution Margin Concept
- Use in Business Planning and Pricing
- Break-Even Analysis for Multi-Product Firms
- Limitations and Assumptions of the Model
- Margin of Safety and Operating Leverage
- Sensitivity Analysis and Scenario Planning
- Break-Even Analysis in Decision Making
- Conclusion
Introduction to Break-Even Analysis
Break-even analysis is a fundamental financial tool used by businesses to determine the point at which total revenues equal total costs, resulting in neither profit nor loss. This critical threshold is known as the break-even point (BEP). Understanding the BEP helps entrepreneurs and managers make informed decisions about pricing, cost control, sales targets, and profitability. It forms the backbone of budgeting and strategic planning by highlighting the minimum performance necessary to avoid losses. The concept gained widespread popularity due to its simplicity and applicability across various industries. Whether launching a startup, expanding product lines, or optimizing operations, break-even analysis provides a clear metric to evaluate financial viability.
Do You Want to Learn More About Database? Get Info From Our Database Online Training Today!
Fixed vs Variable Costs
A thorough understanding of costs is essential for break-even analysis. Costs can be broadly classified into:
- Fixed costs remain constant regardless of the level of production or sales volume. These include rent, salaries, insurance, depreciation, and certain administrative expenses. Fixed costs must be paid even if the business produces nothing.
- Variable costs fluctuate directly with the level of production or sales. Examples include raw materials, direct labor, packaging, and sales commissions. As production increases, variable costs rise proportionally.
Fixed Costs:
Variable Costs:
The distinction is vital because break-even analysis depends on separating costs into these two categories to calculate the sales volume needed to cover fixed costs plus variable expenses.
Calculating the Break-Even Point
Break-Even Point in Units:
- BEP (units)=Fixed CostsSelling Price per Unit−Variable Cost per Unit\text{BEP (units)} = \frac{\text{Fixed Costs}}{\text{Selling Price per Unit} – \text{Variable Cost per Unit}} The denominator represents the Contribution Margin per Unit, i.e., the amount each unit sold contributes toward covering fixed costs after variable costs are deducted.
- BEP (sales)=Fixed CostsContribution Margin Ratio\text{BEP (sales)} = \frac{\text{Fixed Costs}}{\text{Contribution Margin Ratio}} Where, Contribution Margin Ratio=Contribution Margin per UnitSelling Price per Unit\text{Contribution Margin Ratio} = \frac{\text{Contribution Margin per Unit}}{\text{Selling Price per Unit}} This metric is useful for companies that sell multiple products or services priced differently.
- X-Axis: Typically represents the number of units sold or sales volume
- Y-Axis: Represents dollars, either costs or revenues
- Total Fixed Costs: A horizontal line showing constant fixed costs
- Total Variable Costs: A line starting at zero and increasing with sales volume
- Total Costs: The sum of fixed and variable costs
- Total Revenue: A line beginning at zero and increasing with sales volume
- Break-Even Point: The intersection where total revenue equals total cost
- Profit Zone: Beyond the break-even point, the business earns a profit
- Loss Zone: Below the break-even point, the business incurs losses
- Purpose: Aids quick decision-making and communication with stakeholders
- Calculating the weighted average contribution margin based on the sales mix.
- Using the weighted contribution margin to determine overall break-even sales.
- Assumption of Linear Costs: Assumes fixed and variable costs remain constant, which may not hold true at different production levels.
- Single Product Focus: Basic analysis is simplified and less effective for multi-product firms without adjustments.
- Constant Selling Price: Prices are assumed stable, ignoring discounts or changes.
- Short-term Perspective: Ignores long-term factors such as economies of scale or market dynamics.
- Ignores Inventory: Does not factor in inventory changes which affect cash flow and profit.
- Margin of Safety (MOS): The margin of safety indicates how much sales can drop before the business incurs losses. Margin of Safety = Current Sales − Break-Even Sales
- Expressed as a percentage of sales: MOS % = (Margin of Safety ÷ Current Sales) × 100. A higher MOS implies greater risk protection and financial stability.
- Operating Leverage: Operating leverage measures how sensitive operating income is to changes in sales volume. Degree of Operating Leverage = Contribution Margin ÷ Operating Income. Businesses with high fixed costs relative to variable costs have high operating leverage. Small sales changes can significantly impact profits, increasing risk but also potential rewards.
- Enhanced Analysis: Break-even analysis can be improved with sensitivity analysis by evaluating how changes in key variables affect the break-even point.
- Price Changes: Adjustments in pricing can shift the break-even threshold significantly.
- Cost Fluctuations: Variations in fixed or variable costs may alter financial outcomes.
- Sales Volume Variations: Changes in units sold directly impact profitability and break-even targets.
- Scenario Planning: Testing best-case, worst-case, and most-likely situations helps managers understand financial impacts and prepare contingency plans under uncertainty.
- Make or Buy Decisions: Comparing costs to determine outsourcing feasibility.
- Product Line Decisions: Identifying products that contribute positively to fixed costs.
- Expansion or Contraction: Evaluating financial feasibility of growth or downsizing.
- New Product Launch: Estimating sales needed for profitability.
Break-Even Point in Sales Value:
Would You Like to Know More About Database? Sign Up For Our Database Online Training Now!
Break-Even Charts and Interpretation
A break-even chart visually illustrates the relationship between costs, revenues, and profit at various levels of sales.
Let me know if you’d like a visual version of this or more examples in the same format.

Contribution Margin Concept
The Contribution Margin is the amount remaining from sales revenue after variable expenses are deducted. It contributes toward covering fixed costs and generating profit. Contribution Margin=Sales−Variable Costs\text{Contribution Margin} = \text{Sales} – \text{Variable Costs}.
Expressed as a percentage:
Contribution Margin Ratio=Contribution MarginSales\text{Contribution Margin Ratio} = \frac{\text{Contribution Margin}}{\text{Sales}} High contribution margins mean that each sale significantly contributes to fixed costs and profit, allowing the business to break even faster. Understanding contribution margin helps in pricing strategies, product mix optimization, and cost control efforts.
To Earn Your Database Certification, Gain Insights From Leading Blockchain Experts And Advance Your Career With ACTE’s Database Online Training Today!
Use in Business Planning and Pricing
Break-even analysis is a useful tool that helps businesses make smart decisions in financial planning. By looking closely at the contribution margin, companies can set pricing structures that cover their costs and generate profit. This method lets firms set clear sales targets, showing the minimum volume needed to prevent losses and maintain steady operations. Additionally, break-even analysis offers important insights into cost management, helping businesses identify and possibly cut high fixed or variable costs that affect overall profits. When considering investments like new equipment or market expansions, companies can use this method to see how these decisions will change their break-even points and support better budgeting plans. In the end, using break-even analysis effectively helps organizations create realistic financial forecasts, reduce risks, and improve their competitive edge in complex markets.
Break-Even Analysis for Multi-Product Firms
For companies selling multiple products, break-even analysis becomes complex because each product has its own price, cost structure, and sales mix.
The general approach involves:
The formula becomes:
BEP (sales)=Total Fixed CostsWeighted Average Contribution Margin Ratio\text{BEP (sales)} = \frac{\text{Total Fixed Costs}}{\text{Weighted Average Contribution Margin Ratio}} This approach ensures the break-even point accounts for the combined effect of all products, aiding portfolio management and strategic decisions about product emphasis.
Preparing for a Database Job? Have a Look at Our Blog on Database Interview Questions and Answers To Ace Your Interview!
Limitations and Assumptions of the Model
Despite its utility, break-even analysis has inherent limitations:
Managers must use break-even analysis alongside other tools and exercise judgment considering these assumptions.
Margin of Safety and Operating Leverage
Sensitivity Analysis and Scenario Planning
Break-even analysis can be enhanced with sensitivity analysis by evaluating how changes in key variables affect the break-even point. Variables include:
Scenario planning involves testing best-case, worst-case, and most-likely situations to understand financial impacts under uncertainty. This approach helps managers prepare for risks and make contingency plans.
Break-Even Analysis in Decision Making
Break-even analysis supports a range of business decisions by providing financial clarity and strategic guidance:
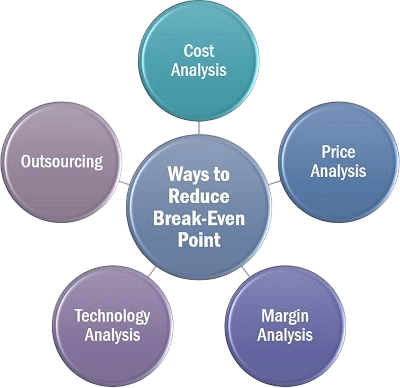
By quantifying financial thresholds, break-even analysis provides a data-driven basis for strategic choices.
Conclusion
Break-even analysis remains a powerful, straightforward tool for understanding the minimum performance required to avoid losses. Its ability to dissect costs and revenue relationships equips managers with actionable insights for pricing, budgeting, and financial planning. While it has limitations rooted in assumptions of linearity and constancy, when combined with other financial techniques, break-even analysis enables sound decision-making in diverse business contexts. With applications ranging from startups to multi-product enterprises, it continues to be a cornerstone in managerial finance and strategic management.