Power BI Training in Coimbatore | Best Power BI Certification Course
Home » Bi & Data Warehousing Courses Tamil Nadu » Power BI Training in Coimbatore

Power BI Training in Coimbatore

5988 Ratings

Live Instructor LED Online Training

Learn from Certified Experts

  • Suitable for Beginners and Experts.
  • Get Certified Upon Completion of the Course.
  • Delivered by 12+ Years of Power BI Certified Expert.
  • Access to Trendy Projects and Advanced Research Resources.
  • Delivered by Qualified Experts, 11402+ Students Trained, and 320+ Employing Clients.
  • Next Power BI Batch to Begin This Week – Enroll Your Name Now!

Fee INR 18000

INR 14000

Training

  • Case Studies and Projects 15+

  • Hours of Training 80+

  • Placement Assurance 100%

  • Expert Support 24/7

  • Support & Access Lifetime

  • Certification Yes

  • Skill Level All

  • Language All

Power BI Course: From Data Analysis to Dynamic Visualizations

  • The Power BI course is designed to provide individuals with the knowledge and skills to effectively analyze and visualize data.
  • The instructors have experienced Power BI experts who guide participants through step-by-step tutorials, demonstrations.
  • This course provides a solid foundation in data analysis and visualization, empowering individuals to make data-driven decisions.
  • Through the course, participants will learn how to connect to various data sources, transform and model data, create interactive dashboards.
  • Participants will gain hands-on experience by working on real-world data sets and projects, allowing them to apply their learning to practical scenarios.
  • The course covers key topics such as data preparation, data modeling, DAX formulas, data visualization best practices, and sharing and collaboration in Power BI.
  • Upon completion of the course, participants will receive a certificate, showcasing their proficiency in Power BI and enhancing their career prospects in data analysis, and data visualization.
  • Classroom Batch Training
  • One To One Training
  • Online Training
  • Customized Training
  • Enroll Now

Talk to us

we are happy to help you 24/7

Other Categories Placements
  • Non-IT to IT (Career Transition) 2371+
  • Diploma Candidates3001+
  • Non-Engineering Students (Arts & Science)3419+
  • Engineering Students3571+
  • CTC Greater than 5 LPA4542+
  • Academic Percentage Less than 60%5583+
  • Career Break / Gap Students2588+
09-Dec-2024
Mon-Fri

Weekdays Regular

08:00 AM & 10:00 AM Batches

(Class 1Hr - 1:30Hrs) / Per Session

04-Dec-2024
Mon-Fri

Weekdays Regular

08:00 AM & 10:00 AM Batches

(Class 1Hr - 1:30Hrs) / Per Session

07-Dec-2024
Sat,Sun

Weekend Regular

(10:00 AM - 01:30 PM)

(Class 3hr - 3:30Hrs) / Per Session

08-Dec-2024
Sat,Sun

Weekend Fasttrack

(09:00 AM - 02:00 PM)

(Class 4:30Hr - 5:00Hrs) / Per Session

    Hear it from our Graduate

    Course Objectives

    • Data Analysts
    • Business Intelligence Professionals
    • Data Scientists
    • Data Managers

    Power BI courses typically combine theoretical concepts with hands-on exercises. Participants learn through lectures, demonstrations, and guided practice sessions, where they work on real-world data sets and projects.

    • Data Visualization
    • Data Modeling
    • Data Transformation
    • Data Analysis
    • Data Integration
    • Power BI Desktop

    Yes, the Power BI course typically includes hands-on exercises and projects where you can apply the concepts and techniques learned. These practical activities help reinforce your understanding and build real-world data analysis skills.

    Most Power BI courses are designed for beginners, requiring no prior experience with Power BI. However, a basic understanding of data analysis concepts and familiarity with Microsoft Excel can be helpful.

    • Advanced Data Visualization Skills
    • Business Intelligence Proficiency
    • Data Analysis and Reporting
    • Data-Driven Decision-Making
    • Career Opportunities
    • Cross-Functional Collaboration

    The duration of a Power BI course can vary depending on the specific program. It can range from a few days for an intensive boot camp to several weeks for a comprehensive course with in-depth coverage.

    Is there a prerequisite for taking the Power BI course?

    • Basic Computer Skills
    • Understanding of Data Concepts
    • Basic Knowledge of Excel
    • A Desire to Work with Data and Visualizations

    What are the career prospects after completing the Power BI course?

    Completing the Power BI course can enhance your career prospects in fields such as

    • Business Intelligence
    • Data Analysis
    • Data Visualization,
    • Data Reporting

    What topics are covered in the Power BI course?

    • Transformation
    • Data modeling
    • DAX formulas
    • Data visualization
    • Sharing and collaboration
    • Real-world project work

    Are there any advanced features covered in the course?

    Absolutely! You will explore advanced features of Power BI, such as row-level security, natural language querying, and creating complex data visualizations using custom visuals.

    Show More

    Learn Power BI for Effective Analysis and Visualization

    The Power BI course offers a comprehensive overview of Microsoft Power BI, focusing on data analysis, visualization, and reporting. Participants will learn to connect to diverse data sources, transform and model data, and create interactive visualizations. The course covers topics such as data cleansing, shaping techniques, and best practices for data modeling. Mastery of the Data Analysis Expressions (DAX) language is a key component, enabling participants to create powerful calculations and measures. Through learn Power BI hands-on exercises and real-world examples, participants will gain practical skills to analyze data effectively. The course is suitable for beginners and experienced professionals seeking to enhance their data analytics capabilities using Power BI.

    Additional Info

    The Future Benefits of Power Bi Course

    The future benefits of completing a Power BI course are significant:

    • Enhanced Career Prospects: Power BI skills are in high demand across industries, and having expertise in data analysis, visualization, and reporting can greatly improve your career prospects. Employers value individuals who can make data-driven decisions and communicate insights effectively.
    • Data-Driven Decision Making: Power BI empowers you to transform raw data into actionable insights. With the knowledge gained from the course, you'll be able to analyze complex data sets, identify trends, and make informed decisions that can drive business growth and success.
    • Improved Data Visualization: The course equips you with best practices for data visualization, enabling you to create compelling and interactive dashboards and reports. Effective data visualization is crucial for communicating insights clearly and engaging stakeholders.
    • Efficiency and Productivity: Power BI allows for efficient data analysis and reporting by automating repetitive tasks and providing intuitive tools. By completing the course, you'll learn to leverage Power BI's features to streamline workflows, save time, and increase productivity.
    • Collaboration and Sharing: Power BI facilitates collaboration by enabling teams to work on data analysis projects together. You'll learn how to share reports and dashboards securely, collaborate with colleagues, and foster a data-driven culture within your organization.
    • Stay Ahead in the Digital Age: In the era of digital transformation, data literacy is becoming increasingly important. By mastering Power BI, you'll stay ahead of the curve and be equipped with the skills necessary to thrive in the data-driven world.
    • Continuous Learning and Growth: Power BI is a dynamic tool that evolves over time. By completing the course, you'll establish a solid foundation and gain the confidence to explore advanced features and keep up with the latest updates and developments in Power BI.
    • Game Development: Java is employed for game development, primarily through frameworks like LibGDX and JavaFX. It offers graphical capabilities, input handling, and game logic implementation.
    • Overall, the future benefits of a Power BI course include increased job opportunities, better decision-making abilities, improved data visualization skills, enhanced productivity, and the ability to adapt to the ever-changing data landscape. Big Data Analytics

    The Reasons to Learn Power BI

    There are several compelling reasons why learning Power BI can be beneficial:

    • Data Analysis and Visualization: Power BI enables you to analyze and visualize data from various sources, helping you uncover insights and patterns that can drive informed decision-making. By learning Power BI, you can gain valuable skills in data analysis and effectively present data through interactive visualizations.
    • Business Intelligence Skills: Power BI is widely used in the field of business intelligence. Learning Power BI equips you with in-demand skills that are sought after by organizations looking to leverage data for strategic decision-making. Having these skills can enhance your career prospects in roles related to data analysis, business intelligence, and reporting.
    • User-Friendly Interface: Power BI offers an easy-to-use interface with drag-and-drop capabilities, making it suitable for both technical and non-technical users. You don't need extensive coding knowledge to create powerful visualizations and reports, which makes it easier for individuals from diverse backgrounds to learn and use Power BI effectively.
    • Integration with Microsoft Ecosystem: Power BI seamlessly integrates with other Microsoft tools and services, such as Excel, Azure, and SharePoint. This integration allows you to leverage existing data sources and workflows, making Power BI a valuable addition to your existing Microsoft toolkit.
    • Collaboration and Sharing: Power BI facilitates collaboration and sharing of reports and dashboards within teams and organizations. Learning Power BI enables you to collaborate on data analysis projects, share insights with stakeholders, and create a data-driven culture within your organization.
    • Continuous Development and Updates: Microsoft consistently introduces new features and updates to Power BI, expanding its capabilities and improving user experience. By learning Power BI, you can stay abreast of the latest developments in the platform and continuously enhance your data analytics skills.
    • Community Support and Resources: Power BI has a vibrant and active community of users and experts who share their knowledge, tips, and resources. You can access online forums, blogs, and communities to seek help, learn new techniques, and stay connected with the Power BI community.
    • Rapidly Growing Market Demand: With the increasing emphasis on data-driven decision-making, the demand for professionals skilled in data analysis and visualization tools like Power BI is rapidly growing. By learning Power BI, you position yourself for diverse job opportunities and increased employability in a data-centric world.

    Power BI Trends and Techniques

    Power BI, being a dynamic and evolving platform, has several trends and techniques that are shaping the way data is analyzed and visualized. Here are some notable trends and techniques in the Power BI domain

    • Natural Language Query and AI-driven Insights: Power BI is incorporating natural language query capabilities, allowing users to ask questions in plain language and receive relevant visualizations as responses. AI-driven insights provide automated recommendations and pattern identification for enhanced data exploration.
    • Augmented Analytics: Power BI is embracing augmented analytics, which leverages machine learning algorithms to automatically discover insights, detect anomalies, and suggest relevant visualizations, enabling users to make data-driven decisions more efficiently.
    • Mobile Reporting and Responsive Design: With the increasing usage of mobile devices, Power BI emphasizes responsive design for reports and dashboards to provide an optimal viewing experience across different screen sizes. Mobile-specific features, such as mobile-optimized visuals and gestures, enable users to access and interact with data on the go.
    • Advanced Analytics Integration: Power BI integrates seamlessly with various advanced analytics tools, such as Azure Machine Learning, Python, and R. This allows users to perform advanced data analysis, predictive modeling, and statistical analysis directly within Power BI, expanding the range of analytical capabilities.
    • Custom Visualizations and AppSource Marketplace: Power BI supports custom visualizations created by the community, enabling users to access a wide array of specialized visuals beyond the default options. The AppSource marketplace offers a rich ecosystem of pre-built custom visuals and templates, enabling users to extend Power BI's functionality and enhance data visualization.
    • Dataflows and Data Preparation: Power BI Dataflows allow users to create and manage reusable data preparation processes, including data extraction, transformation, and loading (ETL). This promotes data consistency, reduces duplication of efforts, and simplifies data governance within Power BI solutions.
    • AI-powered Data Modeling: Power BI incorporates AI-powered data profiling and modeling techniques to assist users in automatically identifying and creating relationships between tables, generating initial data models, and suggesting appropriate data types for columns, streamlining the data modeling process.
    • Collaboration and Sharing: Power BI emphasizes collaboration and sharing features, enabling users to collaborate on reports and dashboards in real-time, co-author content, and distribute insights securely across teams and stakeholders. Integration with Microsoft Teams facilitates seamless collaboration within a familiar environment.

    Power BI Roles and Responsibilities

    • Power BI Developer:
    • Designing and developing data models and data transformations in Power BI.
    • Power BI Desktop is used to produce interactive dashboards and reports.
    • Implementing DAX calculations and measures for advanced data analysis.
    • Collaborating with stakeholders to understand requirements and deliver effective visualizations.
    • Ensuring data accuracy, quality, and integrity within Power BI solutions.
    • Troubleshooting and resolving issues related to Power BI implementations.
    • Business Intelligence Analyst:
    • Gathering and analyzing business requirements to identify data analytics needs.
    • Creating data models and visualizations to support business decision-making.
    • Conducting data exploration and analysis to identify trends and patterns.
    • Creating reports and dashboards with actionable insights.
    • Working with cross-functional teams to identify and answer business needs.
    • Monitoring data quality and ensuring data governance within Power BI solutions.
    • Data Analyst:
    • Extracting, transforming, and loading data from various sources into Power BI.
    • Performing data cleaning, profiling, and validation to ensure data accuracy.
    • Designing and developing data models to support analytical requirements.
    • Creating interactive visualizations and reports for data analysis and reporting.
    • Conducting ad-hoc data analysis and presenting findings to stakeholders.
    • Collaborating with teams to provide data-driven recommendations and insights.
    • Power BI Consultant:
    • Consulting with clients to understand their business objectives and data requirements.
    • Designing and implementing end-to-end Power BI solutions based on client needs.
    • Developing data models, transformations, and visualizations to meet client specifications.
    • Conducting training and workshops to educate clients on Power BI best practices.
    • Providing technical guidance and support during Power BI implementation projects.
    • Monitoring and optimizing Power BI solutions for performance and scalability.
    • Data Visualization Specialist:
    • Designing and creating visually appealing and effective dashboards and reports.
    • Applying best practices for data visualization, including chart selection and layout design.
    • Enhancing user experience through interactive features and drill-down capabilities.
    • Collaborating with stakeholders to understand their reporting requirements.
    • Conducting usability testing and gathering user feedback for iterative improvements.
    Show More

    Key Features

    ACTE Coimbatore offers Power BI Training in more than 27+ branches with expert trainers. Here are the key features,

    • 40 Hours Course Duration
    • 100% Job Oriented Training
    • Industry Expert Faculties
    • Free Demo Class Available
    • Completed 500+ Batches
    • Certification Guidance

    Authorized Partners

    ACTE TRAINING INSTITUTE PVT LTD is the unique Authorised Oracle Partner, Authorised Microsoft Partner, Authorised Pearson Vue Exam Center, Authorised PSI Exam Center, Authorised Partner Of AWS .


    Curriculum

    Syllabus of Power BI Training in Coimbatore
    Module 1: Introduction to Power Bi
    • Introduction to Business Intelligence (BI)
    • Stages of business intelligence (BI)
    • Use cases of BI
    • Various BI tools
    • Overview of Data warehouse & concepts
    • Introduction to Power BI
    • Why Power BI
    • Power BI Components
    • Power BI pricing structure
    • Building blocks of Power BI
    • Architecture of Power BI
    • Power BI vs Tableau vs QlikView
    • Introduction of Power BI Desktop
    • Installation of Power BI Desktop
    • The key features of Power BI workflow
    • Process of creating reports in Power BI
    Module 2: Data Extraction
    • Overview of Power BI desktop
    • Data sources in Power BI
    • Using files (excel, pdf, csv, etc.) as a data source
    • Using SaaS connectors
    • Extracting data from folders, and databases
    • Working with Azure SQL database and database sources
    • Connecting to Analysis Services
    • Other data sources (OData, web, SharePoint etc.)
    • Python & R script in Power BI
    • Introduction of power query editor
    • Advance editor
    • Query dependency editor
    Module 3: Data Transformation – Shaping & Combining Data
    • Shaping data using Power Query Editor
    • Formatting data
    • Transformation of data
    • Understanding of Data types
    • Data profiling for data quality check
    • Naming conventions & best practices to consider
    • Identify and create appropriate keys for joins
    • Working with Parameters
    • Merge Query
    • Append Query
    • Group by of data (aggregation of data)
    • Applied steps (query settings)
    • Duplicate & Reference tables
    • Transpose of data
    • Fill
    • Pivot & Un-pivot of data
    • Custom columns
    • Conditional columns
    • Replace data from the tables
    • Split columns values
    • Move columns & sorting of data
    • Detect data type, count rows & reverse rows
    • Promote rows as column headers
    • Hierarchies in Power BI
    • M query
    Module 4: Data Modelling & Dax
    • Introduction of relationships
    • Creating relationships
    • Cardinality
    • Cross filter direction
    • Use of inactive relationships
    • Introduction of DAX
    • Why DAX is used
    • DAX syntax
    • DAX functions
    • Context in DAX
    • Calculated columns using DAX
    • Measures using DAX
    • Calculated tables using DAX
    • Learning about table, information, logical, text, iterator
    • Time intelligence functions (YTD, QTD, MTD)
    • Cumulative values, calculated tables, and ranking and rank over groups
    • Date and time functions
    • identify poorly performing measures, relationships, and visuals
    • DAX advanced features
    Module 5: Data Visualization With Analytics
    • Deep dive into Power BI data visualization
    • Understanding Power View and Power Map
    • Data visualization techniques
    • Page layout & Formatting
    • Power BI Desktop visualization
    • Formatting and customizing visuals
    • Visualization interaction
    • Custom visualization in Power BI
    • Top-down and bottom-up analytics
    • Drill down
    • Drill through
    • Page navigations
    • Bookmarks
    • Selection pane to show/hide visuals
    • omparing volume and value-based analytics
    Module 6: Power Bi Service (Cloud), Q & A and Data Insights
    • Introduction to Power BI Service
    • Introduction of workspaces
    • Dashboard
    • Creating & Configuring Dashboards
    • Dashboard theme
    • Reports vs Dashboards
    • Building workspace Apps
    • Sharing reports & dashboards
    • configure subscriptions and data alerts
    • Paginated report
    • Introduction to Power Q & A
    • Ask questions about your data using Natural Query Language
    • Getting answers in the form of charts, graphs, and data discovery methodologies
    • Configure custom questions for Q&A like FAQ
    • Ad-hoc analytics building
    • Power Q&A best practices
    • Quick Ins
    • Subscribe, Alerts, Usage statics, Related content
    • Design reports on Power BI Service
    • Collaboration using Power BI Service
    Module 7: Power Bi Settings, Administration & Direct Connectivity
    • Getting to understand Power BI Desktop settings
    • Aggregating data from multiple data sources
    • Power BI Service settings
    • Power BI Admin Portal
    • Administration activities
    • Power BI usage analysis
    • Introduction of Office 365 admin activities
    • Introduction of Data Gateway
    • Installation & Configuration of data gateways
    • Scheduling auto data refresh
    • Managing groups, row-level security, datasets, reports, and dashboards
    • Real time data analysis using Direct Connectivity
    • Direct Query vs Import Mode
    Module 8: Embedded Power Bi With API & Power Bi Mobile
    • Introduction to embedded Power BI
    • Create embedded code
    • Manage embedded code
    • Integration of Power BI in SharePoint
    • Introduction of Power BI API
    • Power BI Embedded playground
    • Introduction to Power BI Mobile
    • Creating mobile based reports & dashboards
    • Optimizing report for Power BI mobile app
    • Features of Power BI mobile app
    • Introduction of integrating Power BI & Excel
    • Power BI Analyze in Excel
    Module 9: Power Bi Advance & Power Bi Premium
    • Introduction of Power BI Premium
    • Power BI Premium per user
    • Power BI Premium features
    • Introduction to Data Flow
    • Create Data Flow
    • Advantages of Data Flow
    • Create reports using Data Flow
    • Introduction to Power BI Deployment Pipelines
    • Create Deployment Pipelines
    • Benefits of Deployment Pipelines
    • Introduction of Sensitivity Labels
    • Introduction of Power BI Goals feature
    • Incremental data load in Power BI
    • use AI visuals
    • use the Forecast feature
    • Power BI best practice rules to improve performance
    Show More
    Show Less
    Need customized curriculum?

    Hands-on Real Time Power BI Projects

    Complete Power BI Training and Placement

    The Power BI Training and Placement program provides in-depth Power BI training, With our strong placement assistance, we connect you with potential employers, maximizing your chances of securing a rewarding position in the field.

    • Learn from experienced instructors who are industry experts and certified in Power BI, ensuring you receive top-quality training and guidance throughout the program.
    • Our Power BI training program covers all essential aspects of data analysis, visualization, and reporting, providing you with a solid foundation and advanced skills in Power BI.
    • You'll gain practical experience through real-world projects and interactive exercises, allowing you to apply your knowledge to solve data analysis challenges.
    • Our dedicated placement team provides support in resume building, interview preparation, and connecting you with potential employers, increasing your chances of securing job opportunities.
    • We collaborate with leading organizations to offer internship opportunities, giving you hands-on experience and exposure to real-world Power BI projects
    • Join our thriving community of Power BI professionals and gain access to networking events, job updates, and continuous learning opportunities to support your career growth even after completing the training program.

    Power BI Certification: Validating Expertise for Data Professionals

    Power BI certification provides professionals with a recognized credential that validates their skills and proficiency in utilizing the Power BI platform. It demonstrates a commitment to continuous learning and mastery of data analysis, visualization, and reporting techniques. Achieving a certification not only enhances your credibility but also opens up a world of career opportunities. Employers often prioritize candidates with certified Power BI skills, recognizing the value they bring in effectively analyzing complex data and delivering actionable insights.

    • Microsoft Certified: Data Analyst Associate
    • Microsoft Certified: Power BI Certified Expert
    • Microsoft Certified: Power Platform App Maker Associate

    Power BI certification offers several benefits. It enhances your credibility as a data professional, increases your job prospects, and validates your skills in a rapidly growing field.

    • Validation of Skills
    • Credibility and Trust
    • Career Advancement
    • Increased Job Opportunities
    • Enhanced Earning Potential
    • Industry Recognition

    Power BI certification can significantly benefit your career by boosting your professional credibility, increasing your job prospects, and making you stand out among other candidates. It validates your expertise in a widely used business intelligence tool, enabling you to contribute to data-driven decision-making and take on more challenging roles within organizations.

    To prepare for Power BI certification exams, you can follow several steps. Start by reviewing the exam objectives and studying relevant learning resources, such as official Microsoft documentation, practice tests, and hands-on experience with Power BI.

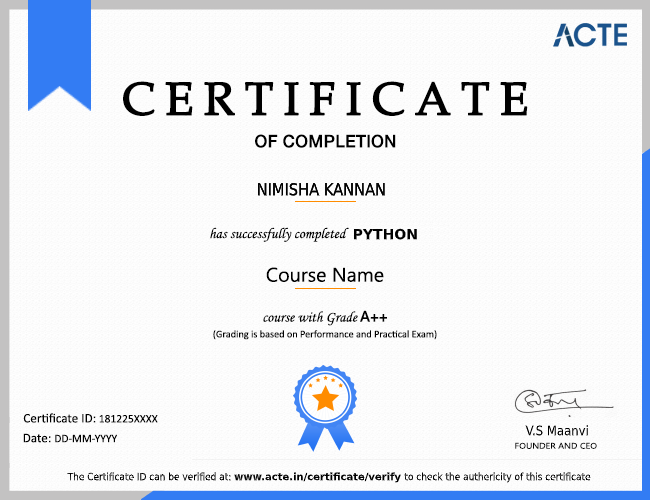
    Complete Your Course

    a downloadable Certificate in PDF format, immediately available to you when you complete your Course

    Get Certified

    a physical version of your officially branded and security-marked Certificate.

    Get Certified

    Power BI Trainers Sparking Data Excellence

    • Power BI trainers are expert guides, equipped with in-depth knowledge and extensive experience in leveraging Power BI for effective data analysis.
    • Skilled at conveying complex concepts in a clear and understandable manner, Our trainers excel at breaking down technical jargon and ensuring learners grasp the fundamentals with ease.
    • Recognizing the unique needs of each learner, Our trainers tailor their instruction to provide personalized learning experiences that align with specific goals and industry requirements.
    • They bring real-world practical expertise to the table, allowing learners to gain hands-on experience and develop the skills necessary to tackle data challenges confidently.
    • Committed to staying up-to-date with the latest Power BI advancements, trainers constantly update their knowledge base, ensuring their training is always relevant and aligned with industry trends.
    • The Power BI Training in Coimbatore trainers provide continuous support and guidance, acting as mentors to help learners apply their knowledge effectively and overcome any obstacles they may encounter.

    Power BI Course FAQs

    Who are the instructors for the course, and how are they selected?

    At ACTE, instructors have a minimum of 10–12 years of experience in relevant IT areas. As they work in live corporate environments, the training is updated based on real industry knowledge. From this training, instructors will be selected based on expertise, teaching, and hands-on experience to provide enough quality and practical training in accordance with industry standards.
    Yes, ACTE has practice tests to help the learner learn and retain Power BI knowledge. Practice tests are excellent tools for assessing progress and preparing learners for real-life applications.
    • ACTE is a legend in offering placement to students. Please visit our Placed Student list on our website.
    • We have solid working relationships with more than 700+ of the world's leading multinational corporations, including SAP, Oracle, Amazon, HCL, Wipro, Dell, Accenture, Google, ZOHO, TCS, IBM, and more.
    • More than 3500+ students placed last year in India & Globally. Our Placement Cell supports you till you get placed in a better MNC.
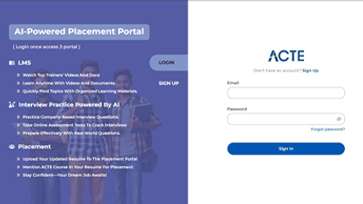
    • Please Visit Your Student Portal. Here, the FREE Lifetime Online Student Portal helps you to access Job Openings, Study Materials, Videos, Recorded sections, & Top MNC Interview Questions.
    Yes, we offer job assistance upon course completion
    • Practical Experience
    • Hands-On Projects
    • Resume Preparation
    • Aptitude and Technical Skills
    • Mock Interviews
    • Group Discussions
    To enroll in ACTE's Power BI course, visit their website, navigate to the course page, and click Enroll Now. Fill out the form, choose your preferred batch timing, and start your Power BI journey today!
    The ACTE Power BI Master Program is aimed at enabling students with immersive learning in the field of Power BI, particularly in data visualization, modelling, and business analytics. Come and acquire practical hands-on skills in designing dashboards, reports, and actionable insights using Power BI tools. Work on real-world projects, demonstrating how to transform data into valuable business intelligence-preparing you to excel in a successful career in data analysis and analytics.
    The ACTE certification is proof of mastery and knowledge in particular fields, thus offering more opportunities for a better career. However, its worth might differ according to employers' preferences, industry, and whether it addresses the requirements concerning a particular job role.
    • Basic Understanding of Data Analysis
    • Familiarity with Microsoft Excel
    • Knowledge of Databases and understanding of Data Visualization Concepts
    • Analytical and Problem-Solving Skills
    Yes, Most of our training programs work on actual projects. Hands-on experience will ensure the participant gains practical skills whilst comprehending and understanding real-life scenarios, making it highly employable and more than well-prepared for professional assignments.
    Recorded classes are also available in case you can't attend a class at ACTE or you work on a schedule with a make-up lesson. We also allow you to catch up on any content you may have missed using our resources and training materials.
    Our Power BI course is flexible and designed to suit your schedule. It includes one-on-one lessons, fast-track classes, customized courses, and online learning.
    Enroll in ACTE's Power BI training to benefit from a comprehensive curriculum, expert instructors, industry-relevant training, real-world projects, certification, job placement support, and a collaborative learning environment that will set you up for success in the field.
    Absolutely! The Power BI course provides lots of hands-on practice, real-world projects, and group discussions. It also features mock interviews and group activities to help participants hone their skills and improve their readiness for the job market. The participant learns to overcome technical challenges so that being productive in a collaborative and team-oriented environment is possible.
    Yes, we give students lifetime access to the study materials, videos, and top MNC interview questions on the Student’s Portal.
    We offer recorded video lessons for the training. After you complete the payment and enroll in the course, you will gain access to the pre-recorded sessions through our course platform, allowing you to watch them at your own pace.
    The salary for a Power BI professional typically ranges from 5 lakhs to 15 lakhs per year.
    Yes, learning Power BI is easy, especially for people with Excel or data analysis backgrounds. The simple interface and the drag-and-drop functionality used to create interactive reports and dashboards make it easy to use. With numerous online courses, tutorials, and hands-on practice available, you can quickly grasp the concepts and start visualizing data effectively.
    • Data Connectivity
    • Data Visualization and Modeling
    • Data Visualization
    • Data Sharing and Collaboration
    Yes, Power BI is perfect for freshers. With its intuitive and user-friendly interface, you can design reports and visualizations without needing higher technical knowledge. Freshers with basic knowledge of Excel and data analysis can learn Power BI quickly and work on real-time data.
    The best application of Power BI is its ability to source raw data and transform it into very valuable insights through interactive dashboards and reports. It is generally applied in analytics to help organizations evaluate data, track performance, and make the right decisions. Power BI specifically does an excellent job of visually communicating key metrics and trends in reports customized to a business's needs.
    Show More
    Request for Class Room & Online Training Quotation

          Job Opportunities in Power BI

          More Than 35% Of Developers Prefer Power BI. Power BI Is The Most Popular And In-Demand In The Tech World.

          Related Category Courses

          Informatica training acte
          Informatica Training in Chennai

          Beginner & Advanced level Classes. Hands-On Learning in Informatica. Best Read more

          Tableau Software training acte
          Tableau Training in Chennai

          Beginner & Advanced level Classes. Hands-On Learning in Tableau. Best Read more

          cognos training acte
          Cognos Training in Chennai

          Beginner & Advanced level Classes. Hands-On Learning in Cognos. Best Read more

          obiee training acte
          OBIEE Training in Chennai

          Beginner & Advanced level Classes. Hands-On Learning in OBIEE. Best Read more

          hadoop training acte
          Hadoop Training in Chennai

          Beginner & Advanced level Classes. Hands-On Learning in Hadoop. Best Read more

          java-acte
          SAS Training in Chennai

          Beginner & Advanced level Classes. Hands-On Learning in SAS. Best Read more

          web designing training acte
          Web Designing Training in Chennai

          Live Instructor LED Online Training Learn from Certified Experts Beginner Read more