
Last updated on 17th Aug 2020| 6085
This comprehensive blog covers essential R interview questions that can provide a significant advantage in the growing analytics market. As enterprises, both global and local, seek professionals with certified expertise in R, mastering these questions can set you apart. R, a versatile programming language, serves various purposes including statistical analysis, data visualization, manipulation, predictive modeling, and forecast analysis. Widely adopted by major companies like Google, Facebook, and Twitter, R proves to be a valuable tool empowering professionals in diverse analytical domains.
1. How does R support parallel processing, and why is it beneficial?
Ans:
R supports parallel processing through packages like ‘parallel’ and ‘foreach’, allowing for the concurrent execution of code on multiple processors or cores. This is beneficial for improving performance and efficiency, especially when dealing with computationally intensive tasks or large datasets. Parallel processing can significantly reduce the time required for tasks like bootstrapping, cross-validation, and simulations by distributing the workload across multiple processors.
2. Explain the concept of lazy evaluation in R.
Ans:
- Lazy evaluation in R refers to the delayed execution of expressions until their results are explicitly needed. This feature enhances efficiency by avoiding unnecessary computations.
- For example, when working with large datasets, functions like ‘dplyr’ use lazy evaluation to postpone the actual execution of operations until the final result is required. This minimizes memory usage and accelerates the performance of data manipulation tasks in R.
3. What is R, and how does data science make use of it?
Ans:
R is a programming language and environment intended for use in graphics and statistical computing. In data science, it is frequently utilized for statistical modeling, data processing, and visualization. R is a favored option for statisticians and data scientists because of its extensive ecosystem of packages and libraries for a wide range of data-related tasks.
4. Describe the distinction between R’s vectors and lists.
Ans:
In R, lists and vectors are both data structures, but their homogeneity is what really sets them apart. Lists are heterogeneous and can store a variety of data types, whereas vectors are homogeneous and can only contain items of the same data type. Vectors are better suited for operations involving numbers, while lists offer versatility in managing various data types within a single structure.
5. What is the significance of the ‘data.frame’ in R?
Ans:
The ‘data.frame’ is a fundamental data structure in R, resembling a table or spreadsheet. It organizes data into rows and columns, allowing for efficient storage and manipulation. It is widely used in data analysis as it supports both numerical and categorical data, making it suitable for diverse datasets. Functions like ‘merge’ and ‘subset’ make it a powerful tool for data manipulation.
6. How does recycling work in R?
Ans:
- Recycling in R refers to the automatic replication of shorter vectors to match the length of longer vectors during operations.
- This feature enables concise code, as you can perform element-wise operations on vectors of different lengths.
- For example, adding a scalar to a vector results in the scalar being recycled to match the length of the vector, simplifying the syntax and promoting vectorized operations.
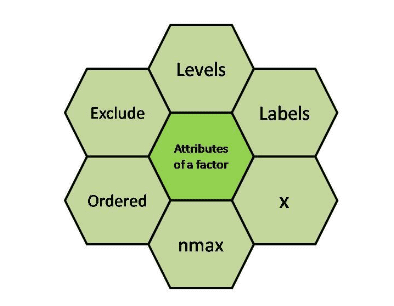
7. Explain the concept of factors in R.
Ans:
Factors are used to represent categorical data in R. They are a type of vector that assigns labels or levels to distinct categories within a variable. This helps in efficient storage and analysis of categorical data, ensuring that statistical models treat categories appropriately. Functions like ‘factor’ and ‘levels’ are employed to manipulate and explore factors in R.
8. What is the purpose of the ‘apply’ family of functions in R?
Ans:
The ‘apply’ family, including functions like ‘apply’, ‘lapply’, ‘sapply’, and ‘tapply’, is designed for applying a function to the rows or columns of matrices, data frames, or lists. They lessen the need for explicit loops and improve the readability of the code. For instance, ‘apply’ can be used to apply a function to each row or column of a matrix, simplifying complex operations and improving code efficiency.
9. Explain the concept of closure in R programming.
Ans:
- A closure in R refers to a function object that has access to variables in its lexical scope, even after the scope has finished execution.
- This allows for the creation of functions with encapsulated states, promoting modularity and flexibility.
- Closures are created when a function is defined inside another function, capturing the environment in which they are defined. This feature is particularly useful for creating flexible and reusable functions in R.
10. How does garbage collection work in R?
Ans:
R uses automatic garbage collection to manage memory. The garbage collector identifies and reclaims memory occupied by objects that are no longer accessible or in use. This helps in preventing memory leaks and maintaining system efficiency. The ‘gc()’ function can be manually invoked to initiate garbage collection, but R typically handles this process automatically to ensure optimal memory management during the execution of scripts or functions.
11. What is the purpose of the ‘dplyr’ package in R?
Ans:
- The ‘dplyr’ package is a part of the ‘tidyverse’ and is widely used for data manipulation tasks in R. It provides a set of functions like ‘filter’, ‘select’, ‘mutate’, ‘arrange’, and ‘summarize’ that simplify and streamline data wrangling.
- With a consistent syntax, ‘dplyr’ enhances code readability and promotes efficient data manipulation, making it a popular choice among data scientists for tasks like filtering, sorting, and summarizing data.
12. How does R handle missing values, and what functions are commonly used for handling them?
Ans:
R represents missing values as ‘NA.’ Various functions such as ‘is.na()’, ‘na.omit()’, and ‘complete.cases()’ are commonly used to identify, remove, or replace missing values in data. ‘is.na()’ checks for missing values, ‘na.omit()’ removes rows with missing values, and ‘complete.cases()’ identifies complete cases in a data frame. Proper handling of missing values is crucial for accurate analysis and modeling in R.
13. Explain the concept of method dispatch in R.
Ans:
Method dispatch in R refers to the process of selecting the appropriate function or method to execute based on the class or type of the object passed as an argument. This dynamic dispatch allows for generic programming and is a key feature of object-oriented programming in R. The ‘generic’ function determines the method to call based on the class of the object, enabling extensibility and flexibility in designing R packages and classes.
14. What are the advantages of using the ‘ggplot2’ package for data visualization in R?
Ans:
- ‘ggplot2’ is a powerful data visualization package in R that follows the Grammar of Graphics principles. It offers a high-level and flexible syntax for creating complex and aesthetically pleasing plots.
- The layered approach of ‘ggplot2’ allows for easy customization of plots, making it a preferred choice for data scientists. Its ability to handle large datasets and produce publication-quality graphics makes it a versatile tool for exploratory data analysis and communication of results.
15. What are the advantages of using the ‘ggplot2’ package for data visualization in R?
Ans:
- ‘ggplot2’ is a powerful data visualization package in R that follows the Grammar of Graphics principles. It offers a high-level and flexible syntax for creating complex and aesthetically pleasing plots.
- The layered approach of ‘ggplot2’ allows for easy customization of plots, making it a preferred choice for data scientists. Its ability to handle large datasets and produce publication-quality graphics makes it a versatile tool for exploratory data analysis and communication of results.
16. Explain the difference between vectors and lists in R.
Ans:
| Vectors | Lists |
|---|---|
| Homogeneous (elements of the same data type) | Heterogeneous (elements can be of different data types) |
| Created using c() function or : operator | Created using list() function |
| Accessed by numeric indices (e.g., vec[1]) | Accessed by numeric indices or names (e.g., my_list[[1]] or my_list$name) |
17. For what reason does the R package reshape2′ exist?
Ans:
Data can be transformed and reshaped using the R Reshape2′ package. It offers functions such as’ melt’ and ‘dcast’ that simplify the conversion of data between long and wide formats, hence simplifying the handling and analysis of datasets.
18. Describe the idea of a R closure.
Ans:
- In the R programming language, a closure is a function object that holds the function code and the environment in which it was written.
- This enables the function to access variables from its lexical scope even after the execution of that scope has ended.
- Closures are an effective tool for designing modular and adaptable functions.
19. How does R handle exceptions and what functions are used for error handling?
Ans:
R uses the ‘tryCatch’ function for exception handling. It allows the execution of code within a ‘try’ block and specifies actions to be taken in case of an error (‘catch’ block). ‘stop’ and ‘warning’ functions can be used to generate errors or warnings within the ‘tryCatch’ block.
20. Explain the concept of lazy loading in R.
Ans:
Lazy loading is a feature in R where the objects in a package are not loaded into memory until they are explicitly needed. This optimizes memory usage, especially in large packages, by loading only the functions or data objects that are required during the session.

Join R Programming Course with Global Recognised Certification
Weekday / Weekend BatchesSee Batch Details21. What are closures and lexical scoping in R?
Ans:
Closures in R are functions bundled with their lexical environment, allowing them to access variables from the environment in which they were created. Lexical scoping means that the scope of a variable is determined by the code structure, promoting modular and encapsulated programming.
22. How does R handle missing values in statistical functions?
Ans:
Many statistical functions in R have an argument named ‘na.rm’ which, if set to ‘TRUE’, excludes missing values from calculations. This allows users to perform statistical operations without being hindered by missing data.
23. Why is the ‘lubridate’ package in R needed?
Ans:
- R users can work with date-time data by using the ‘lubridate’ package.
- It streamlines operations pertaining to date-time object formatting, manipulation, and parsing.
- It’s simple to handle dates in different formats with functions like ‘ymd’ and ‘mdy’.
24. How is the idea of namespaces handled in R?
Ans:
To arrange and control object names in R, namespaces are used. A popular method for establishing namespaces and avoiding naming conflicts between functions and objects is the usage of packages. Working with various packages is ensured by this neat and modular framework.
25. What does the ‘mutate’ function in ‘dplyr’ mean?
Ans:
In a data frame, new variables can be added or existing ones can be changed using the ‘mutate’ function in ‘dplyr’. It’s a potent tool for feature engineering and data manipulation because it lets you apply transformations and calculations to columns.
26. Why is the ‘Rcpp’ package in R used?
Ans:
- Performance for computationally demanding activities can be improved by integrating C++ code into R using ‘Rcpp’.
- Combining the simplicity of use of R with the efficiency of C++, it makes authoring and integrating C++ functions into R scripts simpler.
27. How is functional programming supported by R?
Ans:
R provides ‘apply’, ‘lapply’, and ‘sapply’ functions to enable functional programming. Furthermore, the ‘purrr’ package offers a more standardized and functional programming-friendly method for manipulating functions and data structures.
28. What is the function of the R package ‘RODBC’?
Ans:
R can connect to relational databases via ODBC (Open Database Connectivity) drivers thanks to the ‘RODBC’ package. It makes it easier to extract, modify, and analyze data straight from databases in the R environment.
29. Describe how to utilize the ‘group_by’ function in ‘dplyr’.
Ans:
- A grouped data frame is produced by grouping data by one or more variables using the ‘group_by’ function in ‘dplyr’.
- This is necessary in order to execute operations on groups inside the data, like aggregation, summarization, and function application to each group independently.
30. What is the purpose of the ‘stringr’ package in R?
Ans:
- The ‘stringr’ package provides functions for efficient and consistent string manipulation in R.
- It simplifies tasks such as pattern matching, substring extraction, and string manipulation, offering a more intuitive and user-friendly interface compared to base R functions.
31. How does R support parallel computing, and what are the benefits?
Ans:
R supports parallel computing through packages like ‘parallel’ and ‘foreach’. Parallel computing enables the simultaneous execution of code on multiple processors or cores, improving performance for computationally intensive tasks. This is particularly advantageous for tasks like bootstrapping, cross-validation, and simulations.
32. Explain the purpose of the ‘tidyverse’ in R.
Ans:
The ‘tidyverse’ is a collection of R packages, including ‘dplyr’, ‘ggplot2’, ‘tidyr’, and others, designed to work seamlessly together. It promotes a consistent and tidy approach to data manipulation and visualization, enhancing code readability and simplifying the data science workflow.
33. What is the role of the ‘reshape’ package in R?
Ans:
- The ‘reshape’ package in R provides functions for reshaping and restructuring data, similar to ‘reshape2’.
- It allows users to convert between wide and long formats and is particularly useful for handling panel data or datasets with repeated measurements.
34. Explain the use of the ‘RSQLite’ package in R.
Ans:
The ‘RSQLite’ package facilitates the interaction between R and SQLite databases. It provides functions to connect to SQLite databases, query data, and perform data manipulation directly from R, making it a valuable tool for working with lightweight, file-based databases.
35. How does R handle random number generation, and what are the commonly used functions?
Ans:
R provides several functions for random number generation, including ‘runif()’ for generating uniform random numbers, ‘rnorm()’ for normal distributions, and ‘sample()’ for sampling from vectors. Setting a seed with ‘set.seed()’ ensures reproducibility in random processes.
36. What is the purpose of the ‘data.table’ package in R?
Ans:
The ‘data.table’ package in R is designed for fast and efficient data manipulation. It extends the capabilities of data frames, providing high-performance functions for tasks like subsetting, aggregation, and merging large datasets.
37. How does R handle memory management and garbage collection?
Ans:
R uses automatic garbage collection to manage memory. Memory used by out-of-use objects is located and reclaimed by the garbage collector. This helps prevent memory leaks and ensures efficient memory management during script execution.
38. Explain the concept of closures in the context of functional programming.
Ans:
- In functional programming, closures are functions that “close over” variables from their lexical scope, capturing the environment in which they were created.
- This allows functions to retain access to variables even after the enclosing scope has finished execution, promoting encapsulation and modularity.
39. What is the purpose of the ‘rvest’ package in R?
Ans:
The ‘rvest’ package is used for web scraping in R. It provides functions to extract data from HTML web pages, making it useful for tasks such as gathering information from online sources for analysis.
40. Explain the concept of lazy loading in R packages.
Ans:
- Lazy loading in R packages refers to the delayed loading of functions and data until they are explicitly needed.
- This optimizes package loading times and memory usage by loading only the components required during a particular session.

Learn R Programming Skills with R Training & Advance Your Career
- Instructor-led Sessions
- Real-life Case Studies
- Assignments
41. How does R handle time zones in date-time operations?
Ans:
R uses the ‘tz’ argument in date-time functions to handle time zones. The ‘tz’ argument allows users to specify or convert date-time objects to a particular time zone, ensuring consistency and accuracy when working with temporal data across different time zones.
42. Explain the purpose of the ‘Rcpp’ package in R programming.
Ans:
- The ‘Rcpp’ package allows R users to integrate C++ code seamlessly into their R scripts.
- This facilitates the creation of high-performance functions, combining the simplicity of R with the speed of C++ for computationally intensive tasks.
43. What are the advantages of using the ‘glm’ function in R for modeling?
Ans:
The ‘glm’ function in R is used for fitting generalized linear models. It provides a flexible framework for modeling various types of response variables and distributions, making it suitable for a wide range of statistical modeling tasks.
44. How does R handle multithreading, and what are the considerations for parallel processing?
Ans:
- R’s support for multithreading is limited due to its global interpreter lock. However, packages like ‘parallel’ and ‘foreach’ enable parallel processing by utilizing multiple processes or cores.
- Considerations include choosing an appropriate parallel backend and managing data sharing between parallel processes.
45. In what ways does R manage multi-dimensional arrays, and what function does the ‘array’ function serve?
Ans:
The ‘array’ function in R is used to manage multi-dimensional arrays. Users can easily store and manipulate data in a matrix-like structure by creating arrays with various dimensions. To get or set an array’s dimensions, use the ‘dim’ function frequently.
46. What does the R ‘tibble’ package perform, and how is it different from a regular data frame?
Ans:
The R data frame structure can be improved with the ‘tibble’ package. With better printing, subsetting, and data entry, it offers a contemporary and approachable replacement for data frames. “Tibble” avoids some of the idiosyncrasies of data frames while more closely maintaining column kinds.
47. Explain the use of the ‘knitr’ package in R.
Ans:
- The ‘knitr’ package is used for dynamic report generation in R.
- It enables the embedding of R code chunks into documents, allowing users to create reproducible reports that automatically update when the underlying data or code changes.
- ‘knitr’ is commonly used in conjunction with R Markdown.
48. What is the purpose of the ‘lattice’ package in R?
Ans:
The ‘lattice’ package provides a set of functions for producing Trellis graphics in R. Trellis graphics are a type of conditioned plot where data is split into subsets based on one or more conditioning variables, providing a powerful tool for exploring complex relationships in data.
49. How does R handle functional programming, and what are higher-order functions?
Ans:
- R supports functional programming through the use of higher-order functions.
- Higher-order functions return a function as a result or accept one or more functions as inputs.
- Functions like ‘lapply’, ‘sapply’, and ‘Map’ are examples of higher-order functions in R.
50. Explain the purpose of the ‘shinydashboard’ package in R.
Ans:
- The ‘shinydashboard’ package is an extension of ‘shiny’ in R and is used for creating interactive dashboards.
- It provides a framework for building aesthetically appealing and responsive dashboards with features like tabbed layouts, boxes, and interactive controls.
51. In R, what are the benefits of evaluating models with the ‘ROCR’ package?
Ans:
- Performance evaluation and visualization of classification models are accomplished with the ‘ROCR’ software.
- Due to its functions for creating ROC curves, figuring out AUC (Area Under the Curve), and producing other metrics, it is a useful tool for comparing and assessing models.
52. What is the purpose of the ‘factor’ class in R, and how does it handle category data?
Ans:
Using the ‘factor’ class, R manages categorical data. Statistical modeling benefits from the inclusion of factors, which stand in for category variables. In order to facilitate suitable analysis and visualization, the ‘factor’ class makes sure that R is aware of the levels of a categorical variable.
53. What is the aim of the R package ‘slam’?
Ans:
- The sparse and dense matrix algebra in R is handled by the ‘slam’ package. It offers functions for effectively managing matrices with a large number of zero members, known as sparse matrices.
- In jobs involving natural language processing (NLP), where data is frequently represented as sparse matrices, “slam” is very helpful.
54. How is the idea of method dispatch in S3 classes handled by R?
Ans:
The class of the first argument in a function call determines how a method is dispatched in S3 classes. S3 methods allow for extension and flexibility in handling various object types because they are generic functions that respond differently based on the class of the first input.
55. What is the function of the R package ‘rsample’?
Ans:
To split and resample data in R, utilize the ‘rsample’ library. It has tools for building training and testing sets and for performing several resampling techniques, such bootstrapping and cross-validation, which are critical for validating and assessing models.
56. Describe what R’s “memorization” means.
Ans:
- Caching the output of costly function calls to prevent unnecessary computations is known as memorization.
- By saving and reusing previously computed results, the ‘memoise’ package in R offers an easy approach to memoize functions, increasing the efficiency of repetitive calculations.
57. What is the function of the ‘sf’ package and how does R handle spatial data?
Ans:
- R handles geographical data via utilizing packages such as ‘sf’, which offers classes and functions for manipulating spatial data structures.
- Spatial data science tasks require the usage of the ‘sf’ package since it is very helpful for representing and analyzing geometric and geographic objects.
58. What is the function of the R package ‘igraph’?
Ans:
In R, graphs and networks are created and analyzed using the ‘igraph’ package. Its extensive feature set for graph editing, visualization, and analysis makes it an invaluable tool for jobs involving networks.
59. What is the purpose of the ‘ts’ class and how does R handle time series data?
Ans:
Time series data can be represented in R using the ‘ts’ (time series) class. It is useful for temporal pattern-related activities like forecasting and econometric modeling since it offers capabilities for time-based indexing and analysis.
60. What is the ‘R6’ package’s function in R programming?
Ans:
- R6 classes are a new class system introduced in R by the ‘R6’ package.
- R6 classes, which employ reference semantics in contrast to S3 and S4 classes, enable more flexible and object-oriented programming, especially for developing user-friendly APIs and packages.
61. Explain the use of the ‘leaflet’ package in R.
Ans:
The ‘leaflet’ package is used for creating interactive maps in R. It provides a simple and intuitive interface for adding layers, markers, and other map elements, making it popular for visualizing spatial data in an interactive and dynamic manner.
62. How does R handle the concept of lexical scoping in function closures?
Ans:
- Lexical scoping in R ensures that functions retain access to variables from their lexical environment.
- When a function is defined inside another function, it forms a closure, capturing the variables from the outer function.
- This promotes encapsulation and the creation of modular and reusable functions.
63. What is the purpose of the ‘glue’ package in R?
Ans:
The ‘glue’ package is used for string interpolation in R. It provides a straightforward syntax for embedding R expressions within strings, making it easier to create dynamic and formatted strings, particularly in the context of generating informative messages or labels.
64. Explain the role of the ‘svydesign’ function in R’s survey sampling package.
Ans:
- The ‘svydesign’ function is part of the survey sampling package in R.
- It is used to create a survey design object, specifying survey sampling details such as strata, clusters, and sampling weights.
- This object is then used in survey analysis functions for producing unbiased estimates.
65. How does R handle the concept of closure in functional programming?
Ans:
In functional programming, closures in R are functions bundled with their lexical environment. This allows them to capture and retain access to variables from the surrounding scope, promoting modularity and the creation of functions with encapsulated states.
66. Explain the purpose of the ‘gmodels’ package in R.
Ans:
- The ‘gmodels’ package is used for creating contingency tables and conducting various statistical tests related to categorical data.
- It provides functions for cross-tabulation, chi-squared tests, and other analyses useful in exploring relationships between categorical variables.
67. What is the purpose of the ‘caret’ package’s ‘train’ function in R?
Ans:
The ‘train’ function in the ‘caret’ package is used for training predictive models. It streamlines the model training process by providing a unified interface for various machine learning algorithms, allowing users to easily compare and tune models.
68. Explain the role of the ‘RColorBrewer’ package in R.
Ans:
- The ‘RColorBrewer’ package is used for creating color palettes in R. It provides a variety of color schemes suitable for mapping and visualization tasks.
- This package is particularly useful when designing plots and maps that require visually appealing and distinguishable colors.
69. How does R handle large datasets, and what are the considerations for efficient data manipulation?
Ans:
R handles large datasets more efficiently by using packages like ‘data.table’ or ‘dplyr’ with optimized backends. Considerations for efficient data manipulation include using appropriate data structures, indexing, and taking advantage of parallel processing capabilities.
70. Explain the concept of ‘memoization’ and its application in R programming.
Ans:
- Memoization is a technique used to cache the results of expensive function calls to avoid redundant computations.
- In R, the ‘memoise’ package provides a simple way to implement memoization, improving the efficiency of functions that involve repetitive calculations.
71. What is the purpose of the ‘rgdal’ package in R?
Ans:
The ‘rgdal’ package is used for reading and writing spatial data formats in R. It provides bindings to the ‘GDAL’ (Geospatial Data Abstraction Library) and allows for the manipulation of various geospatial data formats, including vector and raster data.
72. What is R and why is it widely used in data science?
Ans:
- R is a programming language and environment designed for statistical computing and data analysis.
- It is widely used in data science due to its extensive statistical packages, rich visualization capabilities, and a vibrant community.
- R enables efficient data manipulation, exploration, and modeling, making it a preferred tool for statistical analysis and machine learning tasks.
73. What is the purpose of the ‘shiny’ package in R?
Ans:
The ‘shiny’ package in R is designed for building interactive web applications directly from R. It provides a framework for creating web-based dashboards and applications with dynamic, reactive components. ‘shiny’ enables data scientists and analysts to share their insights with a broader audience in an interactive and user-friendly manner, making it a valuable tool for developing web-based data applications without extensive web development knowledge.
74. What is the purpose of the ‘apply’ family of functions in R?
Ans:
- The ‘apply’ family, including functions like ‘apply’, ‘lapply’, and ‘sapply’, is used for applying a function to the rows or columns of matrices, arrays, or lists.
- These functions simplify repetitive tasks, enhancing code readability and efficiency by avoiding explicit loops in R.
75. How does R handle missing values, and what functions are used for handling them?
Ans:
R handles missing values using functions like ‘is.na()’, ‘na.omit()’, and ‘complete.cases()’. ‘is.na()’ identifies missing values, ‘na.omit()’ removes missing values from a vector or data frame, and ‘complete.cases()’ returns a logical vector indicating complete cases without missing values.
76. Explain the purpose of the ‘ggplot2’ package in R.
Ans:
- The ‘ggplot2’ package is used for creating intricate and customizable data visualizations in R.
- Based on the Grammar of Graphics, ‘ggplot2’ enables users to build complex plots layer by layer, providing flexibility and control over plot aesthetics.
- It has become a standard for producing high-quality graphics in R.
77. What are factors in R, and why are they useful in statistical modeling?
Ans:
Factors in R are used to represent categorical variables. They store levels, ensuring that R understands the distinct categories and their order. Factors are crucial in statistical modeling as they provide a structured way to handle categorical data, facilitating appropriate analysis and interpretation.
78. How does R handle data importing from external sources, such as CSV or Excel files?
Ans:
- R offers functions like ‘read.csv()’ and ‘read_excel()’ from packages like ‘readr’ and ‘readxl’ to import data from CSV and Excel files, respectively.
- These functions simplify the process of reading external data into R data frames, allowing seamless integration of diverse datasets.
79. Explain the concept of data reshaping in R using the ‘reshape2’ package.
Ans:
- The ‘reshape2’ package is used for transforming and reshaping data frames in R.
- Functions like ‘melt()’ and ‘dcast()’ help convert data between wide and long formats, making it easier to manage and analyze datasets.
- This package is especially useful for tasks involving panel data or repeated measurements.
80. What is the significance of the ‘dplyr’ package in R, and how does it improve data manipulation?
Ans:
The ‘dplyr’ package is essential for data manipulation in R, providing a set of functions like ‘filter’, ‘select’, ‘mutate’, ‘group_by’, ‘summarize’, and ‘arrange’. These functions streamline the process of filtering, selecting, creating new variables, grouping, summarizing, and sorting data frames, enhancing the efficiency and readability of data manipulation tasks.
81. Explain the difference between the ‘==’, ‘===’, and ‘is.equal()’ operators in R.
Ans:
In R, ‘==’ is used for element-wise comparison, while ‘===’ is not a valid operator. ‘is.equal()’ is not a built-in function; instead, ‘identical()’ is used for testing object equality, checking both values and types. ‘identical()’ returns ‘TRUE’ if two objects are exactly the same, including attributes.
82. How does R handle the concept of lazy evaluation?
Ans:
- Lazy evaluation in R refers to the delayed execution of expressions until their results are explicitly needed.
- This feature enhances performance by avoiding unnecessary computations.
- Functions like ‘lapply()’ and ‘sapply()’ exhibit lazy evaluation, evaluating expressions only when the results are required.
83. What is the purpose of the ‘caret’ package in R, and how does it simplify machine learning tasks?
Ans:
The ‘caret’ package streamlines machine learning tasks in R by providing a consistent interface for model training, tuning, and evaluation. It supports various algorithms, making it easy to switch between models. ‘caret’ also includes functions for data preprocessing, feature selection, and model assessment, offering a unified approach to the machine learning workflow.
84. Explain the use of the ‘purrr’ package in R and how it differs from the ‘apply’ family of functions.
Ans:
The ‘purrr’ package is designed for functional programming in R and is particularly useful for working with lists and vectors. It introduces a consistent and user-friendly syntax for functions like ‘map’, ‘map2’, and ‘pmap’, making it more intuitive and readable compared to the ‘apply’ family of functions. ‘purrr’ facilitates cleaner code for iterating over elements and applying functions.
85. What is the purpose of the ‘tidyr’ package in R, and how does it complement ‘dplyr’ for data wrangling?
Ans:
- The ‘tidyr’ package complements ‘dplyr’ by focusing on data tidying, specifically reshaping data frames for analysis.
- Functions like ‘gather()’ and ‘spread()’ help convert data between long and wide formats, making it easier to work with tidy data.
- ‘tidyr’ and ‘dplyr’ together form a powerful suite for efficient data manipulation and wrangling in R.
86. What standard functions are available for pattern matching, and how does R handle regular expressions?
Ans:
R utilities such as ‘grep()’, ‘grepl()’,’sub()’, and ‘gsub()’ facilitate the use of regular expressions. Text processing and manipulation are made possible by these functions, which allow pattern matching and substitution in character vectors. To define search patterns in R that are used to find and extract particular patterns from texts, regular expressions are employed.
87. What is the aim of the R package ‘stringr’?
Ans:
- For reliable and effective string manipulation, R includes the’stringr’ package.
- It offers a set of methods that are easy to use and straightforward for tasks like text editing, pattern matching, and substring extraction.
- Regular expressions are less necessary when using “stringr,” which streamlines intricate string operations and improves code readability.
88. What are the advantages and how does R handle parallel computing?
Ans:
R’s ‘parallel’ and ‘foreach’ packages facilitate parallel computation. For computationally demanding jobs, parallel computing enhances performance by enabling the simultaneous execution of code on numerous processors or cores. For jobs where parallelization can dramatically cut down on computing time, such simulations, cross-validation, and bootstrapping, this is especially helpful.
89. Describe the objective of R’s “tidyverse.”
Ans:
- A group of R programs called “tidyverse”—which includes “dplyr,” “ggplot2,” “tidyr,” and other packages—are made to function well together.
- It encourages data manipulation and visualization in a uniform and organized manner, improving code readability and streamlining the data science workflow.
- The ‘tidyverse’ approach promotes a methodical and well-structured process for data analysis and visualization.
90. What function does R’s “reshape” package serve?
Ans:
- Data frame reshaping and restructuring capabilities are available in the R ‘reshape’ package.
- It is particularly helpful for managing panel data or datasets with repeated measurements since it enables users to convert between wide and long formats.
- Data frames can be more easily transformed into structures that are better suited for analysis and visualization with the help of the “reshape” function.