
Last updated on 10th Nov 2021| 13955
Explore our guide on SPSS Interview Questions and Answers, suitable for both beginners and seasoned data analysts. Covering fundamental SPSS concepts, functionalities, and applications, this resource offers clear explanations to help you confidently prepare for interviews and enhance your proficiency in SPSS. Join us on a journey into the world of SPSS!
1. What is SPSS, and what is its primary purpose?
Ans:
SPSS, or Statistical Package for the Social Sciences, is a software program widely used for statistical analysis in social science, business, and other disciplines. Its primary purpose is to provide researchers and analysts with a tool for managing and analyzing data through a user-friendly interface, offering a range of statistical procedures to derive insights, draw conclusions, and make informed decisions.
2. Describe the difference between descriptive and inferential statistics.
Ans:
| Aspect | Descriptive Statistics | Inferential Statistics | |
| Definition | Summarizes and describes the main features of a dataset. | Makes inferences or predictions about a population based on a sample of data. | |
| Purpose | Provides a snapshot of the data and helps in organizing and simplifying information. | Draws conclusions about a population based on sample data. | |
| Data Type | Utilizes measures of central tendency (mean, median, mode) and measures of variability (range, variance, standard deviation). | Involves hypothesis testing, confidence intervals, and regression analysis. | |
| Examples | Mean, median, mode, range, standard deviation, histograms, frequency distributions. | T-tests, ANOVA, regression analysis, confidence intervals. | |
| Scope | Focuses on describing the characteristics of the observed data. | Extends findings from a sample to the entire population. |
3. How do you import data into SPSS?
Ans:
Importing data into SPSS can be done through various methods. One common way is to use the “File” menu and select “Open” or “Import Data.” Users can then choose the file format and locate the dataset they want to import. Ensure your data is well-organized, with variables in columns and cases in rows. If your data has a header row, check the option to use it for variable names during the import.
4. What types of files can SPSS handle for data import?
Ans:
SPSS is designed to be versatile in handling various file formats for data import. The software supports various common file types, including Excel spreadsheets, CSV (Comma-Separated Values), and tab-delimited text files. Additionally, SPSS can read data from databases like Microsoft Access and statistical software formats like SAS and Stata. This broad compatibility allows researchers and analysts to seamlessly import data from different sources and platforms, facilitating a more inclusive and efficient data analysis process.
5. Explain the purpose of the Data View and Variable View in SPSS.
Ans:
In SPSS(Statistical Package for the Social Sciences), the Data View and Variable View are two essential components that collectively serve as the foundation for managing and analyzing datasets. The Data View is the primary interface where users can input, view, and manipulate the data. It resembles a spreadsheet, with each row representing an individual case or observation and each column containing values for a specific variable.
6. How do you record variables in SPSS?
Ans:
In SPSS, recording variables is a process that involves altering the values of existing variables to create new categories or representations. Users can navigate to the “Transform” menu to recode variables and select “Recode Into Different Variables.” Within the dialog box, they choose the variable to be recorded and assign a name to the new variable to store the modified values. The recording rules are then defined, specifying how original values should be transformed into new values. Users can set up rules based on ranges and individual values or assign system-missing values.
7. What is the significance of missing values in SPSS, and how do you handle them?
Ans:
Missing values in SPSS can significantly impact the validity and reliability of statistical analyses. The presence of missing data can lead to biased results and reduce the precision of statistical tests. Handling missing values is essential to ensure the accuracy of your findings. SPSS provides several methods to manage missing data. One common approach is to delete cases with missing values, which may lead to losing valuable information and potentially biased results. Alternatively, you can blame missing values by replacing them with estimated values based on the available data.
8. Explain the process of data transformation in SPSS.
Ans:
Data transformation in SPSS involves manipulating or altering your dataset to meet specific analysis requirements. One common transformation is recording variables, where you modify the values of existing variables. To recode, navigate to the “Transform” menu and select “Recode into Different Variables.” Here, you can change the values of a variable based on certain criteria. Another transformation involves computing new variables.
9.How can you filter cases in SPSS?
Ans:
To filter cases in SPSS, you can use the “Select Cases” feature. This tool temporarily excludes specific cases from your analysis or data view. To access it, navigate to the “Data” menu and select “Select Cases.” Within the “Select Cases” dialog box, you have several options. Choosing “Based on a condition” enables you to specify a condition using variables in your dataset. Always exercise caution and consider saving your data before making significant adjustments.
10.What is the difference between a one-sample t-test and an independent samples t-test in SPSS?
Ans:
In SPSS, the one-sample t-test and the independent samples t-test are two distinct statistical procedures used to examine mean differences, but they are applied in different contexts. The one-sample t-test is employed when comparing the mean of a single sample to a known or hypothesized population mean. This test assesses whether the observed sample mean significantly differs from a specified population mean, helping researchers determine if evidence supports a claim about the population.
11. Describe the steps to perform a chi-square test in SPSS.
Ans:
- Open SPSS and load your dataset.
- Navigate to “Analyze” in the menu, then select “Descriptive Statistics” and choose “Crosstabs.”
- Select the variables you want to analyze by dragging them into the “Rows” and “Columns” boxes.
- Click the “Statistics” button and check the “Chi-square” option.
- Click “OK” to return to the main dialog, then click “OK” again to run the analysis.
- Review the output table for the chi-square statistic, degrees of freedom, and p-value.
12. How do you perform regression analysis in SPSS?
Ans:
In SPSS, performing regression analysis involves several steps. Start by opening your dataset and navigating to the “Analyze” menu. Select “Regression” and choose the appropriate regression analysis option based on your research question, such as linear or multiple regression. After configuring the settings, click “OK” to run the analysis. SPSS will generate output containing regression coefficients, R-squared values, and other relevant statistics to help interpret the relationships between variables.
13. What is the purpose of the Reliability Analysis procedure in SPSS?
Ans:
The Reliability Analysis procedure in SPSS assesses the internal consistency or reliability of a scale or set of items in a questionnaire. This analysis helps researchers ensure that the items in their measurement instrument consistently measure the same underlying construct. To perform a Reliability Analysis, go to the “Analyze” menu, choose “Scale,” and then select “Reliability Analysis.” Specify the variables you want to analyze and set the reliability coefficient (usually Cronbach’s alpha).
14. How can you handle outliers in SPSS?
Ans:
Handling outliers in SPSS can be done through various methods. One common approach is to use the “Transform” menu and select “Recode into Different Variables.” Identify outliers using statistical methods or visual inspection, recode extreme values to a specified range, or replace them with a central tendency measure, like the mean or median. Alternatively, you can perform transformations such as winsorizing or winsorized z-scores to mitigate the impact of outliers on your analysis.
15. Describe the steps to conduct a repeated measures ANOVA in SPSS.
Ans:
Conducting repeated measures ANOVA in SPSS involves several steps. After opening your dataset, go to the “Analyze” menu, select “General Linear Model,” and then choose “Repeated Measures.” Specify the within-subjects factor(s), set the number of levels, and define the dependent variable(s). Click “Options” to specify any post hoc tests or contrast options. Finally, click “OK” to run the analysis. The output will include information on within-subjects effects, providing insights into the significance of the repeated measures factor(s).
16. What is the Difference Score in SPSS, and how is it calculated?
Ans:
The Difference Score in SPSS represents the discrepancy between paired measurements on two related variables. To calculate the Difference Score, create a new variable that subtracts the scores of one variable from the scores of another within each pair. This variable represents the change or difference between the two measurements, allowing researchers to analyze the impact of an intervention or treatment.
17. Explain the purpose of the Merge Files command in SPSS.
Ans:
The Merge Files command in SPSS combines two datasets based on a common variable. This is particularly useful when data is split across multiple files, and you want to merge them into a single dataset. To use this command, go to the “Data” menu, select “Merge Files,” and choose “Add Cases.” Specify the files to be merged, identify the matching variable, and customize the merge options. The merged dataset will contain all the variables from both files, facilitating comprehensive analysis.
18. How do you perform a nonparametric test, such as the Mann-Whitney U test, in SPSS?
Ans:
Performing a nonparametric test, like the Mann-Whitney U test, in SPSS involves selecting the “Nonparametric Tests” option under the “Analyze” menu. Choose the test you want to perform and input the variables of interest. In the case of Mann-Whitney U, you would choose “2 Independent Samples.” SPSS will generate output containing the test statistic, significance level, and other relevant information, helping you assess the differences between groups without assuming a normal distribution.
19. Describe the use of the Bootstrapping procedure in SPSS.
Ans:
The Bootstrapping procedure in SPSS is a resampling technique used to estimate the sampling distribution of a statistic. It helps researchers obtain more reliable confidence intervals and assess the stability of their results. To use Bootstrapping, go to the “Analyze” menu, choose “Bootstrapping,” and select the variable of interest. Specify the number of bootstrap samples and any desired statistics. SPSS will generate output with bootstrapped confidence intervals and other relevant information.
20. How can you create and interpret a boxplot in SPSS?
Ans:
Creating and interpreting a boxplot in SPSS involves going to the “Graphs” menu, selecting “Boxplot,” and then choosing the variable you want to visualize. Customize the appearance of the boxplot as needed, and SPSS will generate a graphical representation of the distribution of your variable, including information about central tendency, spread, and potential outliers. Boxplots are valuable for visually assessing the distributional characteristics of a variable and identifying any unusual observations.
21. What is the purpose of the GLM (General Linear Model) procedure in SPSS?
Ans:
The GLM (General Linear Model) procedure in SPSS is a versatile tool for analyzing relationships between independent and dependent variables. It can handle various designs, including ANOVA, ANCOVA, and regression. Input the variables, set the factors, and customize options as needed. The GLM procedure provides comprehensive output, including information on main effects and interactions, aiding in interpreting relationships between variables.
22. How do you conduct a paired samples t-test in SPSS?
Ans:
- Open SPSS and load your dataset.
- Go to “Analyse,” select “Compare Means,” and choose “Paired-Samples T Test.”
- Select the variables for the “Paired Variable” box.
- Optionally, define a “Test Variable” if testing against a specific value.
- Click “OK” to run the analysis.
- Review the output for the t-statistic, degrees of freedom, and p-value.
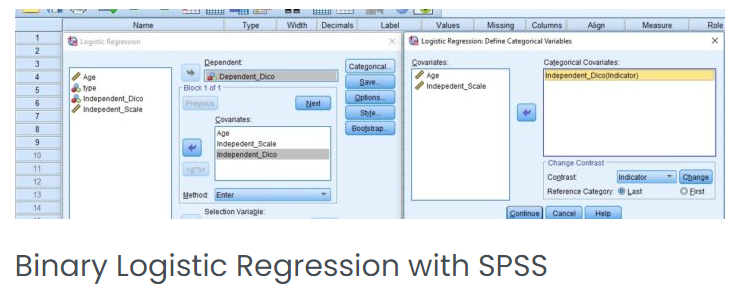
23. Explain the steps to perform a logistic regression analysis in SPSS.
Ans:
Load your dataset in SPSS. Go to “Analyse,” select “Regression,” and choose “Binary Logistic”. Move the dependent variable to the “Dependent” box and the independent variables to the “Covariates” box. Specify options like method, goodness-of-fit tests, and save variables. Click “OK” to run the logistic regression analysis. Review the output for coefficients, odds ratios, and significance levels.
24. What is the role of the Discriminant Analysis procedure in SPSS?
Ans:
- Open SPSS and load your dataset.
- Go to “Analyse,” select “Classify,” and choose “Discriminant.”
- Select the grouping variable for the “Grouping Variable” box.
- Choose variables for the “Variables” box.
- Specify prior probabilities and options.
- Click “OK” to run the discriminant analysis.
- Examine the output for canonical discriminant functions and group centroids.
25. How do you create and interpret a bar chart in SPSS?
Ans:
Open SPSS and load your dataset. Go to “Graphs” in the menu and choose “Chart Builder.” Drag a “Bar” chart into the chart preview. Specify variables for the x-axis (Category Axis) and y-axis (Y-Axis). Optionally, customize the appearance of the chart. Click “OK” to create the bar chart. Interpret the chart by analyzing the height of bars and comparing categories.
26. Describe the use of the Missing Value Analysis procedure in SPSS.
Ans:
Open SPSS and load your dataset. Go to “Analyse,” select “Data,” and choose “Missing Value Analysis.” Move variables to the “Variables” box. Choose methods for handling missing data (e.g., EM algorithm). Set options and click “OK” to run the analysis. Examine the output for patterns of missing data and imputation results.
27. What is the purpose of the Kaplan-Meier Survival Analysis in SPSS?
Ans:
Load your dataset with survival data in SPSS. Go to “Analyse,” select “Survival,” and choose “Kaplan-Meier.” Specify the time and event variables. Optionally, define grouping variables. Set options and click “OK” to run the Kaplan-Meier analysis. Review the output for survival curves and log-rank test results.
28. How can you calculate descriptive statistics (mean, median, etc.) in SPSS?
Ans:
Open SPSS and load your dataset. Go to “Analyse,” select “Descriptive Statistics,” and choose “Descriptives.” Move variables to the “Variables” box. Optionally, request statistics like mean, median, and standard deviation. Click “OK” to run the analysis. Review the output for descriptive statistics of the selected variables.
29. Explain the steps to conduct a principal component analysis (PCA) in SPSS.
Ans:
Open SPSS and load your dataset. Go to “Analyse,” select “Dimension Reduction,” and choose “Factor.” Move variables to the “Variables” box. Select the “Extraction” method as “Principal Components.” Specify rotation options and other settings. Click “OK” to run the principal component analysis. Examine the output for component loadings and variance explained.
30. How do you test for homogeneity of variance in SPSS?
Ans:
Open SPSS and load your dataset. Go to “Analyse,” select “Compare Means,” and choose “One-Way ANOVA.” Move the dependent variable to the “Dependent List” box and the grouping variable to the “Factor” box. Click “Options” and check “Homogeneity of variance test.” Click “OK” to run the analysis. Examine the output for Levene’s test for homogeneity of variance.
31. Describe the use of the Multinomial Logistic Regression procedure in SPSS.
Ans:
Load your dataset in SPSS. Go to “Analyse,” select “Regression,” and choose “Multinomial Logistic.” Move the dependent variable to the “Categorical Dependent” box and predictors to the “Predictors” box. Specify options like method, reference category, and statistics. Click “OK” to run the multinomial logistic regression analysis.
Review the output for coefficients, odds ratios, and significance levels.
32. What is the purpose of the Decision Tree procedure in SPSS?
Ans:
The Decision Tree procedure in SPSS aims to construct decision trees to aid in predictive modeling and classification tasks. Decision trees are a type of algorithm that recursively splits the data based on different criteria, creating a tree-like structure of decisions. In SPSS, you can access the Decision Tree procedure through the “Analyze” menu and select “Classification Trees.”Decision trees are interpretable and can help identify key predictors influencing outcomes in a dataset.
33. How can you create and interpret a histogram in SPSS?
Ans:
Creating and interpreting a histogram in SPSS involves visualizing the distribution of a single variable. To construct a histogram, go to the “Graphs” menu, choose “Legacy Dialogs,” and then select “Histogram.” Specify the variable you want to analyze, customize bin width or several bins, and click “OK.” SPSS will generate a graphical representation of the variable’s distribution, with bars representing the frequency or density of different value ranges. Interpret the histogram by examining the distribution’s shape, central tendency, and spread, providing insights into the characteristics of the variable.
34. Explain the role of the Cluster Analysis procedure in SPSS.
Ans:
The Cluster Analysis procedure in SPSS is employed to identify natural groupings or clusters within a dataset. Access the Cluster Analysis through the “Analyze” menu, select “Classify,” and then choose “K-Means Cluster” or another clustering method. Specify the variables to be analyzed and set the number of clusters. SPSS will generate output indicating which cases belong to each cluster, assisting researchers in uncovering patterns and relationships within their data. Cluster analysis is commonly used in market segmentation, customer profiling, and other fields where identifying distinct groups is valuable.
35. What is the purpose of the Forecasting procedure in SPSS?
Ans:
The Forecasting procedure in SPSS is designed to predict future values based on historical data patterns. To use this procedure, go to the “Analyze” menu, select “Forecasting,” and choose the appropriate method, such as Exponential Smoothing or ARIMA. Specify the target variable and time-related variables, set any additional options, and click “OK” to generate forecasts. The Forecasting procedure aids researchers and analysts in making informed predictions about future trends and patterns, supporting decision-making processes.
36. How do you perform a Wilcoxon signed-rank test in SPSS?
Ans:
Performing a Wilcoxon signed-rank test in SPSS involves analyzing paired data to determine if there is a significant difference between the related samples. Navigate to the “Nonparametric Tests” option under the “Analyze” menu, choose “2 Related Samples,” and then select “Wilcoxon.” Specify the paired variables, set any additional options, and run the analysis. The Wilcoxon signed-rank test is useful when the data violate the assumptions of a parametric test or when dealing with ordinal or interval data, providing a nonparametric alternative to the paired-samples t-test.
37. Describe the steps to conduct a survival analysis using the Cox Regression procedure in SPSS.
Ans:
Survival analysis using the Cox Regression procedure in SPSS involves exploring the time until an event occurs, such as survival time or time to failure. Access the Cox Regression through the “Analyze” menu, select “Survival,” and then choose “Cox Regression.” Specify the time variable, event indicator, and covariates, and run the analysis. The Cox Regression model estimates hazard ratios, providing insights into the impact of covariates on the survival time. This procedure is commonly used in medical research, epidemiology, and other fields to assess the factors influencing survival outcomes.
38. What is the Mann-Whitney U test, and when would you use it in SPSS?
Ans:
The Mann-Whitney U test in SPSS is a nonparametric test used to compare two independent groups when the assumptions of the t-test are not met. To perform the Mann-Whitney U test, go to the “Nonparametric Tests” option under the “Analyze” menu, choose “2 Independent Samples,” and then select “Mann-Whitney U.” Specify the two groups you want to compare and run the analysis. This test is appropriate when dealing with ordinal or interval data and is particularly useful when the sample sizes are small, or the data distribution is non-normal.
38. How can you perform a factor analysis with the Factor procedure in SPSS?
Ans:
Performing a factor analysis with the Factor procedure in SPSS involves identifying underlying factors that explain the patterns of correlations among observed variables. Access the Factor procedure through the “Analyze” menu, select “Dimension Reduction,” and then choose “Factor.” Specify the variables you want to analyze, set extraction and rotation options, and run the analysis. Factor analysis helps researchers reduce the dimensionality of their data, uncover latent factors, and gain insights into the structure of relationships among variables.
39. Explain the purpose of the Decision Tree procedure in SPSS.
Ans:
The Decision Tree procedure in SPSS is designed to construct decision trees for predictive modeling and classification tasks. Decision trees recursively split the data based on different criteria, creating a tree-like structure of decisions. Accessed through the “Analyze” menu and selecting “Classification Trees,” this procedure is particularly useful when you want to understand the hierarchical relationships between variables and make predictions based on those relationships. Decision trees are interpretable and can help identify key predictors influencing outcomes in a dataset.
40. What is the role of the Linear Mixed Models procedure in SPSS?
Ans:
The Linear Mixed Models procedure in SPSS analyzes repeated measures or clustered data where observations are not independent. Accessed through the “Analyze” menu and selecting “Mixed Models,” this procedure allows researchers to account for both fixed and random effects in the model. Linear mixed models are beneficial when dealing with data that exhibit correlation among observations, such as longitudinal studies or nested designs. The procedure provides insights into fixed effects, random effects, and covariance structures, allowing for a more accurate representation of the underlying data structure.
41. What is the McNemar test, and when would you use it in SPSS?
Ans:
Load your dataset with paired nominal data in SPSS. Go to “Analyse,” select “Nonparametric Tests,” and choose “McNemar.” Select the paired variables for “Paired Variables.” Set options and click “OK” to run the McNemar test. Examine the output for the McNemar statistic and significance level.
Use the McNemar test to analyze changes or differences in paired categorical data.
42. How can you handle multicollinearity in regression analysis in SPSS?
Ans:
Run the regression analysis in SPSS. Review the Variance Inflation Factor (VIF) values for each predictor. Identify predictors with high VIF values (usually above 10). Consider removing or combining highly correlated predictors. Rerun the regression analysis after addressing multicollinearity. Interpret the revised regression results.
43. Explain the steps to conduct a moderation analysis in SPSS.
Ans:
- Open SPSS and load your dataset.
- Go to “Analyse,” select “Regression,” and choose “Linear.”
- Move the dependent variable to the “Dependent” box and predictors to the “Independent(s)” box.
- Include the moderator variable by dragging it into the “Covariate(s)” box.
- Specify options for the analysis, including interactions.
- Click “OK” to run the moderation analysis.
- Interpret the results, paying attention to the interaction effect.
44. What is the purpose of the Multivariate Analysis of Variance (MANOVA) in SPSS?
Ans:
Open SPSS and load your dataset. Go to “Analyse,” select “General Linear Model,” and choose “Multivariate.” Select dependent variables for “Dependent Variables.” Specify the grouping variable for “Fixed Factor(s).” Set options for post hoc tests and other settings. Click “OK” to run the MANOVA analysis. Examine the output for multivariate effects and significance levels.
45. How do you perform a Kruskal-Wallis test in SPSS?
Ans:
Open SPSS and load your dataset. Go to “Analyse,” select “Nonparametric Tests,” and choose “K Independent Samples.” Move the dependent variable to the “Test Variable List.” Move the grouping variable to the “Grouping Variable.” Set options and click “OK” to run the Kruskal-Wallis test. Examine the output for the test statistic and significance level.
46. Describe the steps to conduct a meta-analysis in SPSS.
Ans:
(Note: SPSS is not typically used for meta-analysis; specialized software like RevMan or Comprehensive Meta-Analysis is more common)
Collect and organize data from multiple studies. Use meta-analysis software to conduct the analysis. Follow the software-specific steps to input effect sizes, weights, and other relevant information. Run the meta-analysis. Examine the output for combined effect sizes and confidence intervals. Interpret the results and draw conclusions based on the meta-analysis.
47. What is the purpose of the Examine procedure in SPSS?
Ans:
- Open SPSS and load your dataset.
- Go to “Analyse,” select “Descriptive Statistics,” and choose “Examine.”
- Select variables for analysis.
- Set options for statistics and plots.
- Click “OK” to run the Examine procedure.
- Review the output for additional descriptive statistics, plots, and tests.
48. How can you perform a sensitivity analysis in SPSS?
Ans:
Identify the model or analysis to be assessed for sensitivity. Modify key parameters, such as outliers or influential data points. Rerun the analysis in SPSS after each modification. Evaluate how changes in parameters impact results. Assess the robustness and stability of the analysis. Document and report the findings of the sensitivity analysis.
49. Explain the role of the Random Effects procedure in SPSS.
Ans:
The Random Effects procedure in SPSS is integral to analyzing data with mixed-effects or hierarchical structures. This procedure allows researchers to account for variability at different levels, such as repeated measures within subjects or clustering of observations. Accessed through the “Analyze” menu and selecting “Mixed Models,” the Random Effects procedure enables the modeling of both fixed and random effects in the analysis. Random effects represent sources of variation that are not of primary interest but need to be considered to obtain accurate estimates of fixed effects.
50. What is the purpose of the Linear Regression procedure in SPSS?
Ans:
The Linear Regression procedure in SPSS is employed for modeling and analyzing the linear relationship between a dependent variable and one or more independent variables. Accessing the “Analyze” menu and selecting “Regression” allows researchers to estimate coefficients, assess statistical significance, and make predictions based on the fitted model. Linear regression is widely used in various fields to understand and quantify the impact of independent variables on the dependent variable, facilitating hypothesis testing and predictive modeling.

SPSS Training Certification Course with Advanced Concepts from Real Time Experts
Weekday / Weekend BatchesSee Batch Details51. How do you perform a Kolmogorov-Smirnov test in SPSS?
Ans:
Performing a Kolmogorov-Smirnov test in SPSS involves assessing the normality of a single variable’s distribution. Navigate to the “Analyze” menu, select “Nonparametric Tests,” and then choose “Legacy Dialogs” followed by “2-Independent Samples.” Specify the variable of interest and the grouping variable, and click “OK.” The Kolmogorov-Smirnov test assesses whether the distribution of the variable differs significantly from a normal distribution. This nonparametric test is useful when normality assumptions are in question or when dealing with ordinal or interval data.
52. Describe the use of the Nonlinear Regression procedure in SPSS.
Ans:
The Nonlinear Regression procedure in SPSS is used when the relationship between variables is not linear and cannot be adequately modeled using traditional linear regression. Access this procedure through the “Analyze” menu, select “Regression,” and then choose “Nonlinear.” Specify the dependent and independent variables and provide an initial estimate for the nonlinear parameters. SPSS will iteratively fit the model to the data, allowing researchers to capture and understand nonlinear relationships, which can be especially relevant in fields where complex patterns must be modeled.
53. What is the significance of the Homoscedasticity test in SPSS?
Ans:
The Homoscedasticity test in SPSS assesses the equality of variances of the residuals in a regression model. After performing a linear regression analysis, go to the “Graphs” menu, select “Legacy Dialogs,” and then choose “Scatter/Dot.” Select “Residuals” as the Y-axis variable and the predicted values as the X-axis variable. A scatterplot will be generated, and you can visually inspect for patterns or use additional statistical tests to check for homoscedasticity. Ensuring homoscedasticity is crucial for valid inferences from regression models.
54. How can you create and interpret a heat map in SPSS?
Ans:
Creating and interpreting a heat map in SPSS involves visualizing the relationships between two categorical variables. Go to the “Graphs” menu, select “Chart Builder,” and choose the heat map template. Drag and drop the variables of interest into the rows and columns, and set the color intensity based on the intersection values. Heat maps are useful for identifying patterns, associations, and trends in categorical data, visually representing the relationships between variables.
55. Explain the purpose of the Bootstrap procedure in SPSS.
Ans:
The Bootstrap procedure in SPSS is a resampling technique used to estimate the sampling distribution of a statistic. Accessing through the “Analyze” menu and selecting “Bootstrapping” is valuable for obtaining more reliable confidence intervals and assessing the stability of results. Researchers can specify the variable of interest, set the number of bootstrap samples, and choose the desired statistics to be estimated.
56. What is the role of the Multiple Imputation procedure in SPSS?
Ans:
The Multiple Imputation procedure in SPSS is employed for handling missing data by creating multiple plausible imputed datasets. Accessed through the “Analyze” menu and selecting “Multiple Imputation,” this procedure aids researchers in mitigating the impact of missing data on statistical analyses. It generates multiple datasets with imputed values for missing observations, allowing for a more accurate representation of uncertainty in the analysis. Multiple imputation is crucial when missing data may introduce bias or reduce the precision of parameter estimates.
57. How do you perform a Friedman test in SPSS?
Ans:
Performing a Friedman test in SPSS involves assessing the differences among repeated measures in non-normally distributed data. Navigate to the “Analyze” menu, select “Nonparametric Tests,” and then choose “Legacy Dialogs” followed by “K Independent Samples.” Specify the repeated and grouping measures variables, and click “OK.” The Friedman test is a nonparametric alternative to repeated measures ANOVA and is useful when assumptions of normality are violated or when dealing with ordinal or interval data.
58. Describe the use of the Neural Networks procedure in SPSS.
Ans:
The Neural Networks procedure in SPSS is used for modeling complex relationships in data by simulating the structure and function of neural networks. Accessed through the “Analyze” menu and selecting “Neural Networks,” this procedure allows researchers to build predictive models based on the interconnections of artificial neurons. Neural networks are particularly useful when traditional statistical methods do not capture intricate patterns. The procedure provides insights into the hidden relationships among variables, making it valuable for predictive modeling and pattern recognition tasks.
59. What is the purpose of the Confirmatory Factor Analysis procedure in SPSS?
Ans:
- Assess the fit of a predefined factor structure to the observed data.
- Confirm or refute the hypothesized relationships between observed variables and latent factors.
- Evaluate how well the model represents the underlying structure.
- Identify and modify paths or relationships that do not fit the data well.
- Provide statistical tests and fit indices to determine the adequacy of the specified model.
- Useful in validating theoretical constructs and confirming the structure of measurement models.
60. How can you create and interpret a radar chart in SPSS?
Ans:
(Note: SPSS does not have a built-in radar chart option; specialized software or manual construction may be needed.) Prepare your data with variables representing different aspects of interest. Calculate the mean or score for each variable. Use software capable of creating radar charts (e.g., Excel) to input and plot the mean scores. Interpret the radar chart by examining each variable’s distance from the center, representing its level.
61. Explain the steps to conduct a repeated measures MANOVA in SPSS.
Ans:
- Open SPSS and load your dataset.
- Go to “Analyse,” select “General Linear Model,” and choose “Repeated Measures.”
- Select dependent variables for “Within-Subject Factor Name.”
- Define the “Number of Levels” and input the within-subject variables.
- Set options for post hoc tests and other settings.
- Click “OK” to run the repeated measures MANOVA.
- Examine the output for multivariate effects and significance levels across repeated measures.
62. What is the Difference-in-Differences analysis, and how is it conducted in SPSS?
Ans:
Prepare data with treatment and control groups and measurements before and after treatment. Assign codes to indicate treatment and control groups and pre- and post-treatment periods. Create interaction terms between the treatment/control group and the pre/post periods. Perform a regression analysis in SPSS with the outcome variable, main effects, and interaction terms. Interpret the coefficient of the interaction term as the difference-in-differences effect. Assess statistical significance and conclude the treatment effect over time.
63. Describe the use of the Nonparametric Tests procedure in SPSS.
Ans:
Open SPSS and load your dataset. Go to “Analyze” and select “Nonparametric Tests.” Choose the specific nonparametric test based on the research design (e.g., Mann-Whitney U test, Kruskal-Wallis test). Select variables for analysis and set options. Click “OK” to run the nonparametric test. Examine the test statistic and significance level output and interpret the results. Nonparametric tests are used when data violate the assumptions of parametric tests.
64. How do you perform a factor analysis with a rotation method in SPSS?
Ans:
- Open SPSS and load your dataset.
- Go to “Analyse,” select “Dimension Reduction,” and choose “Factor.”
- Select variables for factor analysis.
- Choose the extraction method (e.g., principal components) and set options.
- Click “Rotation” to choose a rotation method (e.g., Varimax, Promax).
- Set rotation options and click “OK” to run the factor analysis.
- Examine the output for factor loadings and rotated component matrix.
65. What is the purpose of the Univariate Analysis of Variance (ANOVA) in SPSS?
Ans:
Assess differences in means among multiple independent groups. Determine if there are statistically significant differences in a dependent variable across different levels of a categorical independent variable. Test hypotheses regarding group differences in a continuous dependent variable. Provide insights into the impact of the independent variable on the dependent variable. Utilised when comparing means across two or more groups.
67. How can you conduct a Two-Way ANOVA in SPSS?
Ans:
- Open SPSS and load your dataset.
- Go to “Analyse,” select “General Linear Model,” and choose “Univariate.”
- Move the dependent variable to the “Dependent Variable” box.
- Move the two independent variables to the “Fixed Factor(s)” box.
- Set options for post hoc tests and other settings.
- Click “OK” to run the Two-Way ANOVA.
- Examine the output for main effects and interaction effects.
68. Explain the role of the Bootstrapping procedure in SPSS.
Ans:
Open SPSS and load your dataset. Go to “Analyse,” select “Bootstrapping,” and choose the analysis (e.g., regression, mean). Specify variables and options for the bootstrap analysis. Set the number of bootstrap samples. Click “OK” to run the bootstrap procedure. Examine the output for bootstrapped confidence intervals and estimates. Bootstrapping is used to assess the stability and robustness of statistical estimates.
69. What is the purpose of the Factor Scores procedure in SPSS?
Ans:
Obtain factor scores for individuals based on factor analysis results. Represent individuals’ positions on latent factors derived from the factor analysis. Facilitate the interpretation of factor analysis by providing scores for each observation. Use factor scores in subsequent analyses or as variables in regression models. Factor scores represent individuals’ relative standing on underlying latent constructs identified through factor analysis. Accessed by running the “Save Factor Scores” option after conducting factor analysis in SPSS.
70. How do you perform a sign test in SPSS?
Ans:
Performing a sign test in SPSS involves analyzing paired data to determine if there is a significant difference between the related samples. To conduct a sign test in SPSS, go to the “Nonparametric Tests” option under the “Analyze” menu, select “2 Related Samples,” and then choose “Sign Test.” Specify the paired variables of interest, and SPSS will generate output containing the test statistic, significance level, and other relevant information, aiding in assessing differences within paired data.

Enroll in SPSS Training with Advanced Concepts
- Instructor-led Sessions
- Real-life Case Studies
- Assignments
71. Describe the steps to conduct a Poisson Regression analysis in SPSS.
Ans:
A Poisson Regression analysis in SPSS involves modeling count data with a Poisson distribution. Access the Poisson Regression procedure through the “Analyze” menu, select “Regression,” and then choose “Poisson.” Adjust settings as needed, and click “OK” to run the analysis. Poisson Regression is commonly used when dealing with count data, such as the number of events or occurrences within a specific time or space, providing a method to model and understand the relationship between variables.
72. What is the role of the Meta-Regression procedure in SPSS?
Ans:
The Meta-Regression procedure in SPSS examines the relationship between study characteristics (covariates) and effect sizes in a meta-analysis. Access this procedure through the “Analyze” menu, select “Regression,” and then choose “Meta-Regression.” Meta-regression helps researchers explore sources of heterogeneity across studies and assess whether certain study characteristics influence the overall effect size in a meta-analysis.
73. How can you create and interpret a funnel plot in SPSS?
Ans:
Creating and interpreting a funnel plot in SPSS involves assessing publication bias in meta-analyses. After conducting a meta-analysis, go to the “Graphs” menu, select “Legacy Dialogs,” and then choose “Scatter/Dot.” Select the effect sizes as the Y-axis variable and a measure of precision (e.g., standard error) as the X-axis variable. Funnel plots display the spread of effect sizes against their precision, and asymmetry in the plot may indicate publication bias. Researchers can visually inspect the funnel plot or conduct statistical tests to evaluate the likelihood of publication bias in a meta-analysis.
74. Explain the purpose of the Exponential Smoothing procedure in SPSS.
Ans:
The Exponential Smoothing procedure in SPSS is used for time series forecasting. Access this procedure through the “Analyze” menu, select “Forecasting,” and then choose “Exponential Smoothing.” Specify the time variable and the variable to be forecasted. Adjust settings such as the smoothing parameter and choose the number of periods for forecasting. Exponential smoothing helps researchers make predictions by assigning exponentially decreasing weights to past observations, giving more importance to recent data in forecasting future values.
75. What is the Kaplan-Meier estimator, and when is it used in SPSS?
Ans:
The Kaplan-Meier estimator in SPSS estimates survival probabilities in survival analysis. To employ the Kaplan-Meier estimator, go to the “Analyze” menu, select “Survival,” and then choose “Kaplan-Meier.” Specify the time variable and the event indicator variable. The Kaplan-Meier estimator generates a survival curve, providing insights into the probability of survival over time. This method is commonly used in medical research, epidemiology, and other fields to analyze time-to-event data, such as the survival times of patients.
76. How do you perform a Power Analys in SPSS?
Ans:
Performing a Power Analysis in SPSS involves estimating the sample size required for a study to detect a significant effect, given a specified level of statistical power. Access the Power Analysis procedure through the “Utilities” menu and select “Sample Size and Power.” Choose the specific test and parameters, such as effect size and significance level, and run the analysis. Power analysis helps researchers plan studies by determining the appropriate sample size to achieve a desired level of statistical power.
77. Describe the use of the Logistic Regression procedure in SPSS.
Ans:
The Logistic Regression procedure in SPSS models the relationship between a dichotomous dependent variable and one or more independent variables. Access this procedure through the “Analyze” menu, select “Regression,” and then choose “Binary Logistic.” Specify the dependent variable and independent variables and run the analysis. Logistic regression is widely used in various fields to understand and quantify the impact of independent variables on the probability of an event occurring, making it valuable for binary outcome prediction.
78. What is the purpose of factor analysis with a variable rotation in SPSS?
Ans:
Factor analysis with a variable rotation in SPSS involves identifying underlying factors that explain the correlations among observed variables, focusing on maximizing the variance of factor loadings. Specify the variables, set extraction and rotation options, and run the analysis. The Varimax rotation is particularly useful for simplifying the interpretation of factors by maximizing the independence of factor loadings, aiding researchers in uncovering latent structures in their data.
79. How can you conduct a Multivariate Analysis of Covariance (MANCOVA) in SPSS?
Ans:
Conducting a Multivariate Analysis of Covariance (MANCOVA) in SPSS involves analyzing the differences in multiple dependent variables across groups while controlling for one or more covariates. Specify the dependent variables, independent variable(s), and covariates. MANCOVA allows researchers to assess whether group differences in the dependent variables remain after accounting for the effects of covariates, providing a more comprehensive analysis than univariate approaches.
80. Explain the steps to conduct a Categorical Principal Component Analysis (CATPCA) in SPSS.
Ans:
- Open SPSS and load your dataset.
- Go to “Analyse,” select “Dimension Reduction,” and choose “Categorical Principal Components.”
- Select categorical variables for the analysis.
- Specify options such as extraction method and rotation.
- Set additional options, such as output options or missing data handling.
- Click “OK” to run the CATPCA.
- Examine the output for component loadings, communalities, and other relevant statistics.
81. What is the role of the Bayesian Structural Equation Modelling (BSEM) procedure in SPSS?
Ans:
(Note: SPSS is not a common Bayesian Structural Equation Modelling platform. Specialized software like Mplus or JASP is often used for BSEM.) Specify the Bayesian Structural Equation Model using appropriate software. Run the BSEM analysis, specifying priors, model parameters, and other relevant settings. Examine output for Bayesian parameter estimates, credible intervals, and model fit indices. BSEM allows a Bayesian approach to testing and refining structural equation models.
82. How do you perform a Log-rank test in SPSS?
Ans:
- Prepare survival data in SPSS with variables for time and event status.
- Go to “Analyse,” select “Survival,” and choose “Log-rank.”
- Move the survival time variable to the “Time” box and event status to the “Event” box.
- Optionally, include grouping variables to compare survival curves.
- Set options and click “OK” to run the Log-rank test.
- Examine the output for survival curves and Log-rank test results.
83. Describe the use of the Multilevel Modeling procedure in SPSS. SPSS.
Ans:
Open SPSS and load your dataset. Go to “Analyse,” select “Mixed Models,” and choose “Linear.” Specify the dependent variable, fixed and random factors, and covariance structure. Set options for model estimation and fit statistics. Click “OK” to run the multilevel modeling analysis. Examine the output for fixed and random effects and variance components.
84. What is the purpose of the Latent Growth Curve Modelling procedure in SPSS?
Ans:
Prepare longitudinal data with repeated measures. Go to “Analyse,” select “Growth Curve,” and choose “Latent Growth.” Specify the time variable and repeated measures.
Set options for growth factors and model structure. Click “OK” to run the latent growth curve modeling. Examine the output for latent intercept and slope factors, growth trajectories, and fit indices.
85.How can you create and interpret a Pareto chart in SPSS?
Ans:
(Note: SPSS has no built-in Pareto chart option; Excel or other software may be more suitable.) Prepare data with categories and corresponding frequencies. Sort categories in descending order based on frequencies. Calculate cumulative percentages. Use software capable of creating Pareto charts (e.g., Excel) to plot the categories and cumulative percentages. Interpret the Pareto chart by focusing on the most significant categories contributing to the cumulative total.
86. Explain the steps to conduct a Cluster Analysis with the K-Means method in SPSS.
Ans:
Open SPSS and load your dataset. Go to “Analyse,” select “Classify,” and choose “K-Means Cluster Analysis.” Select variables for clustering. Specify the number of clusters (K) and set options for initialization and convergence. Click “OK” to run the K-Means cluster analysis. Examine the output for cluster centroids, cluster membership, and within-cluster variance.
87. What is the role of the Canonical Correlation procedure in SPSS?
Ans:
- Open SPSS and load your dataset.
- Go to “Analyse,” select “Data Reduction,” and choose “Canonical Correlation.”
- Select sets of variables for the canonical correlation.
- Set options for the analysis, such as extraction methods and rotation.
- Click “OK” to run the canonical correlation analysis.
- Examine the output for canonical correlations, functions, and variable loadings.
88. How do you perform a Q-Q plot in SPSS?
Ans:
Open SPSS and load your dataset. Go to “Graphs” in the menu and choose “Q-Q Plot.” Select the variable of interest for the “Variable” box. Optionally, customize the appearance of the Q-Q plot. Click “OK” to create the Q-Q plot . Interpret the Q-Q plot by assessing how closely the data points follow a theoretical distribution.
89. Describe the use of the Cross-Validation procedure in SPSS.
Ans:
Open SPSS and load your dataset. Depending on the analysis (e.g., regression), set aside a portion of the dataset as a validation or test set. Run the analysis on the training set. Validate the model on the test set to assess its generalization performance. Repeat the process multiple times with different random splits for robust evaluation. Cross-validation helps to prevent overfitting and provides a more realistic assessment of a model’s performance.
90.How do you test for normality in SPSS?
Ans:
Open SPSS and load your dataset. Click on “Analyze” in the menu, then select “Descriptive Statistics” and choose “Explore.” Move the variable of interest into the “Dependent List” box. Under the “Plots” button, check the “Normality plots with tests” option. Click “OK” to run the analysis. Examine the output for Shapiro-Wilk’s statistic and p-value to assess normality.
91. Explain the purpose of the Split File command in SPSS.
Ans:
Open your dataset in SPSS. Go to “Data” in the menu and choose “Split File.” Select “Organise output by groups” and choose a variable to split the file.Click “OK” to apply the split. Perform analyses or procedures; SPSS will execute them separately for each group. To turn off the split, go to “Data” and select “Split File” with the “Reset” option.
92. What is the syntax editor in SPSS, and when would you use it?
Ans:
Access the Syntax Editor by selecting “Window” and choosing “Syntax.” Write or paste syntax commands in the editor. Execute the syntax by highlighting the commands and pressing the “Run” button. Useful for automating repetitive tasks or conducting advanced analyses. Displays syntax for procedures performed through the graphical interface. Helps maintain a record of analysis steps for documentation and replication.
93. How do you create and interpret a frequency distribution in SPSS?
Ans:
Open SPSS and load your dataset. Go to “Analyse,” select “Descriptive Statistics,” and choose “Frequencies.” Move the variable of interest to the “Variable(s)” box. Click “Charts” to include a histogram in the output. Review the frequency table and histogram for patterns and distribution characteristics. Interpret the results, considering the shape, central tendency, and dispersion.