
Last updated on 09th Nov 2021| 2766
In our statistics interviews questions, we address diverse subjects, encompassing probability, hypothesis testing, regression analysis, and comprehension of statistical principles. Candidates might need to elucidate distinctions between descriptive and inferential statistics, interpret p-values, elucidate the objectives of regression analysis, and delve into the significance of random sampling. We may also inquire about candidates’ familiarity with statistical tools like R or Python and their hands-on experience in applying statistical methods to practical challenges. Effective communication in expressing statistical concepts, problem-solving proficiency, and a solid grasp of the fundamental principles of statistical analysis are pivotal for success in interviews focused on statistics.
1. What is Statistics?
Ans:
Statistics is a branch of mathematics involving data collection, analysis, interpretation, presentation, and organization. It provides methods for drawing inferences about the characteristics of a population based on a limited set of observations, usually called a sample.
2. Differentiate between Population and Sample.
Ans:
- Population: The entire set of individuals, objects, or observations about which information is sought that meets specific criteria. It is the complete group that is the subject of the study.
- Sample: A subset of the population selected for the study. The goal is for the piece to represent the population accurately. Statistical inferences are often made from the model to the entire population.
3. Define Mean, Median, and Mode.
Ans:
- Mean: The arithmetic average of a set of values, calculated by adding all values and dividing by the number of values. It is sensitive to extreme values.
- Median: The middle value of a dataset when it is ordered. If there is an even number of observations, the median is the average of the two central values. It is less sensitive to extreme values than the mean.
- Mode: The value that appears most frequently in a dataset. A dataset may have one way, more than one mode, or no mode.
4. Explain the Difference between Variance and Standard Deviation.
Ans:
- Variance: A measure of the dispersion or spread of a set of values. It is calculated as the average of the squared differences from the mean. Variance measures how much individual values in a dataset differ from the norm.
- Standard Deviation: The square root of the variance. It represents the average deviation or dispersion of individual values from the mean. Standard deviation is often preferred because it is in the same units as the original data.
5. What is the Central Limit Theorem?
Ans:
The Central Limit Theorem (CLT) states that, for a sufficiently large sample size, the distribution of the sample mean will be approximately normally distributed, regardless of the shape of the original population distribution. This theorem is fundamental in statistics as it allows for applying inferential statistical methods to make predictions and draw conclusions about population parameters based on sample data.
6. Define Skewness and Kurtosis.
Ans:
- Skewness: A measure of the asymmetry of a probability distribution. Positive skewness indicates a longer right tail, while negative skewness indicates a longer left bottom.
- Kurtosis: A measure of the “tailedness” of a probability distribution. It describes the shape of the distribution’s tails about a normal distribution. Positive kurtosis indicates heavier tails, while negative kurtosis indicates lighter bottoms.
7. Explain the Concept of Probability.
Ans:
Probability is a measure of the likelihood or chance of an event occurring. It is expressed as a number between 0 and 1, where 0 indicates an impossible event, 1 shows a particular event, and values between 0 and 1 represent the likelihood of an event occurring. Probability is a fundamental statistical concept used to quantify uncertainty and make predictions based on statistical models. It is often expressed as the ratio of the number of favourable outcomes to the total number of possible effects.
8. What is a Probability Distribution?
Ans:
A probability distribution is a mathematical function that describes the likelihood of obtaining the possible values that a random variable can take. It specifies the probabilities associated with each possible outcome of a random experiment. Probability distributions can be classified into discrete and continuous types.
9. Define Discrete and Continuous Probability Distributions.
Ans:
- Discrete Probability Distribution: Describes the probabilities of distinct outcomes in a discrete set, often represented by a probability mass function. Examples include the results of rolling a die or the number of heads in a series of coin flips.
- Continuous Probability Distribution: Describes the probabilities associated with a constant range of values, typically represented by a probability density function. Examples include the distribution of heights or weights in a population.
10. Explain the Characteristics of a Normal Distribution.
Ans:
The following features characterize a normal distribution (or Gaussian distribution):
- Symmetry: The distribution is symmetric around its mean.
- Bell-shaped Curve: The probability density function forms a bell-shaped curve, with the highest point at the mean.
- Mean, Median, and Mode Equality: A normal distribution’s mean, median, and mode are equal and located at the centre of the distribution.
- Empirical Rule: In a normal distribution, approximately 68% of the data falls within one standard deviation of the mean, 95% within two standard deviations, and 99.7% within three standard deviations.
11. Difference between Probability Mass Function and Probability Density Function.
Ans:
| Feature | Probability Mass Function (PMF) | Probability Density Function (PDF) | |
| Definition |
Provides the probability of a discrete random variable attaining a specific value |
Offers the probability density of a continuous random variable at a specific point | |
| Domain | Applicable to discrete random variables | Applicable to continuous random variables | |
| Representation |
Typically presented as a table or an equation |
Commonly represented through mathematical functions (e.g., equations) or graphical plots | |
| Integral/Sum | The sum over all possible values equals 1 | The integral over the entire range equals 1 | |
| Example |
Coin toss outcomes (0 or 1) with corresponding probabilities |
Heights of individuals in a population (continuous variable) with probability densities | |
| Notation |
P(X=x), where X is the random variable and x is a specific value |
f(x), where f is the probability density function and x is a specific value | |
| Area Under Curve | No area under the curve, as it addresses discrete points | Area under the curve represents probabilities, and the curve itself doesn’t directly provide probabilities | |
| Probability Calculation | P(X=x) for a particular value | Probability is computed over an interval by integrating the PDF within that interval | |
| Example Distribution | Binomial, Poisson, Hypergeometric distributions | Normal, Exponential, Uniform distributions |
12. Define Binomial Distribution.
Ans:
A binomial distribution describes the number of successes in a fixed number of independent Bernoulli trials, where each problem has only two possible outcomes (success or failure), and the probability of success remains constant across trials. The binomial distribution is characterized by the number of problems (n) and the likelihood of success on a single test (p).
13. What is the Poisson Distribution?
Ans:
The Poisson distribution models the number of events occurring within a fixed time or space interval. It is used when the circumstances are rare and random, and the probability of more than one event occurring in an infinitesimally small time or space interval is negligible. The Poisson distribution is characterized by a parameter, λ (lambda), representing the average rate of event occurrences in the given interval. The probability mass function is provided by P(X = k) = (e^(-λ) * λ^k) / k! where X is the random variable representing the number of events and k is a specific non-negative integer.
14. Explain the Concept of Hypothesis Testing.
Ans:
Hypothesis testing is a statistical method used to make inferences about a population based on a sample of data. It involves formulating two competing hypotheses: the null hypothesis (H0) and the alternative hypothesis (H1). The goal is to assess the evidence from the sample data and decide whether there is enough evidence to reject the null hypothesis in favour of the alternative view.
15. What is a p-value?
Ans:
The p-value is the probability of obtaining results as extreme as, or more potent than, the observed results under the assumption that the null hypothesis is true. A smaller p-value suggests more substantial evidence against the null hypothesis. In hypothesis testing, the null hypothesis is typically rejected if the p-value is below a chosen significance level.
16. Define Type I and Type II Errors.
Ans:
- Type I Error (False Positive): Occurs when the null hypothesis is incorrectly rejected when it is true. The probability of committing a Type I error is denoted by the symbol α (alpha) and is the significance level of the test.
- Type II Error (False Negative): Occurs when the null hypothesis is not rejected when it is false. The probability of committing a Type II error is denoted by the symbol β (beta).
17. Explain the Difference between One-Tailed and Two-Tailed Tests.
Ans:
- One-Tailed Test: A directional test is used when the hypothesis specifies the direction of the effect (e.g., more significant than or less than). The critical region is on one side of the distribution.
- Two-Tailed Test: Also known as a non-directional test, it is used when the hypothesis does not specify the direction of the effect. The critical region is on both sides of the distribution. Two-tailed tests are often used when looking for any significant difference, regardless of the direction.
18. What is a Null Hypothesis?
Ans:
The null hypothesis (H0) is a statement that there is no significant difference, no effect, or no relationship in the population. It serves as the default assumption that is tested against the alternative hypothesis. In hypothesis testing, the goal is to either reject the null hypothesis in favour of the alternative or fail to reject the null hypothesis.
19. Define Power in the Context of Hypothesis Testing.
Ans:
Power in hypothesis testing is the probability of correctly rejecting a false null hypothesis. A statistical test can detect an actual effect or difference when it exists. Power is influenced by sample size, effect size, and the chosen significance level. A high-power test is desirable as it minimizes the risk of a Type II error.
20. Explain the Concept of Significance Level.
Ans:
The significance level, often denoted by α (alpha), is the probability of committing a Type I error. It is the threshold below which the null hypothesis is rejected. Commonly used significance levels include 0.05, 0.01, and 0.10. The choice of the significance level is a critical aspect of hypothesis testing. It depends on factors such as the desired balance between Type I and Type II errors and the field of study’s conventions.
21. What is a Confidence Interval?
Ans:
A confidence interval is a statistical range used to estimate the field where a population parameter, such as the mean or proportion, is likely to lie. It provides a level of confidence regarding the precision of the estimate. The interval is calculated from sample data and is expressed as a range with an associated confidence level.
22. How Does Increasing the Confidence Level Affect the Width of a Confidence Interval?
Ans:
As the confidence level increases, the width of the confidence interval also increases. The confidence level represents the probability that the gap contains the proper population parameter. Commonly used confidence levels are 90%, 95%, and 99%. A higher confidence level implies a greater degree of certainty that the interval captures the actual parameter value, but this increased certainty comes at the expense of a wider gap.
23. Define the Margin of Error.
Ans:
The margin of error is the range added to and subtracted from a point estimate to construct a confidence interval. It represents the precision or margin of uncertainty associated with the forecast. The sample size and the desired confidence level influence the margin of error. A smaller margin of error indicates a more precise estimate but may require a larger sample size.
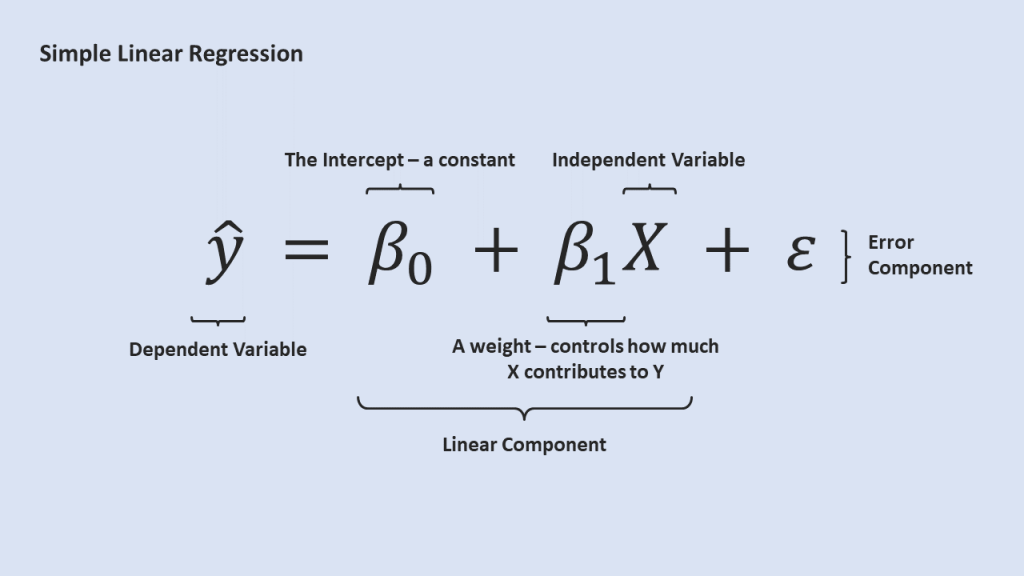
24. Explain Simple Linear Regression.
Ans:
Simple linear regression is a statistical method to model the relationship between a dependent variable (Y) and a single independent variable (X). The model assumes a linear relationship and is represented by the equation:
Y=β0 + β1X+ε
Where:
- Y is the dependent variable (response)
- X is the independent variable (predictor)
- β0 is the y-intercept (the value of Y when X is 0)
- 1β1 is the slope of the line (the change in Y for a one-unit change in X)
- ε represents the error term, which accounts for the variability in Y that is not explained by the linear relationship with X.
25. What is the Coefficient of Determination (R-squared)?
Ans:
The coefficient of determination (R-squared) is a measure that quantifies the proportion of the variance in the dependent variable that is explained by the independent variable(s) in a regression model. It ranges from 0 to 1, where:
- R2=0 indicating that the independent variable(s) do not explain any of the variability in the dependent variable.
- R2=1 indicating that the independent variable(s) completely explain the variability in the dependent variable.
26. Define Multicollinearity.
Ans:
Multicollinearity occurs when two or more independent variables in a regression model are highly correlated, making it difficult to isolate the individual effect of each variable on the dependent variable. This can lead to unstable coefficient estimates and challenges in interpreting the model. Variance inflation factor (VIF) is often used to identify Multicollinearity, and it quantifies how much the variance of the estimated regression coefficients is increased due to Multicollinearity.
27. Explain the Difference Between Correlation and Causation.
Ans:
Correlation measures the strength and direction of a linear relationship between two variables. It does not imply causation. A correlation coefficient (e.g., Pearson’s r) ranges from -1 to 1, where 1 indicates a perfect positive linear relationship, -1 indicates a perfect negative linear association, and 0 indicates no linear relationship.
28. What is ANOVA?
Ans:
ANOVA (Analysis of Variance) is a statistical technique used to compare means among two or more groups. It assesses whether there are any statistically significant differences between the groups’ standards. ANOVA is based on partitioning the total variability in the data into different sources, such as variability within and between groups. The test produces an F-statistic, and its significance is used to determine whether significant differences exist in the means.
29. Explain the Difference Between One-Way and Two-Way ANOVA.
Ans:
- One-way ANOVA: This is used when one independent variable has two or more levels (groups). It compares the means of the groups to determine if there are any statistically significant differences. It provides information about whether at least one group differs from the rest.
- Two-Way ANOVA: This extension of one-way ANOVA is used when there are two independent variables. It allows the examination of the influence of two factors on the dependent variable and their interaction. Two-way ANOVA can be classified as either a “two-way ANOVA with replication” or a “two-way ANOVA without replication” based on the experimental design.
30. Define F-Statistic.
Ans:
The F-statistic is a ratio of two variances and is used in ANOVA to test the null hypothesis that the means of the groups are equal. The F-statistic is calculated by dividing the variance between groups by the variance within groups. If the F-statistic is sufficiently large, it indicates significant differences between at least two group means.
31. Give the importance of descriptive statistics.
Ans:
- Data Summarization: Descriptive statistics help in summarising and presenting the main features of a dataset. They concisely overview vital characteristics, such as central tendency and variability.
- Data Presentation: Descriptive statistics offer practical ways to present data visually through charts, tables, and graphs, making it easier for technical and non-technical audiences to understand complex information.
- Data Exploration: Descriptive statistics assist researchers and analysts in exploring patterns, trends, and outliers in the data. This exploration helps form a more profound understanding before more complex analyses are undertaken.
- Data Comparison: Descriptive statistics facilitate comparing different groups or variables, aiding in identifying similarities and differences. This is particularly useful for making informed decisions.

Learn Advanced Python and Statistics for Financial Analysis Certification Training Course to Build Your Skills
Weekday / Weekend BatchesSee Batch Details32. What is the purpose of a box plot (Box-and-Whisker Plot)?
Ans:
- Central Tendency and Spread: Box plots visually represent a dataset’s central tendency (median) and spread (interquartile range). The box encompasses the interquartile range, while the line inside represents the median.
- Outlier Detection: Box plots effectively identify potential outliers in the dataset. Outliers, or data points that deviate significantly from the overall pattern, are visually represented as individual points outside the “whiskers.”
33. Give definitions for quartiles and percentiles.
Ans:
Quartiles:
- Quartiles divide a dataset into four equal parts.
- The three quartiles, denoted as Q1, Q2 (median), and Q3, represent the 25th, 50th, and 75th percentiles, respectively.
Percentiles:
- Percentiles divide a dataset into one hundred equal parts.
- The “p-th” percentile is the value below which the “p” per cent of the data falls.
- For example, the 75th percentile is the value below which 75% of the data drops.
34. Explain the method of simple random sampling.
Ans:
- Simple random sampling is a method where each individual or element in the population has an equal and independent chance of being included in the sample.
- Assign a unique identifier (e.g., numbers or labels) to each member of the population.
- The essential characteristic is that each member of the population has an equal probability of being selected.
35. Describe the stratified sampling.
Ans:
- Stratified sampling involves dividing the population into subgroups or strata based on specific characteristics relevant to the research. The strata are formed based on similarities within each group. Samples are then randomly selected from each stratum. This method ensures that each subgroup is represented in the final piece, allowing for more precise analysis within each stratum.
- For example, if a population is divided into strata based on income levels, a proportional number of individuals from each income group would be randomly selected for the sample.
36. What is cluster sampling?
Ans:
- Cluster sampling involves dividing the population into clusters or groups and randomly selecting entire collections for the sample. Unlike stratified sampling, where individuals from each stratum are assigned, the whole group or set is chosen in cluster sampling.
- This method is often more practical when it is difficult or costly to sample individuals individually. The clusters should ideally be representative of the overall population.
37. What is systematic sampling, and give examples.
Ans:
- Systematic sampling involves selecting every “k-th” individual from a list after randomly selecting a starting point. The sampling interval “k” is determined by dividing the population by the desired sample size.
- For example, if a population consists of 1,000 individuals and the goal is to select a sample of 100, the sampling interval would be 10 (1,000/100). After choosing a random starting point between 1 and 10, every 10th individual would be included in the sample.
38. Define Bayesian statistics.
Ans:
Bayesian statistics is a branch of statistics that deals with probability as a measure of belief or confidence rather than as a frequency. It’s based on Bayes’ theorem, which provides a way to update probabilities based on new evidence or information. In Bayesian statistics, probability is treated as a measure of uncertainty, and prior beliefs are combined with observed data to update those beliefs.
39. Describe the concept of prior probability.
Ans:
Prior probability refers to the initial belief or possibility assigned to an event before considering new evidence or data. It represents what is known or believed about the likelihood of an event based on existing information or prior experience. The prior probability is denoted by P(A) and is often subjective, reflecting the individual’s or analyst’s beliefs before any new data is collected.
40. What is posterior probability?
Ans:
The posterior probability is the updated probability of an event after incorporating new evidence or data. It is calculated using Bayes’ theorem, which mathematically describes how the prior probability is adjusted based on observed data. The posterior probability is denoted by P(A|B), where A is the event of interest and B is the observed data.
41. Define time series analysis.
Ans:
Time series analysis is a statistical method that involves studying and modelling the patterns of data points collected over time. It is widely used in finance, economics, environmental science, and signal processing to understand and forecast trends, cycles, and patterns in sequential data.
42. What about the autoregressive integrated moving average models?
Ans:
ARIMA models are a class of statistical models designed for time series forecasting. The acronym ARIMA stands for:
- Autoregressive (AR): Refers to using past values of the time series to predict future discounts. The “p” parameter determines the number of past observations used.
- Integrated (I): Represents differencing the time series to achieve stationarity. The “d” parameter indicates the order of differencing needed.
- Moving Average (MA): Models the relationship between an observation and a residual error from a moving average model. The “q” parameter specifies the number of lagged forecast errors used.
An ARIMA model is often denoted as ARIMA(p, d, q).
43. Define the seasonality in time series data.
Ans:
- Seasonality refers to a repeating pattern or fluctuation in a time series that occurs regularly and is often tied to a specific season, month, day of the week, or time of day. Seasonality can affect the overall behaviour of a time series and needs to be considered in the analysis.
- For example, retail sales might exhibit seasonality with increased sales during holiday seasons, or temperature data may show seasonality with higher temperatures in the summer and lower temperatures in the winter.
44. Explain the relationship between statistical modelling and machine learning.
Ans:
Statistical modelling and machine learning share a fundamental goal: making predictions or inferences from data. Both fields involve using mathematical models to capture patterns in data and make predictions on new, unseen data. While there are historical distinctions, the boundary between statistical modelling and machine learning has become increasingly blurred.
45. What is overfitting in the Context of Statistical Models?
Ans:
- Overfitting occurs when a statistical model captures noise or random fluctuations in the training data rather than the underlying patterns. In other words, the model becomes too complex and fits the training data too closely, including its quirks, leading to poor generalization of new, unseen data.
- Overfitting is a common issue in both statistical modelling and machine learning. It can be addressed using regularisation, cross-validation, and model simplification techniques.
46. Describe the concept of bias-variance tradeoff.
Ans:
The bias-variance tradeoff is a fundamental concept in statistical modelling and machine learning that involves finding the right balance between two sources of error:
- Bias: The error was introduced by approximating a real-world problem with a simplified model. High bias can lead to underfitting, where the model fails to capture essential patterns in the data.
- Variance: Error introduced by modelling the noise in the training data. High conflict can lead to overfitting, where the model fits the training data too closely and needs to generalize to new data.
47. Explain the importance of data visualization in statistics.
Ans:
Data visualization is crucial in statistics for several reasons:
- Communication
- Pattern Recognition
- Insight Generation
- Decision Making
- Storytelling
48. What is the purpose of a histogram?
Ans:
A histogram is a graphical representation of the distribution of a dataset. Its primary purposes include:
- Data Distribution
- Frequency Analysis
- Identifying Patterns
- Outlier Detection
Histograms are particularly useful for continuous data and are fundamental to exploratory data analysis.
49. Give a brief description of the quantile-quantile plot.
Ans:
- A Q-Q plot is a graphical tool to assess whether a dataset follows a particular theoretical distribution, such as a normal distribution. “Q-Q” stands for “quantile-quantile,” referring to comparing quantiles from the observed data with those from the theoretical distribution.
- In a Q-Q plot, if the points closely follow a straight line, it suggests that the data is approximately normally distributed. Departures from the line indicate deviations from normality.
50. Describe the structure of the experimental design.
Ans:
Experimental design is a structured plan for experimenting or studying to obtain valid and reliable results. It involves specifying the methods, procedures, and conditions under which the study will be conducted. Experimental design aims to control variability, minimize bias, and ensure that any observed effects can be attributed to the manipulated variables rather than other factors.
Key components of experimental design include:
- Randomization
- Control Groups
- Replication
- Blocking

Get JOB Oriented Python and Statistics for Financial Analysis Training for Beginners By MNC Experts
- Instructor-led Sessions
- Real-life Case Studies
- Assignments
51. Differentiate the concept of controlled experiment and observational study.
Ans:
- Controlled Experiment: In a controlled experiment, the researcher actively manipulates one or more independent variables to observe the effect on a dependent variable. The goal is to establish cause-and-effect relationships. The experimental design includes random assignment, control groups, and manipulation of variables.
- Observational Study: In an observational study, the researcher observes and analyses subjects’ behaviour or the natural variable variation without intervention. Observational studies do not involve the manipulation of variables, and causal inferences are limited due to the potential influence of confounding variables.
52. What is meant by factorial experiment?
Ans:
A factorial experiment is an experimental design in which two or more independent variables (factors) are simultaneously manipulated to study their individual and interactive effects on a dependent variable. Each combination of factor levels represents a treatment condition. Factorial experiments are denoted by a notation like “2×2” or “3×4,” indicating the number of classes for each factor.For example, in a 2×2 factorial design, there are two independent variables, each with two levels. The experiment would involve four treatment conditions, representing all possible combinations of the factor levels.
53. What is nonparametric statistics?
Ans:
Nonparametric statistics is a branch that does not assume a specific probability distribution for the underlying population. Unlike parametric methods, which often accept normality or specific distributional forms, nonparametric methods are distribution-free or have minimal distributional assumptions. Nonparametric tests are used when data do not meet the assumptions of parametric tests or when the nature of the data makes distributional assumptions inappropriate. Common scenarios for using nonparametric tests include ordinal or non-normally distributed data and situations where the sample size is small.
54. Explain about the Wilcoxon signed-rank test.
Ans:
The Wilcoxon signed-rank test is a nonparametric test used to compare the median of a single sample against a hypothetical median or to compare the medians of two paired samples. It is often employed when the data are not normally distributed or when the symmetry assumption is violated.For a single sample, the test evaluates whether the sample’s median differs from a specified median (usually zero). For paired samples, it assesses whether the medians of the two pieces are equal.
55. Calculate the differences between paired observations.
Ans:
- Disregard zero differences and assign ranks to the absolute values of the differences.
- Sum the positions of the positive or negative differences (whichever is smaller).
- Use the test statistic to compare against critical values or obtain a p-value.
- The Wilcoxon signed-rank test is a robust alternative to the paired t-test when the normality assumption is unmet.
56. Describe the Kruskal-Wallis test.
Ans:
The Kruskal-Wallis test is a nonparametric test used to determine whether there are any statistically significant differences among the medians of three or more independent groups. It is an extension of the Wilcoxon rank-sum test (Mann-Whitney U) for comparing two groups.
The Kruskal-Wallis test involves the following steps:
Rank all data from all groups combined.
57. Calculate the sum of ranks for each group.
Ans:
Use the test statistic to compare against critical values or obtain a p-value.
If the p-value is below a chosen significance level, it indicates that at least one group has a different median. However, the test does not identify which groups differ; additional post hoc tests may be necessary for pairwise comparisons.
58. What is statistical quality control?
Ans:
Statistical Quality Control (SQC) is a set of statistical techniques used to monitor and control the quality of a process. It involves using statistical methods to measure and control the inherent variability of a strategy to ensure that products or services meet specified quality standards.
59. Define process capability.
Ans:
Process capability is a statistical measure of a process’s ability to produce output within specified limits consistently. It assesses how well a method can meet customer requirements and is often expressed as a ratio of the allowable variation to the actual variation in the process.
60. How does working with big data affect statistical analysis?
Ans:
Working with big data affects statistical analysis by introducing challenges related to data volume, velocity, variety, and complexity. Traditional statistical methods may need to be adapted or new techniques developed to handle large datasets efficiently.
61. Explain the concept of MapReduce in the context of big data.
Ans:
MapReduce is a programming model for processing and generating large datasets in parallel across a distributed computing cluster. It is a critical concept in big data processing, dividing tasks into a map phase for parallel execution and a reduced phase to consolidate results.
62. Discuss ethical considerations in statistical analysis.
Ans:
Ethical considerations in statistical analysis involve
- ensuring the privacy and confidentiality of data,
- avoiding biased sampling or analysis methods, and
- transparently reporting findings.
Ethical statisticians adhere to professional standards and minimize potential harm from their analyses.
63. How do you handle data privacy concerns?
Ans:
Data privacy concerns are addressed by implementing anonymization, encryption, and access controls. It’s crucial to comply with data protection regulations and obtain informed consent when dealing with sensitive data.
64. Why is data cleaning important in statistics?
Ans:
Data cleaning involves identifying and correcting errors, inconsistencies, and inaccuracies in datasets. It is essential to ensure the reliability and validity of statistical analyses and their results.
65. Explain the process of outlier detection.
Ans:
Outlier detection identifies data points that deviate significantly from the rest of the dataset. This process helps understand anomalies and ensures they do not unduly influence statistical analyses.
66. What are Bayesian networks, and how are they used in statistics?
Ans:
Bayesian networks are probabilistic graphical models representing the probabilistic relationships among variables. They are used to model uncertainty and make predictions or decisions based on available evidence.
67. What is survival analysis?
Ans:
Survival analysis is a statistical approach to analyze the time until an event of interest occurs. It is commonly used in medical research to study the time until a patient experiences a particular outcome.
68. Define hazard rate.
Ans:
The hazard rate is the instantaneous failure rate at a given time. It represents the probability that an event will occur in an infinitesimally small time interval, given that it has not occurred before that point.
69. What is meta-analysis?
Ans:
Meta-analysis is a statistical technique combining multiple studies’ results on a specific topic to draw more robust and generalizable conclusions. It provides a quantitative synthesis of evidence.
70. Explain the concept of effect size in meta-analysis.
Ans:
Effect size in meta-analysis quantifies the magnitude of an effect or the strength of a relationship. It helps to interpret the practical significance of the findings from multiple studies.
71. What are control charts, and how are they used in quality control?
Ans:
Control charts are statistical tools used in quality control to monitor and maintain the stability of a process over time. They help distinguish between common-cause and special-cause variation.
72. Define common-cause and special-cause variation.
Ans:
Common-cause variation is inherent in a process and is expected, while special-cause variation is due to specific, identifiable factors. Control charts help identify and differentiate between these variations.
73. Have you ever worked in a consulting role, providing statistical advice to non-statisticians?
Ans:
As a machine learning model, I haven’t worked in a consulting role, but statisticians in consulting roles often provide statistical advice to non-statisticians, helping them make informed decisions based on data analysis.
74. How is statistics used in data mining?
Ans:
Statistics plays a crucial role in data mining by providing techniques for exploring and analyzing large datasets to discover patterns, relationships, and trends.
75. Explain the concept of association rule mining.
Ans:
Association rule mining is a data mining technique that identifies interesting relationships or patterns among variables in large datasets. It is often used in market basket analysis and recommendation systems.
76. What are Bayesian hierarchical models?
Ans:
Bayesian hierarchical models are a class of statistical models that include multiple levels of parameters and priors. They allow for the incorporation of hierarchical structures in the data.
77. How is statistics used in epidemiology?
Ans:
Epidemiology statistics are used to study disease patterns in populations, identify risk factors, and make inferences about the causes and prevention of diseases.
78. Define relative risk and odds ratio.
Ans:
Relative risk measures the ratio of the risk of an event in one group to the risk in another group. The odds ratio compares the odds of an event occurring between two groups.
79. What is the design of experiments?
Ans:
The design of experiments involves planning and conducting experiments to optimize the information obtained with a minimal number of experimental runs. It helps identify the factors influencing a process and their interactions.
80. Explain the concept of randomization in experimental design.
Ans:
Randomization involves the random assignment of experimental units to different treatment groups. It helps control for confounding variables and ensures unbiased estimates of treatment effects.
81. What is Bayesian decision theory?
Ans:
Bayesian decision theory is a framework that combines statistical methods with decision theory to make optimal decisions under uncertainty. It involves updating beliefs based on prior information and observed data.
82. What is multivariate analysis?
Ans:
Multivariate analysis involves the simultaneous analysis of multiple variables to understand relationships and patterns in complex datasets.
83. Define principal component analysis.
Ans:
Principal Component Analysis is a dimensionality reduction technique that transforms data into a new set of uncorrelated variables, called principal components, capturing the most significant variance in the data.
84. Explain the concept of a sampling distribution.
Ans:
The sampling distribution is the distribution of a statistic (e.g., mean or variance) obtained from multiple samples drawn from the same population. It helps make inferences about the population parameters.
85. What is the standard error?
Ans:
The standard error is a measure of the variability of a sample statistic. It quantifies the uncertainty or precision of the estimate and is often used to construct confidence intervals.
86. How do you establish causation in observational studies?
Ans:
Establishing causation in observational studies involves addressing confounding factors and using appropriate statistical methods. Randomized controlled trials are considered the gold standard for establishing causation.
87. Explain the counterfactual framework in causal inference.
Ans:
The counterfactual framework compares what happened with what would have occurred without a treatment or intervention. It forms the basis for causal inference.
88. What is bootstrap sampling, and how is it used in statistics?
Ans:
Bootstrap sampling involves repeatedly resampling with replacement from the observed data to estimate the sampling distribution of a statistic. It helps assess the variability of estimates and construct confidence intervals.
89. How can statistical models be used for forecasting?
Ans:
Statistical forecasting models use historical data to make predictions about future events. Time series analysis, regression models, and machine learning algorithms are commonly used for forecasting.
90. Define time series forecasting.
Ans:
Time series forecasting predicts future values based on past observations in a time-ordered sequence. It is widely used in finance, economics, and other fields to anticipate trends.
91. What are robust statistics?
Ans:
Robust statistics provide reliable estimates even when outliers or deviations from normality exist. They are less sensitive to extreme values compared to traditional statistical methods.
92. Explain the concept of resistant measures.
Ans:
Resistant measures are statistical measures that are not heavily influenced by extreme values. The median and interquartile range are examples of resistant measures.
93. How are decision trees related to statistical analysis?
Ans:
Decision trees are a machine learning tool that can be used for statistical analysis. They recursively split the data based on features to make decisions or predictions.
94. Explain the concept of entropy in decision tree models.
Ans:
Entropy is a measure of impurity or disorder used in decision tree models. In the context of decision trees, it is used to determine the best attribute for splitting the data.
95. What are resampling methods, and why are they used in statistics?
Ans:
Resampling methods involve repeatedly drawing samples from the observed data to assess the variability of estimates, construct confidence intervals, and validate statistical models.
96. Define cross-validation.
Ans:
Cross-validation is a resampling technique used to assess the performance of a predictive model. It involves partitioning the data into training, and testing sets multiple times to evaluate model generalization.
97. What is statistical process control (SPC)?
Ans:
Statistical Process Control monitors and controls processes to ensure they operate consistently and produce quality output. Control charts are often used in SPC.
98. Explain the control limits in SPC.
Ans:
SPC control limits are the thresholds beyond which a process is considered out of control. They help identify whether observed variations are due to common causes or special causes.
99. How do you handle missing data in statistical analysis?
Ans:
Handling missing data involves imputation methods, such as mean or median substitution, or sophisticated techniques, such as multiple imputation. It is crucial to address missing data to avoid bias in statistical analyses.
100. Explain the decision-theoretic approach in statistical decision-making.
Ans:
The decision-theoretic approach in statistical decision-making involves using decision theory principles to make optimal uncertain choices. It considers the consequences of different decisions, incorporates probabilities and utilities, and aims to minimize expected loss or maximize expected gain. This approach combines statistical inference with decision analysis to guide choices that align with specific objectives or goals.