Last updated on 17th Nov 2021| 4323
Data Science with R involves using the R programming language for analyzing data, building statistical models, and implementing machine learning algorithms. It’s widely used in various industries for tasks such as data visualization, exploratory data analysis, and predictive analytics. R’s extensive library ecosystem supports a range of statistical techniques, making it a powerful tool for extracting insights from complex datasets. Mastering Data Science with R equips professionals with skills essential for interpreting data trends.
1. In Data Language, define “data import.”
Ans:
Data import refers to the process of loading data from external sources into a software environment. This can involve reading data files, such as CSV, Excel, or databases, into a programming language or analysis tool. In R, data import functions like read.csv() and read. Table () and readxl::read_excel () are commonly used. Proper data import ensures that data is correctly formatted and ready for analysis.
2. What is R?
Ans:
R is a programming language and software environment for graphics and statistical computing. Statisticians, data analysts, and researchers extensively use it for data manipulation, computation, and graphical display. Numerous statistical methods are available in R, such as time-series analysis, clustering, classification, and both linear and nonlinear modeling. Because it’s open-source, users can add packages to increase its functionality.
3. In R, how many missing and impossible values are feasible to represent?
Ans:
- NA stands for missing values in R. (Not accessible). NA stands for missing values in R. (Not accessible), and impossible values, such as undefined mathematical operations, are represented by NaN (Not a Number).
- Additionally, R includes Inf and -Inf for positive and negative infinity, respectively.
- These unique values allow R to handle incomplete or erroneous data gracefully.
- NA can be used for missing data in all data types, while NaN typically results from operations like 0/0.
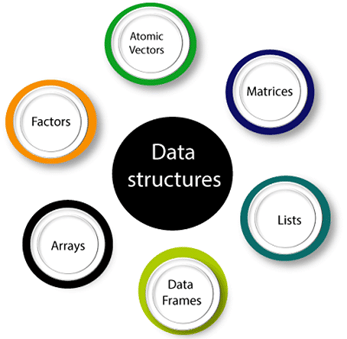
4. How many information structures are there in the R dialect?
Ans:
R has several fundamental data structures: vectors, matrices, arrays, data frames, and lists. Vectors are the most basic and can hold elements of the same type. Matrices are two-dimensional, while arrays can have more than two dimensions, both containing elements of the same kind. Data frames are tabular data structures where columns can be of different types, suitable for statistical datasets.
5. Describe how to use the R language to communicate data analysis results.
Ans:
In R, can communicate data analysis results through a combination of text, tables, and visualizations. Functions like print(), summary(), and str() provide textual summaries of data and analysis outcomes. For tables, functions like kable() from the knitr package can format data frames into readable tables. Visualization tools, such as ggplot2, enable the creation of informative and aesthetically pleasing graphs.
6. Regarding the given R code, what is the estimated value of f (2)?
Ans:
To determine the estimated value of f(2) from a given R code, need to examine the function definition. Suppose the function f is defined as f <- function(x) { x^2 + 3*x + 2 }. Then, f(2) is calculated by substituting 2 for x in the expression. The calculation is 2^2 + 3* 2 + 2, which equals 4 + 6 + 2 = 12. Therefore, the estimated value of f(2) is 12. Ensure to understand the function’s logic to substitute and solve for any input value correctly.
7. What is the most effective strategy to combine R and Hadoop for analysis?
Ans:
- Using packages like RHadoop, RHive, or Sparkly is the most effective strategy for combining R and Hadoop for analysis.
- These packages allow R to interface with Hadoop and Spark, leveraging their data processing capabilities, facilitating distributed data processing and machine learning.
- RHadoop provides access to HDFS and MapReduce functionalities, while RHive enables integration with Hive, allowing SQL-like queries on Hadoop data.
8. What distinguishes a lattice in R from an information outline?
Ans:
- In R, a lattice is a powerful graphics system provided by the lattice package. It is used to create trellis graphs, which are helpful for conditioning plots on one or more variables.
- Lattice graphics are based on a formula interface, allowing the creation of complex. Data frames are used for data manipulation and analysis, while lattice graphics are used for visualizing data.
- An information outline or a data frame is a structure similar to a table that holds data in rows and columns, each of which may include various data types.
9. Figure Variable R Dialects: What Are They?
Ans:
In R, figure variables, or graphical parameters, control the appearance of plots. These include settings like pch (plotting character), col (color), lty (line type), (line width), and from (multi-figure row). These parameters can be set globally using the par() function or individually within plotting functions. Adjusting these parameters allows for the customization of plots to improve readability and aesthetics.
10. What is the difference between R and Python for data analysis?
Ans:
| Aspect | R | Python |
|---|---|---|
| Historical Background | Developed for statistical computing and analysis. | Originally a general-purpose language; evolved with data analysis libraries. |
| Syntax and Approach | Concise syntax for statistical analysis and data manipulation. | General-purpose syntax; suitable for diverse tasks beyond statistics. |
| Ecosystem and Libraries | Extensive packages for statistical modeling (e.g., ggplot2, dplyr). | Comprehensive libraries for various data science tasks. |
| Community and Support | Strong community in academia and statistics; support for statistical methodologies. | Large and diverse community; support across industries and domains. |
11. What is the maximum value in R?
Ans:
- In R, the maximum value that can be represented for numerical data is determined by the system’s double-precision floating-point representation.
- Typically, this value is around 1.797693e+308, which can be accessed using—machine$double.xmax.
- For integers, the maximum value is platform-dependent but generally around 2^31 – 1, which is 2147483647.
- This limit is due to the 32-bit integer representation used in most systems. When handling huge numbers, it’s essential to consider the precision and possible overflow issues.
12. How to test and troubleshoot R programming code?
Ans:
- Several approaches can be used to test and troubleshoot R code.
- Start by using the print and cat functions to output variable values and checkpoints within the code.
- Use the debug, browser, and traceback functions to iterate through the code and locate any errors.
- Additionally, the test package helps create unit tests to validate code functionality.
- For larger projects, consider integrating continuous integration tools like Travis CI to automate testing.
- RStudio provides built-in debugging tools that offer breakpoints and variable inspection features.
13. Whats the difference between supply and apply?
Ans:
Supply and apply are both functions used to run a function across a vector or list. Apply always returns a list, regardless of the output of the applied function. In contrast, supply attempts to simplify the result into an array or matrix if possible. For example, applying apply to a list of numbers with a function that returns their squares will give a list of squared numbers. Using apply for the same operation might return a vector if the simplification is possible.
14. What does K-closest neighbor mean?
Ans:
The K-Closest Neighbor (KNN) algorithm is a non-parametric, instance-based learning method used for classification and decline. To function, it finds the “k” that is most comparable. Instances (neighbors) to a given query instance based on a distance metric, typically Euclidean distance. For classification, the majority class among the neighbors determines the class of the query instance. For regression, the average value of the neighbors is used to predict the query instance’s value.
15. Keep seq (6) and seq_along (6) apart.
Ans:
- seq(6) generates a sequence of numbers from 1 to 6. It is a straightforward function call that creates a vector of integers starting at 1 and ending at the specified number.
- In contrast, seq_along(6) is used to create a sequence along the length of an object.
- If 6 is treated as an object (like a single number), seq_along(6) returns 1 since it generates a sequence of length one.
- However, if applied to a vector (e.g., seq_along(c(1,2,3,4,5,6))), it will return 1:6, similar to seq(6).
16. How are users going to read a.csv file in the R dialect?
Ans:
- To read a .csv file in R, use the read.csv function. First, specify the file path as an argument, such as data <- read.csv(“path/to/your/file.csv”).
- Can customize the reading process with additional parameters, like a header to specify whether the first row contains column names and a sep to define the delimiter.
- For example, data <- read.csv(“file.csv”, header = TRUE, sep = “,”). If the file is large, consider using the data—table::fread function for faster performance.
17. What drawbacks does R programming have?
Ans:
R has several drawbacks. It can be memory-intensive, making it challenging to work with massive datasets without specialized packages like data. Table. The language’s syntax and diverse functions can have a steep learning curve for beginners. R’s single-threaded nature can limit its performance in computationally heavy tasks. Additionally, R’s error messages can sometimes be cryptic, complicating debugging for new users. R also has fewer built-in support and integration options compared to more modern languages like Python.
18. What benefits does R offer?
Ans:
R offers numerous benefits for data analysis and statistical computing. It has a vast ecosystem of packages available through CRAN, covering diverse areas from data manipulation to advanced machine learning. R’s graphics capabilities, especially with packages like ggplot2, provide excellent data visualization options. The language is highly extensible and supports complex mathematical computations. R’s community is strong and active, offering abundant resources and support.
19. What does the term “component reusing in R” mean?
Ans:
- Component reusing in R refers to the practice of reusing code components such as functions, packages, and modules across different projects.
- By writing modular and reusable functions, can streamline code maintenance and enhance productivity.
- Packages are a prime example of reusable components, allowing users to share and reuse code effectively.
- This approach minimizes redundancy, reduces errors, and ensures consistency across analyses.
20. What distinguishes a data frame from a matrix?
Ans:
- In R, a data frame is a collection of vectors of equal length, each of which can be of different types.
- It is similar to a table in a relational database.
- A matrix is a two-dimensional array in which all elements must be of the same type, typically numeric.
- Dataframes can hold heterogeneous data types across columns, while matrices are homogeneous.
- Dataframes have named rows and columns, allowing for more flexible data manipulation.
- In contrast, matrices are primarily used for mathematical computations.
21. What is R packages?
Ans:
R packages are sets of compiled code, data, and R functions stored in a well-defined format and used to extend R’s capabilities. Packages include reusable R code, documentation, and sample data. CRAN hosts thousands of R packages. Users can install packages using the install—packages () function. Packages are then loaded into the R environment with the library(). Users can create custom packages to share their functions and datasets, promoting collaboration and code reuse within the R community.
22. How to perform data visualization in R?
Ans:
Data visualization in R can be performed using base R graphics, lattice, and ggplot2 packages. The plot() function is used for basic plots in base R. The lattice package provides a powerful and elegant data visualization system. ggplot2 is a popular package for creating complex and multi-layered graphics. Users can customize plots with themes, scales, and germs in ggplot2. Visualization helps in understanding data patterns and insights.
23. What are the different types of joins in R?
Ans:
- Inner Join: merge(x, y, by = “key”) keeps only matching rows.
- Left Join: merge(x, y, by = “key,” all. x = TRUE) keeps all rows from the left.
- Right, Join: merge(x, y, by = “key,” all. y = TRUE) keeps all rows from the right.
- Full Join: merge(x, y, by = “key,” all = TRUE) keeps all rows from both.
24. In R, how to deal with missing data?
Ans:
- Use is. Na () to identify missing values.
- Remove missing values with na. Omit () or na. exclude().
- Replace missing values with functions like replace() or attribute () from various packages.
- Use na.rm = TRUE argument in functions to ignore missing values.
- Explore the mice package for advanced multiple imputation techniques.
- Visualize missing data patterns with the VIM package.
25. Explain the magnitude of transpose in the R dialect.
Ans:
The transpose of a matrix in R is obtained by interchanging its rows and columns, which can be done using the t() function. For a matrix A, the transpose is denoted as A’ or t(A). This operation is essential in various mathematical and statistical computations, such as solving linear equations and performing matrix algebra. In R, transposing a matrix is straightforward and efficient, enabling the reorganization of data for different analytical needs. Using the facet_wrap() function in ggplot2 allows for the creation of multiple histograms based on different groups.
26. How to create a histogram in R?
Ans:
A histogram in R can be created using the hist() function. Example: hist(data$variable) plots a histogram for the specified variable. Customize bins with the breaks argument: hist(data$variable, breaks = 20). Add titles and labels using main, xlab, and ylab arguments. Use col to change the color of the bars: hist(data$variable, col = “blue”). ggplot2 can also create histograms with geom_histogram().
27. What are some standard functions for data manipulation in R?
Ans:
- Subset (): Extract subsets of data.
- Merge (): Combine data frames by columns or rows.
- dplyr package functions: select(), filter(), mutate(), summarise(), arrange().
- reshape2 package: melt(), dcast().
- apply(), lapply(), sapply(), tapply(): Apply functions to data structures.
- tidyr package: gather(), spread() for tidying data.
28. How can one carry out linear regression in R?
Ans:
Perform linear regression in R using the lm() function. Example: model <- lm(y ~ x, data = dataset) fits a linear model. Use summary(model) to view model details, including coefficients and statistics. Check assumptions with diagnostic plots: plot(model). Predict values with predict(model, new data). To add the regression line, use abline(model) a plot. Advanced regression techniques are available in packages like glmnet.
29. Explain the use of ggplot2 in R.
Ans:
ggplot2 is a powerful package for creating complex and customizable visualizations. It uses the grammar of graphics to build plots layer by layer. Basic usage: ggplot(data, aes(x, y)) + geom_point() for scatter plots. Customize with themes, scales, and annotations: theme(), scale_x_continuous(), labs(). Combine multiple geoms: geom_line(), geom_bar(). Create faceted plots with facet_wrap(). ggplot2 excels in producing publication-quality graphics.
30. How do users merge data frames in R?
Ans:
Merge data frames in R using the merge() function. Syntax: merge(x, y, by = “key”) for a common key. Use all.x = TRUE for a left join and all.y = TRUE for a right join. All = TRUE for a full join. Specify multiple keys with by = c(“key1”, “key2”). The dplyr package offers left_join(), right_join(), inner_join(), full_join(). Ensure keys are correctly aligned and named for successful merges.
31. What are the different data types in R?
Ans:
- Numeric: Real numbers (e.g., 1, 2.5).
- Integer: Whole numbers (e.g., 1L, 2L).
- Character: Text or strings (e.g., “Hello”).
- Logical: Boolean values (TRUE or FALSE).
- Complex: Complex numbers (e.g., 1+2i).
32. How to install and load a package in R?
Ans:
- Use the install.packages(“package_name”) function.
- Put the real package name in place of “package_name.”
- To load the package, use the library(package_name) function.
- This makes the package’s functions available for use.
- Example: install.packages(“ggplot2”); library(ggplot2).
33. What is the use of the string package in R?
Ans:
The stringer package in R is used to work with strings. It provides functions that make string manipulation more accessible and more consistent compared to base R functions. It includes tasks for pattern matching, substring extraction, string splitting, and string concatenation. This package follows a consistent naming scheme and syntax, making it intuitive to use for both simple and complex string operations.
34. How to create a scatter plot in R?
Ans:
- Use the plot() function for basic plotting.
- Example: plot(x, y) where x and y are numeric vectors.
- For enhanced plots, use the ggplot2 package.
- Example: ggplot(data, aes(x = x_var, y = y_var)) + geom_point().
- Customize with additional functions like labs() and theme().
- Ensure the data is properly prepared for plotting.
35. Explain the concept of factors in R.
Ans:
- Represent categorical data.
- It can be ordered or unordered.
- Created using the factor() function.
- Store data as integers with corresponding levels.
- Useful for statistical modeling and data analysis.
- Example: factor(c(“Low,” “Medium,” “High”)).
36. How to create a bar plot in R?
Ans:
The barplot() function in R can generate a bar plot. First, prepare the data in a format suitable for plotting, then use barplot() to specify the data, labels, colors, and other parameters as needed. This function will generate a vertical or horizontal bar plot based on the specifications, displaying the data in a visually informative manner. You can customize the appearance further by adjusting parameters such as beside for side-by-side bars or ylim to set the limits of the y-axis.
37. What is the difference between a matrix and an array in R?
Ans:
- A matrix is a 2-dimensional data structure.
- An array can have one or more dimensions.
- A matrix is a particular case of an array with two dimensions.
- Created using matrix() function.
- Arrays are created using the array() function.
Example:
- matrix_example <- matrix(1:9, nrow=3, ncol=3)
- array_example <- array(1:12, dim=c(2,3,2))
38. How to perform a t-test in R?
Ans:
- Use the t.test() function.
- For one-sample t-test: t.test(x, mu = value).
- For two-sample t-test: t.test(x, y).
- For paired t-test: t.test(x, y, paired = TRUE).
- Interpret the p-value to determine significance.
- Example: t.test(c(1, 2, 3, 4, 5), mu = 3).
39. What are the benefits of using RStudio?
Ans:
Among the most well-liked integrated development environments (IDEs) are those that offer benefits such as enhanced code editing with syntax highlighting and autocomplete, an integrated R console for direct execution and visualization of results, built-in package management and documentation, and project organization features. Their user-friendly interface enhances productivity and facilitates seamless R programming.
40. How can users handle categorical data in R?
Ans:
- Use factors to represent categorical variables.
- Convert using the factor() function.
- Example: factor_var <- factor(c(“Male,” “Female,” “Male”)).
- Use levels() to view or set factor levels.
- Apply as. Factor () to convert data to factors.
- Factors are essential for statistical modeling.

Get JOB Data Science with R Training for Beginners By MNC Experts
- Instructor-led Sessions
- Real-life Case Studies
- Assignments
41. What is the use of the dplyr package in R?
Ans:
- Data manipulation and transformation.
- Functions like filter(), select(), mutate(), summarize(), and arrange().
- Simplifying complex data operations with readable syntax.
- Handling data frames and tibbles efficiently.
- Chaining operations with the pipe operator %>%.
- Enhancing performance for large datasets.
42. How can users create a box plot in R?
Ans:
The boxplot() function in R can generate a box plot. Prepare data in a format where each column represents a variable or group to be plotted, then use boxplot() to specify the data, horizontal or vertical orientation, axis labels, and other parameters as needed. This function generates a graphical summary of the distribution of data points within each group, highlighting medians, quartiles, and outliers. Can use the notch argument to create notched box plots, enhancing the interpretation of differences between groups.
43. Explain the use of the tidy package in R.
Ans:
The tidy package in R is used for data tidying, specifically for reshaping and transforming data into a neat format where Every variable is a column, every observation is a row, and every value is in its cell. It provides functions like gather() and spread() for converting between wide and long formats and separate() and unite() for splitting and combining variables. Tidy helps streamline data preprocessing tasks before analysis.
44. How to perform clustering analysis in R?
Ans:
Clustering analysis in R can be performed using various packages like stats, cluster, or factoextra. Typically, preprocess data and choose an appropriate K-means, or hierarchical clustering, which are two examples of clustering algorithms. Apply the algorithm to data using functions like means () or hclust(), and then visualize and interpret the results using plots and cluster metrics.
45. Explain the use of the apply family of functions in R.
Ans:
- Used for applying functions over margins of arrays.
- Includes apply(), lapply(), sapply(), tapply(), vapply().
- apply() works on matrices and data frames.
- apply() and sapply() work on lists and vectors.
- apply () applies functions over subsets of vectors.
- They simplify complex iterative operations.
46. How to perform time series analysis in R?
Ans:
Time series analysis in R involves loading time series data, converting it to a suitable time series object using functions like ts() or xts::xts(), visualizing the data with plots like plot() or ggplot2, and applying statistical techniques such as decomposition, forecasting (with functions like forecast()), and anomaly detection. Packages like forecast, zoo, and texts are commonly used for time series analysis tasks in R.
47. Explain the use of the lubridate package in R.
Ans:
The lubridate package in R facilitates working with dates and times by providing functions that simplify joint date-time manipulations. It allows easy extraction of components (e.g., year, month, day) from date-time objects, parsing dates from various formats, calculating differences between dates, and handling time zones. Lubricate enhances the efficiency and readability of date-time operations in R programming.
48. How to write a custom function in R?
Ans:
- Use the function keyword.
- Define the function name and parameters.
- Example: my_function <- function(arg1, arg2) { body }.
- Include the operations within the function body.
- Return the result using the return() function.
Example:
- add <- function(a, b) {
- result <- a + b
- return(result)
- }
49. What is the purpose of the reshape2 package in R?
Ans:
The reshape2 package in R is used for data reshaping and restructuring tasks. It provides functions like melt() and cast () for converting data between wide and long formats, making it easier to manipulate and analyze data frames with multiple variables and observations. reshape2 is particularly useful for data preprocessing and preparing data for further analysis or visualization.
50. How to create a pie chart in R?
Ans:
Prepare data in vector or table format, then use pie() to specify the data, labels, colors, and other parameters as needed. This function generates a circular plot divided into slices proportional to the values in data vector, providing a visual representation of the data distribution. Pie charts are helpful when displaying the relative proportions of categorical variables. Can enhance the pie chart’s readability by adding a legend and adjusting the main, cex, and border arguments to customize titles, text size, and slice borders.
51. Explain the use of the caret package in R.
Ans:
- R’s `caret} package is used to create machine learning workflows that are more efficient.
- It offers a single interface for training and assessing different models and managing preprocessing operations such as feature selection, imputation, and data splitting.
- By automating parameter tuning using resampling techniques like cross-validation, {caret} streamlines the training of models.
- Its versatility for various modeling tasks stems from its support for a large variety of algorithms from multiple R packages.
52. How to perform decision tree analysis in R?
Ans:
- Load the package and get data ready first. Next, create a decision tree model using the `report ()` function.
- Use `plot()` to visualize the tree structure and `summary()` or `printcp()` to interpret the results.
- Can use `prune()` to improve the tree’s generalization optionally by adjusting it according to complexity parameters.
- Lastly, use `predict()} to predict new data while evaluating the model’s performance using ROC curves and accuracy metrics.
53. What is the difference between a list and a vector in R?
Ans:
In R, a vector is a fundamental data structure consisting of elements of the same data type (e.g., numeric, character). It can be one-dimensional (atomic vector) or multidimensional (matrix or array). A list, on the other hand, is a collection of objects which may be of different types and structures. Lists can contain vectors, matrices, other lists, or even functions as elements. This flexibility makes lists versatile for storing and manipulating heterogeneous data compared to vectors, which are more rigid in structure.
54. How to export data from R to a CSV file?
Ans:
To export data from R to a CSV file, use the `write.csv()` function. Specify the data frame want to export as the first argument, followed by the path to the file where the CSV should be saved. For example:
- write.csv(my_data_frame, file = “path/to/my/file.csv”, row.names = FALSE)
They are setting `row. Names = FALSE` excludes row numbers from the CSV output. This straightforward function is widely used for exporting data frames to CSV format in R.
55. Explain the use of the pure package in R.
Ans:
- The `purrr` package in R enhances functional programming capabilities, especially with lists and vectors.
- It provides consistent and powerful tools, such as `map()` functions, to iterate over data structures, applying functions to each element.
- `purrr` simplifies tasks such as repetitive operations, nested data manipulation, and modeling workflows.
- It supports cleaner and more readable code, which is particularly useful for tasks involving data transformation, modeling, and analysis.
56. How to create a line plot in R?
Ans:
To create a line plot in R, use the `plot()` function with `type = “l”` argument, or Add lines to an existing plot using the `lines()` function. First, prepare data and use `plot()` with x and y axes data. Customize the plot with optional arguments like `main,` `xlab,` `ylab,` and `col` for color. For multiple lines, use `lines()` sequentially with additional data. Optionally, customize axes, add legends, or save the plot using functions like `axis(),` `legend(),` and `dev. off()`. Can enhance the visual appeal of your line plot by using the lty argument to change line types.
57. What is the use of the forecast package in R?
Ans:
- The `forecast` package in R is designed for time series forecasting.
- It provides functions and tools for automatic forecasting, model diagnostics, and visualization.
- Using methods like exponential smoothing, ARIMA models, and more advanced techniques, `forecast` aids in predicting future values based on historical data patterns.
- It includes functions for model selection (`auto.arima()`), forecast accuracy (`accuracy()`), and plotting (`plot.forecast()`), making it a comprehensive tool for time series analysis and forecasting.
58. How to perform principal component analysis (PCA) in R?
Ans:
The `prcomp()` function in R can be used to perform PCA. First, prepare numeric data matrix or data frame. Apply `prcomp()` specifying data and optional arguments like `scale. = TRUE` for scaling. Extract results such as principal components scores (`$x`), loadings (`$rotation`), and standard deviations (`$sdev`). Visualize results using biplots or scree plots. Interpret principal components based on loadings and variance explained. PCA is useful for dimensionality reduction and exploring data structure.
59. Explain the use of the stringi package in R.
Ans:
The `stringi` package in R provides powerful string manipulation functions. It handles diverse text data operations such as pattern matching (`stri_detect()`), string splitting (`stri_split()`), case conversions (`stri_trans_tolower()`), and Unicode normalization (`stri_trans_nfc()`). `stringi` ensures consistent behavior across different locales and character encodings, supporting multilingual text processing. It enhances efficiency in tasks involving text data cleaning, analysis, and preparation for natural language processing (NLP) tasks.
60. How do users handle date and time data in R?
Ans:
- In R, date and time data can be handled using the `POSIXct` class for date-time objects.
- Convert character strings to date-time format using `as.POSIXct()` or `strptime().`
- Extract components like a year, month, day, hour, minute, and second using functions (`year(),` `month(),` etc.). Format date-time objects for display or storage using `format()` with specific format codes (`%Y,` `%m`, `%d`, `%H,` `%M,` `%S`).
- Perform arithmetic operations (`difftime()`) and handle time zones (`attr(,”tzone”)`) for accurate date-time manipulations and calculations.

Develop Your Skills with Data Science with R Certification Training
Weekday / Weekend BatchesSee Batch Details61. What is the difference between data frame and tibble in R?
Ans:
- In R, a data frame is a fundamental data structure organized as a rectangular grid of data with columns of different types.
- Tibble is a modern alternative to data frames introduced in the tidyverse. It offers enhanced features such as better data printing, stricter handling of column types, and consistent behavior across operations.
- Tibbles also display only the first few rows and columns by default when printed, making them more suitable for interactive data analysis.
- Data frames are part of base R, while tibbles need to be loaded from the tidyverse package or explicitly created using tibble::tibble().
62. What is the purpose of the magrittr package in R?
Ans:
Magrittr is an R package that facilitates a more readable code style by introducing the pipe operator %>%. Its primary purpose is to enhance code readability and reduce nested function calls by allowing operations to be chained together. The pipe operator takes the result of one function and supplies it to the subsequent function as the first argument in the chain. This chaining mechanism makes complex data manipulation workflows more intuitive and easier to understand.
63. How to create a heatmap in R?
Ans:
To create a heatmap in R, typically use the heatmap() function or the geom_tile() function from ggplot2 for more flexibility. First, prepare data in a matrix or a tidy format suitable for plotting. Use the heatmap() function for a simple heatmap plot based on the matrix data, adjusting parameters for color scaling and labeling. Alternatively, with ggplot2, use geom_tile() to create a heatmap where each cell’s color represents the data value. Customize aesthetics like colors, labels, and annotations to visualize patterns in data effectively.
64. Explain the use of the zoo package in R.
Ans:
- The zoo package in R is used to work with time series data.
- It provides an infrastructure for creating, manipulating, and plotting time series objects.
- Zoo stands for “Z’s ordered observations,” emphasizing its ability to handle ordered data with irregular time intervals or missing values.
- Users can perform operations like subsetting, merging, and applying functions to time series data stored in zoo objects.
- The package also supports various plotting methods and integrates well with other time series analysis tools in R.
65. How to perform logistic regression in R?
Ans:
- Use them to carry out logistic regression in the R lm () function (generalized linear model).
- Specify the formula representing the relationship between the predictor variables and the binary response variable.
- Set the family argument to binomial to indicate logistic regression.
- Optionally, use the summary() function to view model coefficients, standard errors, and statistical significance.
- Predictions can be made using the predict() function with new data.
66. What is the difference between a for loop and an apply function in R?
Ans:
A for loop in R iterates over elements in a sequence or vector, executing a block of code for each component. The apply functions (e.g., apply(), apply (), apply (), apply ()) are higher-order functions that apply a specified function to the elements of a list, matrix, or array. Loops are more flexible but can be slower and less concise than apply functions. Apply functions offer a more streamlined approach to applying functions across data structures, promoting more transparent and more efficient code.
67. How do users perform ANOVA in R?
Ans:
- Use the above () function.
- Specify the formula representing the relationship between the response variable and the predictor variables.
- Pass the formula and data to aov() to fit the ANOVA model.
- Use summary() on the output of a () to obtain ANOVA table results showing the sources of variation, degrees of freedom, sums of squares, mean squares, F-statistics, and p-values.
- ANOVA is useful for comparing means across multiple groups and assessing the statistical significance of group differences.
68. Explain the use of the data—table package in R.
Ans:
- The table package in R extends data frames with enhanced functionality for fast data manipulation.
- It uses a special syntax and optimized algorithms to perform operations efficiently, especially on large datasets.
- Data tables support key-based indexing, which accelerates subset selection and aggregation operations.
- They offer a concise syntax similar to data frames but with additional features like an update by reference.
69. How to perform text mining in R?
Ans:
- Text mining in R involves several steps: text preprocessing, transformation, and analysis.
- Preprocess text data by removing punctuation and stopwords and performing stemming or lemmatization using packages like tm or tidy text.
- Create a DTM or term frequency-inverse document frequency (tf-idf) matrix to quantify word occurrences.
- Apply clustering or topic modeling techniques to discover patterns and topics in text data.
- Visualize results using word clouds, or network graphs to interpret and communicate findings effectively.
70. What is the use of the shiny package in R?
Ans:
The shiny package in R is used to build interactive web applications directly from R. It allows R users to create web-based dashboards, data visualizations, and interactive reports without needing to know HTML, CSS, or JavaScript. Excellent apps have a UI defined in R code and a server function that processes user inputs and generates outputs dynamically. Users can interactively explore data, change parameters, and see results in real-time within a web browser.
71. How do users create a density plot in R?
Ans:
The density function in R can be used to generate a density plot followed by the plot to visualize it. Here’s a concise example:
- # Generate some random data
- data <- norm(100)
- # Create a density plot
- plot(density(data))
This code generates a density plot of 100 random average data points.
72. Explain the concept of environments in R.
Ans:
- Environments in R are structures that hold mappings from symbols to values, akin to dictionaries in other languages.
- They help manage the scope and binding of variables.
- Environments are containers for variables and functions.
- Each environment has a parent environment, forming a hierarchy.
- They control variable scoping and resolution.
- Helpful in managing namespaces and closures in R programming.
73. How to create a violin plot in R?
Ans:
In R, can create a violin plot using the vioplot function from the vioplot package. Here’s a brief example:
- # Install and load vioplot package if not already installed
- # install.packages(“vioplot”)
- library(via plot)
- # Example: Create a violin plot of iris data
- vioplot(Sepal.Length ~ Species, data = iris)
This code generates a violin plot of Sepal. The length was grouped by species using the famous iris dataset.
74. What is the use of the lattice package in R?
Ans:
The lattice package in R provides a robust framework for creating various types of plots, such as scatter plots, bar plots, histograms, and more. It offers high-level functions to create complex plots with concise syntax. Supports conditioning plots by factors. Well-suited for exploring relationships in multi-dimensional data. Enables customization and fine-tuning of graphical elements.
75. How can users create interactive visualizations in R?
Ans:
- Use the plot_ly function to develop plots.
- Add interactivity with built-in features like tooltips and zoom.
- Customize using layout and style functions.
- Export to web-friendly formats for sharing.
76. Explain the use of the Plotly package in R.
Ans:
- Produces plots that are interactive and can be embedded in web pages.
- Allows for a large variety of customizations and plot types.
- Facilitates exploration and presentation of data with tooltips, zoom, etc.
- Helpful in creating dashboards and interactive reports.
77. How do users perform correlation analysis in R?
Ans:
In R, can perform correlation analysis using the cor function. Here’s a concise example:
- # Example: Compute correlation matrix for iris dataset
- cor_matrix <- cor(iris[, 1:4])
- # Display correlation matrix
- print(cor_matrix)
This calculates and prints the correlation matrix for numeric columns of the iris dataset.
78. What is the use of the complot package in R?
Ans:
- The corrplot package in R is used to visualize correlation matrices with customizable plots.
- Offers various plot types, such as color-coded matrices, clustered matrices, and more.
- Provides options for annotation, color palettes, and layout adjustments.
- Enhances interpretability of correlations among variables.
79. How to perform sentiment analysis in R?
Ans:
- Sentiment analysis in R can be performed using packages like tm and sentiment analysis.
- Use tm for text mining tasks, including preprocessing.
- Apply sentiment scoring functions from sentiment analysis.
- Analyze sentiment across text documents or data sets.
80. Explain the use of the tm package in R.
Ans:
The tm package in R is used for text mining tasks such as preprocessing and transforming text data into an analysis-ready format. Key functionalities include:
- Cleaning and transforming text data (e.g., removing stopwords, stemming).
- Creating document-term matrices.
- Facilitating text analysis and mining operations.
81. How to handle large datasets in R?
Ans:
Use packages like data. Table or dplyr optimized for handling large datasets efficiently. Utilize data—table’s fread() for faster reading of large CSV files. Employ chunking techniques with readr::read_csv() or data.table::fread() for memory management. Consider parallel processing using foreach or future packages to speed up computations. Use the data table’s keys and binary search capabilities for fast subsetting and merging. Optimize memory usage by removing unnecessary objects and using the data table’s set() functions for in-place modifications.
82. What is the difference between read.csv and read. The table in R?
Ans:
- read.csv is a particular case of read. Table with default settings optimized for CSV files.
- read.csv assumes a comma as the delimiter and handles factors better by default.
- Read. The table is more flexible, allowing custom delimiters and handling non-standard data formats.
- Both functions return data frames, but read.csv is more convenient for CSV files.
- Use read. Table for non-CSV files or when customizing input parameters like delimiter, header, or column classes.
83. How to create a radar chart in R?
Ans:
Use the fmsb package to create radar charts in R. Prepare data in a format suitable for radar charts (typically normalized values). Use the radar chart () function from FMSB to plot the radar chart. Customize the chart appearance using parameters like title, pfcol, plc, etc. Radar charts visualize multivariate data on a circular layout. Ensure that axes are labeled appropriately and that scaling is adjusted for unambiguous interpretation.
84. Explain the use of the flexdashboard package in R.
Ans:
Flex dashboard enables the creation of interactive dashboards using R Markdown. Integrate R code chunks, HTML widgets, and narrative text into a single document. Customize layout using flexbox layout model with responsive design. Suitable for creating reports, presentations, or interactive dashboards. Deploy dashboards as standalone web pages or embed them in more significant documents. It requires knowledge of R Markdown and essential web technologies.
85. How can users perform network analysis in R?
Ans:
- Use the graph package for network analysis in R.
- Create, manipulate, and analyze networks (graphs) with graphs.
- Import networks from various formats like edge lists or adjacency matrices.
- Visualize networks using a plot. Graph () and customize layout and appearance.
- Computer network metrics like centrality (degree, betweenness) or clustering coefficients.
86. What is the use of the graph package in R?
Ans:
Graph is a comprehensive package for network analysis and graph manipulation in R. Create graphs, compute graph-theoretic properties, and visualize networks. Import/export networks from/to various formats like edge lists, adjacency matrices, etc. Perform advanced analyses such as centrality measures, community detection, and pathfinding. Plot networks using customizable layouts and aesthetics. It is essential for studying social networks, biological networks, or any networked data structure.
87. How to create a waterfall chart in R?
Ans:
- Use the waterfall package to create waterfall charts in R.
- Prepare data in a format suitable for waterfall charts (positive and negative contributions).
- Utilize the waterfall() function from the waterfall package to generate the chart.
- Customize chart appearance using parameters like main, xlab, ylab, etc.
- Waterfall charts illustrate the cumulative effect of sequentially introduced positive or negative values.
88. Explain the use of the dygraphs package in R.
Ans:
The digraphs package is used for interactive time series visualization in R. Create and customize interactive JavaScript-based graphs directly from R. These graphs are Suitable for exploring and analyzing time series data with zoom, pan, and hover capabilities. Incorporate graphs into R Markdown documents or standalone web applications. Visualize multiple time series together and add annotations or custom range selectors.
89. How can users perform geospatial analysis in R?
Ans:
- Use packages like SF, SP, or Leaflet for geospatial analysis in R.
- sf package provides simple features for handling spatial data in R.
- Import/export spatial data formats (e.g., shapefiles) using SF functions.
- Perform spatial operations (e.g., buffering, intersection) and spatial queries.
- Visualize spatial data using ggplot2 or interactive maps with leaflets.
- Combine geospatial data with statistical analysis or machine learning in R.
90. What is the use of the SF package in R?
Ans:
- The Sf package supports simple features for spatial data representation and manipulation in R.
- Import, export, and manipulate spatial data (points, lines, polygons) efficiently.
- Integrate with Tidyverse for seamless data manipulation and visualization.
- Perform spatial operations (e.g., buffering, overlay) and geometric calculations.
- Visualize spatial data using ggplot2 or create interactive maps with leaflets.
91. How to create a funnel chart in R?
Ans:
To create a funnel chart in R, can use the funnel() function from the plotly package. First, ensure plotly is installed (install. packages(“plotly”)) and then load it (library(plotly)). Construct a data frame with stages and corresponding values. Use plot_ly() with type = “funnel” and map stages to x and values to y. Customize labels, colors, and annotations for clarity and emphasis. Finally, use layout() to adjust the chart appearance and styling if needed.
92. Explain the use of the high charter package in R.
Ans:
The high charter package enables interactive charting in R using the Highcharts JavaScript library. It facilitates the creation of interactive and visually appealing charts such as lines, bars, scatter, and more. Highchair () initializes a new chart object to which can add series and configure axes, labels, and tooltips. It supports customization through themes, tooltips, and legends, enhancing data visualization. With hc_add_series_*() functions, can add data series dynamically, making it ideal for exploring and presenting data interactively.
93. How can users perform market basket analysis in R?
Ans:
Market basket analysis in R is typically done using the rules package. First, load the package (library(rules)). Convert transaction data into a transaction object using read. transactions() or as() functions. Apply apriori() to find association rules based on support, confidence, and lift metrics. Use functions like inspect() to view generated rules and summary() for statistical summaries. Adjust parameters such as minimum support and confidence to refine results. Visualize rules with plots like plot() or customize with subsetting() and sorting() functions.
94. What is the use of the rules package in R?
Ans:
- The rules package in R is used for association rule mining and market basket analysis.
- It handles transaction data where items are grouped into sets.
- Functions like reading. Transactions () convert data into a suitable format. Apriori () generates rules based on itemset properties like support, confidence, and lift.
- Summary () provides statistical summaries of regulations. Inspect () allows detailed rule examination.
- The plot() and image() functions visualize rules and itemsets. They support rule filtering, sorting, and exporting for further analysis or integration into applications.
95. How to create a mosaic plot in R?
Ans:
Creating a mosaic plot in R involves using the mosaicplot() function from the base graphics package. First, organize categorical data into a contingency table using table() or tabs (). Then, mosaicplot() is applied to the table object, mapping variables to corresponding dimensions. Customize labels, colors, and orientation with parameters like main, col, and shade.