 LMS
Last updated on 06th Oct 2026| 7778

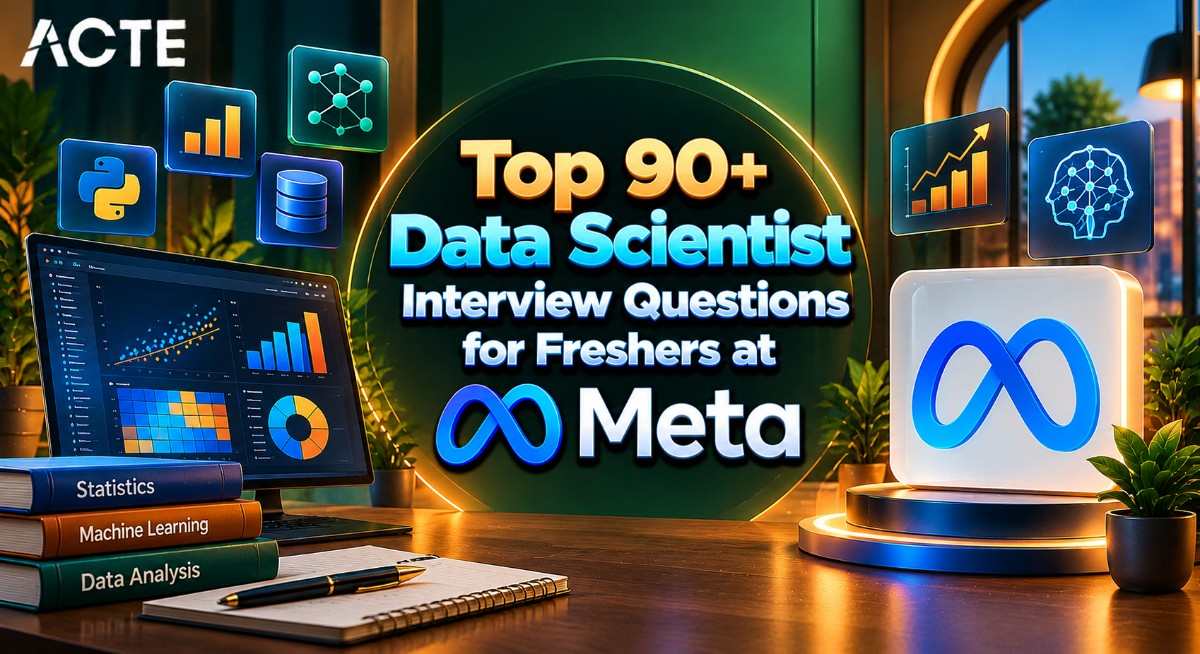
Top 90+ Data Scientist Interview Questions For Freshers At Meta Provides A Comprehensive Preparation Guide For Candidates Aspiring To Build A Career In Data Science, Product Analytics, And Machine Learning. The Guide Covers Essential Topics Such As Python Programming, SQL, Statistics, Probability, Exploratory Data Analysis, Data Visualization, And Predictive Modeling. It Also Includes Important Concepts Related To Hypothesis Testing, A/B Testing, Regression, Classification, Recommendation Systems, And User Engagement Analysis. Freshers Can Strengthen Their Technical Knowledge By Practicing Interview Questions, Solving Coding Problems, And Working On Real-Time Data Science Projects. Understanding Business Metrics, Interpreting Data-Driven Insights, And Communicating Analytical Results Clearly Are Also Important Skills For Data Scientist Roles At Meta. These 90+ Interview Questions And Answers Help Candidates Review Core Concepts And Prepare For Technical Discussions, Practical Assessments, And Behavioral Interview Rounds.
1. What Is Data Science?
Ans:
Data Science Is The Process Of Extracting Useful Insights From Structured And Unstructured Data. It Combines Statistics, Mathematics, Programming, Machine Learning, And Domain Data Science Is An Interdisciplinary Field That Uses Statistics, Programming, Machine Learning, And Domain Knowledge To Extract Meaningful Insights From Data. It Helps Organizations Understand Trends, Predict Outcomes, And Make Data-Driven Decisions. Data Scientists Work With Structured And Unstructured Data From Multiple Sources. Common Tools Include Python, SQL, Pandas, And Data Visualization Platforms
2. What Is The Role Of A Data Scientist At Meta??
Ans:
- A Data Scientist At Meta Uses Data To Understand Product Performance, User Behavior, And Business Opportunities.
- Responsibilities May Include Analyzing Large Datasets, Designing Experiments, Building Statistical Models, And Communicating Findings.
- SQL And Python Are Commonly Used To Retrieve, Process, And Analyze Data. Statistical Thinking Helps Evaluate Product Changes And Identify Meaningful Patterns
3. What Is The Difference Between Data Science And Data Analytics?
Ans:
Data Science Combines Statistics, Programming, Machine Learning, And Data Analysis To Solve Complex Problems. Data Analytics Primarily Focuses On Examining Existing Data To Understand Performance And Answer Business Questions. Data Scientists May Build Predictive Models, While Data Analysts Often Produce Reports And Descriptive Insights. Both Fields Use Tools Such As SQL, Python, And Visualization Software.
4. What Are The Main Steps In A Data Science Project?
Ans:
A Data Science Project Begins With Understanding The Business Problem And Defining Clear Objectives. The Next Steps Include Data Collection, Cleaning, Exploratory Analysis, And Feature Preparation. Suitable Statistical Methods Or Machine Learning Models Are Then Selected And Evaluated. Results Are Interpreted And Communicated Through Visualizations, Reports, Or Recommendations.
5. What Is Structured And Unstructured Data?
Ans:
Structured Data Is Organized Into A Defined Format, Commonly Rows And Columns In Relational Databases. Examples Include Customer Records, Transaction Tables, And Product Inventories. Unstructured Data Does Not Follow A Consistent Tabular Structure And Includes Images, Videos, Audio, And Free-Form Text. Different Processing Techniques Are Required Depending On The Data Type.
6. What Is Exploratory Data Analysis?
Ans:
- Exploratory Data Analysis, Or EDA, Is The Process Of Examining Data To Understand Its Structure, Distribution, And Relationships.
- It Includes Summary Statistics, Missing-Value Checks, Outlier Detection, And Visualization.
- Histograms, Scatter Plots, And Correlation Matrices Can Reveal Patterns That Require Further Investigation.
7. What Is Data Cleaning?
Ans:
Data Cleaning Is The Process Of Identifying And Correcting Problems That Reduce Data Quality. Common Tasks Include Handling Missing Values, Removing Duplicate Records, Correcting Invalid Entries, And Standardizing Formats. The Appropriate Method Depends On The Data Source And Analytical Objective. Incorrect Cleaning Decisions Can Introduce Bias Or Remove Important Information.
8. What Are Missing Values In A Dataset?
Ans:
Missing Values Occur When Certain Observations Or Variables Do Not Have Recorded Data. They May Result From Data Collection Errors, Optional Responses, System Failures, Or Other Causes. Common Handling Methods Include Removing Records, Imputing Values, Or Creating Missingness Indicators. The Choice Depends On The Missingness Pattern, Data Volume, And Analytical Goal. Missing-Value Treatment Should Be Performed Carefully To Avoid Biasing Results.
9. What Is Outlier Detection?
Ans:
Outlier Detection Identifies Observations That Differ Substantially From The General Pattern Of A Dataset. Outliers Can Result From Data Entry Errors, Unusual Events, Or Genuine Rare Behavior. Common Methods Include The Interquartile Range, Z-Scores, Visualization, And Anomaly Detection Algorithms. Not Every Outlier Should Be Removed Because Extreme Values May Contain Important Information. The Cause And Business Context Should Be Examined Before Taking Action.
10. What Is Data Normalization?
Ans:
Cross-Validation Is A Model Evaluation Technique Used To Estimate How Well A Machine Learning Model Will Perform On Unseen Data Normalization Can Refer To Scaling Numerical Features Or Organizing Database Structures, Depending On The Context. In Machine Learning, Feature Normalization Adjusts Values To A Common Scale. Min-Max Scaling Commonly Maps Values To A Defined Range, Such As Zero To One. Scaling Can Help Algorithms That Depend On Distances Or Gradient-Based Optimization.
11. What Is Standardization In Data Science?
Ans:
Standardization Transforms Numerical Values So They Have A Mean Of Approximately Zero And A Standard Deviation Of One. It Is Commonly Calculated By Subtracting The Mean And Dividing By The Standard Deviation. This Transformation Helps Compare Features With Different Units And Magnitudes. Algorithms Such As Logistic Regression, Support Vector Machines, And K-Means Can Benefit From Standardization.
12. What Is Feature Engineering?
Ans:
Feature Engineering Creates Or Transforms Variables To Help A Model Capture Relevant Patterns. Examples Include Extracting Day Of The Week From A Timestamp Or Calculating Customer Purchase Frequency. Domain Knowledge Helps Identify Features That Represent The Underlying Business Problem. Good Features Can Improve Model Performance Without Increasing Model Complexity.
13. What Is Feature Selection?
Ans:
- Feature Selection Identifies The Variables Most Useful For A Particular Modeling Task. It Can Reduce Computational Cost, Improve Interpretability, And Limit Overfitting.
- Common Methods Include Statistical Tests, Correlation Analysis, Recursive Feature Elimination, And Model-Based Importance Scores.
- Selection Should Be Performed Without Using Information From The Test Set. The Best Feature Set Depends On Predictive Performance, Stability, And Business Requirements.
14. How Does Handle Missing Values?14. What Is Descriptive Statistics?
Ans:
Missing Values Can Be Handled Through Deletion, Statistical Descriptive Statistics Summarize The Main Characteristics Of A Dataset. Common Measures Include Mean, Median, Mode, Range, Variance, And Standard Deviation. They Help Explain Typical Values, Spread, And Potentially Unusual Observations. Frequency Tables And Visualizations Can Provide Additional Context. Descriptive Statistics Are Often The First Step Before Inferential Analysis Or Predictive Modeling.
15. What Is The Difference Between Mean, Median, And Mode?
Ans:
Data Leakage Occurs When Information That Would Not Be The Mean Is The Arithmetic Average Of All Values In A Dataset. The Median Is The Middle Value After Sorting The Observations, Or The Average Of The Two Middle Values When There Is An Even Number. The Mode Is The Most Frequently Occurring Value Or Category. The Mean Can Be Strongly Affected By Extreme Values, While The Median Is More Resistant To Them. The Appropriate Measure Depends On The Data Distribution And Analytical Objective.
16. What Is Variance?
Ans:
Normalization Is A Feature Scaling Technique That Rescales Numerical Values Into A Specific Range, Often Between Zero And One. Min-Max Scaling Is One Of The Most Common Normalization Variance Measures How Far Data Values Spread Around Their Mean. It Is Calculated By Averaging Squared Deviations, With The Exact Denominator Depending On Whether Population Or Sample Variance Is Used. A High Variance Indicates Greater Dispersion, While A Low Variance Indicates Values Closer To The Mean. Variance Is Expressed In Squared Units, Which Can Make Interpretation Less Intuitive. Standard Deviation Is The Square Root Of Variance And Uses The Original Measurement Units.
17. What Is Standard Deviation?
Ans:
Standard Deviation Measures The Typical Spread Of Values Around The Mean In The Same Units As The Data. It Is Calculated As The Square Root Of Variance. A Small Standard Deviation Indicates That Values Tend To Be Close To The Mean. A Large Standard Deviation Indicates Greater Variability In The Observations. It Is Commonly Used In Descriptive Analysis, Statistical Modeling, And Quality Monitoring.
18. What Is Probability In Data Science?
Ans:
Probability Quantifies The Likelihood Of An Event Occurring And Takes Values Between Zero And One. It Supports Reasoning About Uncertainty In Data Analysis And Predictive Modeling. For Example, A Classification Model May Estimate The Probability That A User Clicks On An Advertisement. Probability Concepts Include Conditional Probability, Independence, And Bayes’ Theorem.
19. What Is Conditional Probability?
Ans:
- Conditional Probability Measures The Probability Of An Event Given That Another Event Has Occurred.
- It Is Calculated By Dividing The Joint Probability Of Both Events By The Probability Of The Conditioning Event, When That Probability Is Greater Than Zero.
- This Concept Helps Analyze Relationships Between Events And Variables. For Example, It Can Estimate The Probability Of A Purchase Given That A User Clicked An Advertisement.
20. What Is Bayes’ Theorem?
Ans:
Bayes’ Theorem Updates The Probability Of A Hypothesis Using New Evidence. It Combines The Prior Probability, Likelihood Of The Evidence, And Overall Probability Of The Evidence. The Method Is Useful When Initial Beliefs Need To Be Revised Based On Observed Data. Applications Include Spam Filtering, Medical Classification, And Risk Estimation. Correct Interpretation Requires Careful Attention To Base Rates And The Reliability Of The Evidence.
21. What Is A Normal Distribution?
Ans:
LA Normal Distribution Is A Symmetric, Bell-Shaped Probability Distribution Centered Around Its Mean. In A Perfect Normal Distribution, The Mean, Median, And Mode Are Equal. Its Shape Is Determined By The Mean And Standard Deviation. Many Statistical Methods Use Normality Assumptions For Particular Variables Or Model Errors. Real-World Data May Deviate From Normality, So Distributional Assumptions Should Be Checked When Relevant.
22. What Is Hypothesis Testing?
Ans:
Hypothesis Testing Is A Statistical Method For Evaluating Evidence About A Claim Or Population Parameter. It Begins With A Null Hypothesis And An Alternative Hypothesis. A Test Statistic And P-Value Are Used To Assess How Compatible The Observed Data Are With The Null Hypothesis. The Significance Level Is Chosen Before Evaluating The Results. Statistical Significance Does Not Automatically Mean That An Effect Is Large Or Important In Practice.
23. What Is A P-Value?
Ans:
A P-Value Is The Probability, Assuming The Null Hypothesis And Statistical Model Are Correct, Of Observing A Test Statistic At Least As Extreme As The One Obtained. A Small P-Value Indicates That The Observed Result Would Be Unusual Under The Null Hypothesis. It Does Not Represent The Probability That The Null Hypothesis Is True.
24. What Is A Confidence Interval?
Ans:
A Confidence Interval Is A Range Of Values Produced By A Statistical Procedure To Estimate An Unknown Population Parameter. A 95% Confidence Procedure Would Capture The True Parameter In About 95% Of Repeated Samples Under Its Assumptions. The Interval Reflects Sampling Uncertainty And Depends On Factors Such As Sample Size And Variability. Narrower Intervals Often Indicate More Precise Estimates.
25. What Is Correlation?
Ans:
Correlation Measures The Strength And Direction Of Association Between Two Variables. Pearson Correlation Measures Linear Association, While Spearman Correlation Measures Rank-Based Monotonic Association. Correlation Values Typically Range From Negative One To Positive One. A Positive Correlation Means The Variables Tend To Increase Together, While A Negative Correlation Means One Tends To Decrease As The Other Increases.
26. What Is The Difference Between Correlation And Causation?
Ans:
Correlation Indicates That Two Variables Are Associated, While Causation Means Changes In One Variable Produce Changes In Another. An Observed Association May Be Influenced By Confounding Variables, Selection Bias, Or Coincidence. Establishing Causation Usually Requires A Strong Study Design And Additional Evidence. Randomized Experiments Are Particularly Useful Because Random Assignment Helps Balance Confounders.
27. What Is Regression Analysis?
Ans:
Regression Analysis Models The Relationship Between A Target Variable And One Or More Predictors. Linear Regression Is Commonly Used When The Target Is Continuous And A Linear Relationship Is Appropriate. Regression Can Help Estimate Effects, Forecast Values, And Understand Associations. Model Assumptions And Residuals Should Be Examined To Assess Whether The Model Is Suitable.
28. What Is Linear Regression?
Ans:
- Linear Regression Estimates A Relationship Between A Continuous Target And One Or More Input Features.
- It Fits Coefficients That Minimize A Defined Error Criterion, Commonly The Sum Of Squared Residuals.
- The Model Is Easy To Interpret When Its Assumptions And Feature Relationships Are Appropriate.
29. What Is Logistic Regression?
Ans:
Logistic Regression Is A Statistical Learning Method Commonly Used For Classification Tasks. It Models Class Probability Using A Logistic Function Applied To A Linear Combination Of Features. The Resulting Probability Can Be Converted Into A Class Label Using A Decision Threshold. Logistic Regression Is Relatively Interpretable And Often Works Well As A Baseline Model. Evaluation May Include Precision, Recall, ROC-AUC, And Calibration Depending On The Application.
30. What Is Overfitting?
Ans:
Overfitting Occurs When A Model Learns Training Data Too Closely, Including Noise And Accidental Patterns. It Often Performs Well On Training Data But Poorly On Unseen Data. Common Prevention Methods Include Regularization, Cross-Validation, Early Stopping, And Simplifying The Model. More Representative Training Data Can Also Improve Generalization.
31. What Is Underfitting?
Ans:
Underfitting Occurs When A Model Is Too Simple Or Insufficiently Trained To Capture Important Patterns In The Data. It Often Performs Poorly On Both Training And Validation Datasets. Possible Causes Include Weak Features, Excessive Regularization, Or An Unsuitable Model Choice. Increasing Model Capacity Or Improving Feature Engineering May Help. The Changes Should Be Evaluated On Validation Data To Confirm That Performance Improves.
32. What Is The Bias-Variance Trade-Off?
Ans:
The Bias-Variance Trade-Off Describes The Balance Between Errors Caused By Simplifying Assumptions And Errors Caused By Sensitivity To Training Data. High-Bias Models May Underfit, While High-Variance Models May Overfit. Model Complexity, Data Quantity, And Regularization Influence This Balance. Cross-Validation Helps Compare Models And Estimate Generalization Performance.
33. What Is Cross-Validation?
Ans:
Cross-Validation Estimates How Well A Model May Generalize By Repeatedly Training And Evaluating It On Different Data Splits. In K-Fold Cross-Validation, The Dataset Is Divided Into K Parts, And Each Part Serves As Validation Data Once. Results Are Aggregated To Compare Candidate Models Or Settings. Stratified Splits Can Help Preserve Class Proportions In Classification Tasks.
34. What Is Train-Test Split?
Ans:
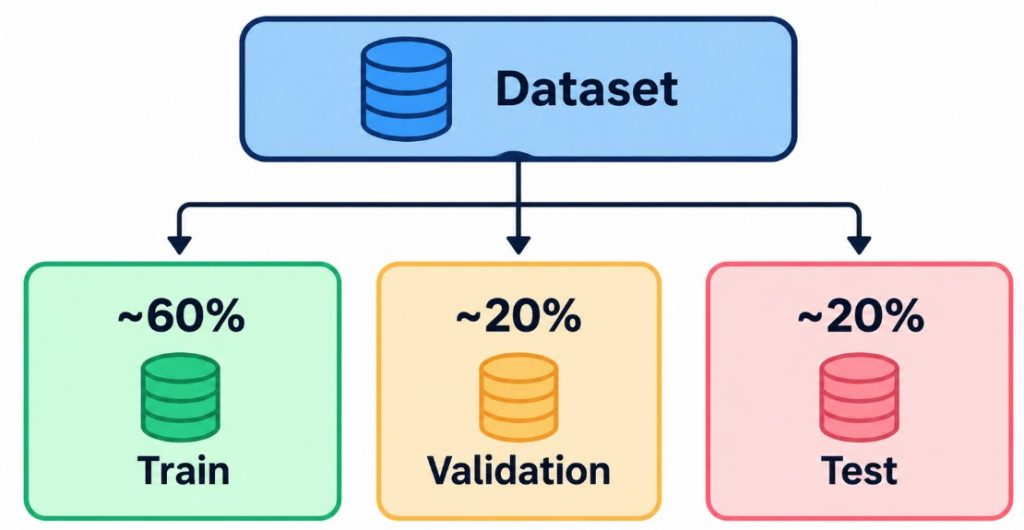
A Train-Test Split Divides A Dataset Into Separate Portions For Model Development And Final Evaluation. The Training Set Is Used To Fit The Model, While The Test Set Estimates Performance On Unseen Data. A Validation Set May Be Used For Model Selection And Hyperparameter Tuning. Preprocessing Must Be Fitted Without Accessing Test-Set Information. This Separation Helps Prevent Overly Optimistic Performance Estimates.
35. What Is Data Leakage?
Ans:
Data Leakage Occurs When Information Unavailable At Prediction Time Influences Model Training Or Evaluation. It Can Happen Through Future Data, Target-Derived Features, Or Preprocessing Performed Before Proper Splitting. Leakage Can Produce Unrealistically Strong Test Results That Fail In Production. Prevention Includes Time-Aware Splits, Training-Only Preprocessing, And Careful Feature Review.
36. What Is Classification In Machine Learning?
Ans:
- Classification Is A Supervised Learning Task That Predicts Discrete Categories From Input Features.
- Examples Include Spam Detection, Fraud Identification, And Customer Churn Prediction. Algorithms Include Logistic Regression, Decision Trees, Random Forests, And Support Vector Machines.
- Evaluation Metrics Depend On Class Balance And The Relative Costs Of Different Errors.
37. What Is Clustering?
Ans:
Clustering Is An Unsupervised Learning Technique That Groups Data Points Based On Similarities. It Can Help Discover Customer Segments, Behavioral Patterns, Or Natural Groupings In Large Datasets. K-Means, Hierarchical Clustering, And DBSCAN Are Common Approaches. The Appropriate Method Depends On Data Shape, Distance Measures, And Noise Levels. Cluster Quality Should Be Evaluated With Suitable Metrics And Domain Knowledge.
38. What Is K-Means Clustering?
Ans:
K-Means Is A Clustering Algorithm That Divides Data Into A Specified Number Of Groups. It Assigns Points To The Nearest Centroid And Recalculates Centroids Until The Process Converges. Feature Scaling Can Be Important Because Distance Calculations Are Sensitive To Different Units. The Algorithm Can Be Sensitive To Initialization And Outliers. Methods Such As The Elbow Technique And Silhouette Score Can Help Assess Candidate Cluster Counts.
39. What Is Decision Tree Learning?
Ans:
A Decision Tree Predicts An Outcome By Splitting Data According To Feature-Based Rules. Each Internal Node Represents A Decision, And Each Leaf Represents A Prediction. Trees Can Model Nonlinear Relationships And Are Often Easier To Explain Than Complex Ensembles. However, Deep Trees Can Overfit The Training Data. Limiting Tree Depth, Requiring Minimum Leaf Sizes, And Pruning Can Improve Generalization.
40. What Is A Random Forest?
Ans:
Random Forest Is An Ensemble Learning Method That Combines Predictions From Multiple Decision Trees. Each Tree Is Trained Using Randomized Samples And Feature Selection To Increase Diversity. Classification Commonly Uses Voting, While Regression Often Averages Tree Predictions. Random Forests Can Capture Complex Relationships And Usually Reduce The Instability Of Individual Trees.

41. What Is Gradient Boosting?
Ans:
- Gradient Boosting Builds A Sequence Of Models, Commonly Decision Trees, With Each New Model Improving The Current Ensemble.
- The Training Process Uses A Loss Function And Gradient-Based Updates To Reduce Prediction Errors.
- Popular Implementations Include XGBoost, LightGBM, And CatBoost. Gradient Boosting Often Performs Well On Structured Tabular Data
42. What Is The Difference Between Bagging And Boosting?
Ans:
Bagging Trains Multiple Models Using Randomized Samples And Combines Their Predictions To Reduce Variance. Random Forest Is A Common Example Of Bagging With Decision Trees. Boosting Trains Models Sequentially So That Later Models Improve On Errors Or Gradients From Earlier Ones. Gradient Boosting Methods Can Reduce Bias And Achieve Strong Predictive Performance.
43. What Is Support Vector Machine?
Ans:
A Support Vector Machine Is A Supervised Learning Algorithm Used For Classification And Regression. It Attempts To Find A Decision Boundary That Maximizes The Margin Between Classes. Kernel Functions Can Help Model Nonlinear Relationships By Representing Data In A Different Feature Space. SVMs Can Be Effective On Some Small Or Medium-Sized Datasets, Especially With Appropriate Scaling.
44. What Is K-Nearest Neighbors?
Ans:
K-Nearest Neighbors Predicts An Outcome Using The Closest Training Examples To A New Data Point. Classification Often Uses The Majority Class Among Neighbors, While Regression Can Average Their Values. The Choice Of K And Distance Metric Can Strongly Affect Performance. Feature Scaling Is Important When Variables Have Different Ranges. KNN Is Easy To Understand But Can Become Computationally Expensive With Large Datasets.
45. What Is Naive Bayes?
Ans:
Naive Bayes Is A Probabilistic Classification Method Based On Bayes’ Theorem And A Conditional Independence Assumption. It Estimates Class Probabilities Using The Features Of An Observation. The Method Is Often Used For Text Classification, Spam Detection, And Simple Baseline Models. Some Variants Work With Counts, Continuous Features, Or Binary Variables.
46. What Is Ensemble Learning?
Ans:
Ensemble Learning Combines Multiple Models To Improve Predictive Performance Or Stability. Common Approaches Include Bagging, Boosting, And Stacking. Combining Models Can Reduce Some Errors Made By Individual Predictors. The Benefits Depend On The Accuracy And Diversity Of The Models Being Combined. Ensemble Methods Should Be Compared Against Simpler Baselines Because They May Increase Complexity And Maintenance Costs.
47. What Is Hyperparameter Tuning?
Ans:
- Hyperparameter Tuning Searches For Model Settings That Improve Performance On Validation Data.
- Examples Include Learning Rate, Tree Depth, Number Of Neighbors, And Regularization Strength. Common Methods Include Grid Search, Random Search, And Bayesian Optimization.
- A Separate Test Set Should Remain Untouched During Tuning To Avoid Biased Evaluation.
48. What Is Accuracy In Machine Learning?
Ans:
Accuracy Measures The Proportion Of Predictions That Match The Actual Labels. It Is Calculated As Correct Predictions Divided By The Total Number Of Predictions. Accuracy Can Be Useful When Classes Are Balanced And Error Costs Are Similar. However, It Can Be Misleading For Imbalanced Datasets, Such As Fraud Detection With Very Few Fraudulent Cases.
49. What Is Precision, Recall, And F1-Score?
Ans:
Precision Measures The Proportion Of Predicted Positive Cases That Are Actually Positive. Recall Measures The Proportion Of Actual Positive Cases Correctly Identified By The Model. F1-Score Is The Harmonic Mean Of Precision And Recall. These Metrics Help Evaluate Classification Systems When Different Error Types Have Different Consequences. The Appropriate Metric Depends On The Business Goal And The Relative Cost Of False Positives And False Negatives.
50. What Is ROC-AUC?
Ans:
ROC-AUC Measures How Well A Classification Model Ranks Positive Examples Above Negative Examples Across Different Thresholds. The ROC Curve Plots True Positive Rate Against False Positive Rate. An AUC Of One Represents Perfect Ranking, While An AUC Near 0.5 Indicates Performance Similar To Random Ranking In A Typical Binary Setting. ROC-AUC Can Be Useful When Comparing Models Across Thresholds. For Highly Imbalanced Data, Precision-Recall Curves May Offer Additional Insight.
51. What Is Imbalanced Data?
Ans:
Imbalanced Data Occurs When Some Classes Have Many More Examples Than Others. For Example, Fraudulent Transactions May Represent Only A Small Portion Of All Transactions. A Model Can Achieve High Accuracy By Predicting The Majority Class While Missing Most Minority-Class Cases. Solutions May Include Class Weights, Resampling, Threshold Adjustment, And Appropriate Metrics.
52. What Is Sampling In Statistics?
Ans:
Sampling Selects A Subset Of Observations From A Larger Population For Analysis. Random Sampling Gives Population Members Known Selection Probabilities And Can Help Reduce Selection Bias. Stratified Sampling Ensures Representation From Important Groups, While Cluster Sampling Selects Groups Of Observations. Poor Sampling Methods Can Produce Misleading Estimates.
53. What Is A/B Testing?
Ans:
A SQL JOIN Is Used To Combine Related Rows From Two Or More A/B Testing Compares Two Variants To Determine Whether A Change Produces A Meaningful Difference In An Outcome. Users Or Other Experimental Units Are Randomly Assigned To Control And Treatment Groups. Metrics Might Include Click-Through Rate, Conversion Rate, Retention, Or Revenue. Statistical Analysis Helps Estimate The Effect And Its Uncertainty.
54. How Does Measure The Success Of A New Meta Product Feature?
Ans:
- Success Measurement Begins With Defining The User Problem And The Intended Product Outcome.
- A Primary Metric Could Measure Adoption, Engagement, Retention, Or Successful Task Completion.
- Guardrail Metrics Help Detect Negative Effects On User Experience, Reliability, Or Other Important Outcomes. An Experiment Can Compare The New Feature With A Suitable Control Group. Results Shoul.
55. What Is Statistical Significance?
Ans:
Statistical Significance Indicates That Observed Data Would Be Unusual Under A Specified Null Hypothesis At A Chosen Significance Level. It Does Not Automatically Demonstrate That An Effect Is Large, Valuable, Or Causal. Results Depend On Study Design, Assumptions, Sample Size, And The Number Of Comparisons Performed. Confidence Intervals And Effect Sizes Help Provide Additional Context. Business Decisions Should Consider Practical Importance Alongside Statistical Evidence..
56. What Is Sample Size And Why Does It Matter?
Ans:
Sample Size Is The Number Of Observations Included In A Study Or Experiment. Larger Samples Generally Provide More Precise Estimates When Other Conditions Are Comparable. The Required Size Depends On Expected Effect Size, Outcome Variability, Significance Level, And Desired Statistical Power. Underpowered Studies May Fail To Detect Real Effects, While Very Large Samples Can Make Tiny Effects Statistically Significant. Sample Size Planning Helps Balance Reliability, Time, And Resources.
57. What Is Statistical Power?
Ans:
Statistical Power Is The Probability That A Statistical Test Will Reject The Null Hypothesis When A Specific Alternative Effect Is True. It Is Commonly Expressed As One Minus The Type II Error Rate. Power Depends On Factors Such As Sample Size, Effect Size, Variability, And Significance Level. Increasing Sample Size Can Improve Power When Other Conditions Remain Similar.
58. What Is A Type I Error?
Ans:
- A Type I Error Occurs When A Statistical Test Rejects A Null Hypothesis That Is Actually True
- The Significance Level, Often Denoted By Alpha, Sets The Target Probability Of This Error Under The Test’s Assumptions.
- In Product Experiments, It May Lead To Believing A Feature Works When The Observed Difference Is Due To Random Variation.
59. What Is The Difference Between UNION And UNION ALL?
Ans:
| Aspect | UNION | UNION ALL |
|---|---|---|
| Duplicates | Removes Duplicate Rows From The Result. | Keeps All Duplicate Rows In The Result. |
| Performance | Generally Slower Because Duplicate Removal Is Required. | Generally Faster Because Duplicates Are Not Removed. |
| Usage | Used When Only Unique Records Are Required. | Used When All Records From Both Queries Are Required. |
| Components | Includes servers, databases, middleware | Specific processes on application servers |
60. What Is The Difference Between Online And Offline Metrics?
Ans:
Offline Metrics Are Calculated Using Historical Data Or Controlled Evaluation Datasets. Examples Include Accuracy, AUC, Prediction Error, And Retrieval Relevance. Online Metrics Measure System Performance During Actual Use, Often Through Experiments Or Production Monitoring. Examples Include Conversion Rate, Retention, Latency, And User Satisfaction. Offline Improvements Do Not Always Translate Into Online Benefits, So Both Types Of Evaluation Are Important.

Get JOB Oriented Data Science Training for Beginners By MNC Experts
- Instructor-led Sessions
- Real-life Case Studies
- Assignments
61. What Is SQL And Why Is It Important For Data Scientists?
Ans:
SQL Is A Language Used To Query And Manage Data Stored In Relational Databases. Data Scientists Use SQL To Filter Records, Join Tables, Aggregate Metrics, And Prepare Analytical Datasets. It Is Especially Valuable When Working With Large Product, Event, And Transaction Tables. Strong SQL Skills Help Reduce Unnecessary Data Transfers And Support Reproducible Analysis. Common Interview Topics Include Joins, Subqueries, Window Functions, Grouping, And Query Optimization.
62. What Is The Difference Between WHERE And HAVING In SQL?
Ans:
WHERE Filters Individual Rows Before Grouping And Aggregation Are Performed. HAVING Filters Groups After GROUP BY Has Created Aggregate Results. WHERE Commonly Uses Conditions On Columns, While HAVING Can Filter By Aggregate Expressions Such As COUNT Or SUM. Using WHERE To Reduce Unnecessary Rows Can Improve Query Efficiency. Understanding The Difference Helps Write Accurate SQL Queries For Analytical Reports.
63. What Is The Difference Between INNER JOIN And LEFT JOIN?
Ans:
| Aspect | INNER JOIN | LEFT JOIN |
|---|---|---|
| Result | Returns Only Rows With Matching Values In Both Tables. | Returns All Rows From The Left Table And Matching Rows From The Right Table. |
| Non-Matching Rows | Excludes Rows That Do Not Have Matching Records. | Includes Non-Matching Left Table Rows With NULL Values For Right Table Columns. |
| Usage | Used When Only Matching Records From Both Tables Are Required. | Used When All Records From The Left Table Are Required, Even Without Matches. |
| Output Size | May Return Fewer Rows Because Only Matching Records Are Included. | Preserves All Rows From The Left Table, Although Right Table Values May Be NULL. |
64. What Is A Window Function In SQL
Ans:
A Window Function Calculates A Result Across A Set Of Related Rows Without Collapsing Them Into One Row Per Group. Common Examples Include ROW_NUMBER, RANK, LAG, LEAD, And Running Totals. The OVER Clause Defines The Partitioning And Ordering Used For The Calculation. Window Functions Are Useful For Ranking Products, Comparing Consecutive Events, And Calculating Cumulative Metrics.
65. What Is A Common Table Expression In SQL?
Ans:
A Common Table Expression, Or CTE, Defines A Named Temporary Result Set Using The WITH Clause. It Helps Organize Complex Queries Into Readable And Reusable Logical Steps. CTEs Can Support Aggregations, Joins, Ranking, And Recursive Queries In Compatible Database Systems. They Often Make SQL Easier To Debug And Maintain. Their Performance Depends On The Database Engine And Query Plan Rather Than The CTE Syntax Alone.
66. How Does Find Duplicate Records In SQL?
Ans:
Duplicate Records Can Be Identified By Grouping Rows By The Fields That Define Uniqueness. The HAVING COUNT(*) Greater Than One Condition Can Reveal Groups That Appear Multiple Times. For Example, Grouping By An Email Address Can Identify Repeated Email Values. Window Functions Such As ROW_NUMBER Can Help Locate Individual Duplicate Rows. Before Removing Duplicates, The Data Definition And Business Rules Should Confirm Which Record Must Be Preserved.
67. How Would Calculate Daily Active Users Using SQL?
Ans:
- Daily Active Users Can Be Calculated By Counting Distinct User Identifiers With At Least One Qualifying Activity On Each Day.
- The Query Typically Groups Event Records By The Activity Date. COUNT(DISTINCT user_id) Helps Avoid Counting The Same User Multiple Times On A Single Day.
- The Definition Of Activity Should Match The Product Metric And Exclude Irrelevant Events. Time Zones, Duplicate Events, And Late-Arriving Data Should Be Handled Consistently.
68. What Is Python Used For In Data Science?
Ans:
Python Supports Data Cleaning, Exploratory Analysis, Statistical Modeling, Machine Learning, And Visualization. Libraries Such As Pandas And NumPy Help Process Structured Data And Perform Numerical Operations. Scikit-Learn Provides Common Machine Learning Algorithms And Evaluation Utilities. Matplotlib And Seaborn Can Help Present Trends And Relationships Visually.
69. What Is Pandas In Python?
Ans:
Pandas Is A Python Library Designed For Working With Structured And Labeled Data. Its DataFrame Structure Supports Filtering, Joining, Grouping, Aggregation, And Data Transformation. Pandas Also Provides Tools For Handling Missing Values, Dates, And Different File Formats. It Is Widely Used During Data Cleaning And Exploratory Data Analysis. Efficient Pandas Workflows Can Improve Productivity When Preparing Data For Statistical Analysis And Machine Learning.
70. What Is NumPy?
Ans:
NumPy Is A Python Library For Numerical Computing And Multidimensional Array Operations. It Provides Efficient Mathematical Functions, Broadcasting, Linear Algebra, And Random Number Generation. Many Data Science Libraries Use NumPy Arrays As Core Data Structures. Vectorized Operations Can Be Faster And More Concise Than Repeated Python Loops. NumPy Is Commonly Used For Statistical Calculations, Numerical Modeling, And Data Preparation.
71. What Is Matplotlib?
Ans:
Matplotlib Is A Python Visualization Library Used To Create Charts And Graphs. It Supports Line Charts, Bar Charts, Histograms, Scatter Plots, And Many Other Visual Forms. Data Scientists Use It To Explore Distributions, Compare Categories, And Present Analytical Results. Labels, Titles, Legends, And Appropriate Scales Improve Interpretability. The Chart Type Should Match The Question And Avoid Misleading Visual Presentation.
72. What Is Seaborn?
Ans:
Seaborn Is A Python Visualization Library Built On Matplotlib That Simplifies Statistical Graphics. It Provides Convenient Functions For Visualizing Distributions, Relationships, And Group Comparisons. Common Charts Include Box Plots, Violin Plots, Heatmaps, And Pair Plots. Seaborn Works Well With Pandas DataFrames And Can Reduce The Amount Of Plotting Code Required. Clear Labels And Appropriate Interpretation Remain Essential For Effective Visual Analysis.
73. What Is The Difference Between A List And A Tuple In Python?
Ans:
A List Is A Mutable Sequence, Which Means Its Elements Can Be Added, Removed, Or Changed. A Tuple Is An Immutable Sequence Whose Elements Cannot Be Reassigned After Creation. Lists Are Useful For Collections That Need Frequent Updates, While Tuples Suit Fixed Groups Of Values. Both Support Indexing, Slicing, And Iteration. Choosing Between Them Depends On Whether The Collection Needs To Change And How It Will Be Used.
74. What Is A Dictionary In Python?
Ans:
A Dictionary Stores Data As Key-Value Pairs And Provides Efficient Average-Case Lookup By Key. Keys Must Be Hashable, While Values Can Be Different Data Types. Dictionaries Are Useful For Counting Categories, Mapping Identifiers To Records, And Organizing Configuration Data. They Support Operations Such As Adding, Updating, And Removing Entries. Data Scientists Commonly Use Dictionaries To Summarize Results And Prepare Structured Information.
75. What Is A Lambda Function In Python?
Ans:
A Lambda Function Is A Small Anonymous Function Defined Using The Lambda Keyword. It Can Contain A Single Expression And Is Often Used For Short Operations. Lambda Functions Are Commonly Passed To Tools Such As Sorted, Map, And Certain Data Transformation Methods. They Can Make Simple Operations Concise But May Reduce Readability When Overused.
76. What Is List Comprehension In Python?
Ans:
List Comprehension Provides A Concise Way To Create A List From An Iterable. It Can Include An Expression, A Loop, And An Optional Condition. For Example, It Can Extract Positive Values From A Collection In A Single Expression. List Comprehensions Often Improve Readability For Simple Transformations. Complex Nested Operations May Be Easier To Understand As Conventional Loops Or Separate Functions.
77. What Is The Difference Between Shallow Copy And Deep Copy?
Ans:
A Shallow Copy Creates A New Outer Object But Retains References To Nested Objects. A Deep Copy Recursively Copies Nested Objects So That The Copied Structure Is More Independent. Changes To Shared Nested Objects Can Affect Both Structures After A Shallow Copy. Deep Copying Can Require More Memory And Processing Time. Python’s Copy Module Provides Functions For Both Approaches, Which Should Be Selected Based On The Required Independence.
78. What Is Object-Oriented Programming?
Ans:
Object-Oriented Programming Organizes Software Around Objects That Combine Data And Related Behavior. Its Common Concepts Include Classes, Objects, Encapsulation, Inheritance, And Polymorphism. OOP Can Improve Modularity And Reuse When Designing Complex Applications. In Data Science, It Can Help Organize Reusable Data Processing Components And Model Interfaces.
79. What Is The Difference Between Supervised And Unsupervised Learning?
Ans:
Supervised Learning Uses Labeled Data To Learn A Mapping From Inputs To Known Targets. Unsupervised Learning Works With Data Without Explicit Target Labels To Discover Structure Or Patterns. Classification And Regression Are Supervised Tasks, While Clustering Is A Common Unsupervised Task. Supervised Models Can Be Evaluated Against Known Outcomes, Whereas Unsupervised Evaluation Often Requires Different Metrics And Domain Interpretation.
80. What Is Deep Learning?
Ans:
- Deep Learning Is A Branch Of Machine Learning That Uses Neural Networks With Multiple Layers.
- These Models Can Learn Complex Representations From Images, Text, Audio, And Other Data Types.
- Deep Learning Often Requires Substantial Data And Computing Resources, Although Requirements Vary By Task And Model. Applications Include Speech Recognition, Computer Vision, Recommendation, And Language Processing.
81. What Is Natural Language Processing?
Ans:
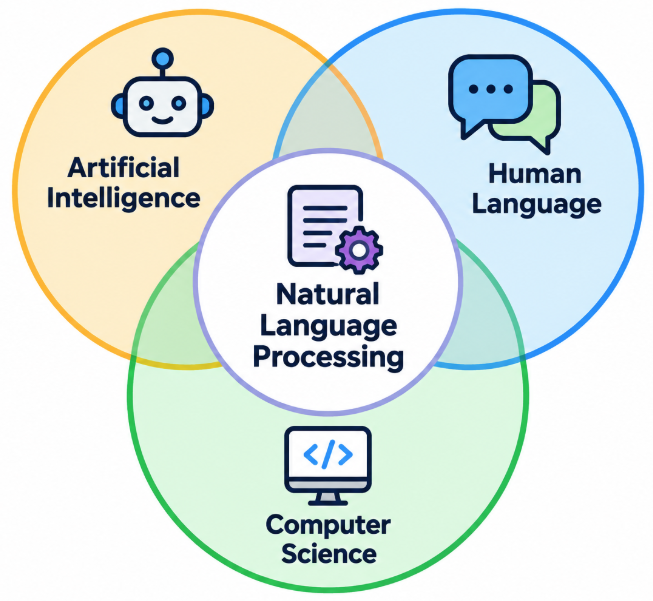
Natural Language Processing Enables Computers To Analyze, Interpret, And Generate Human Language. Common Tasks Include Sentiment Analysis, Text Classification, Translation, And Named Entity Recognition. NLP Systems Can Use Rules, Traditional Machine Learning, Or Modern Transformer Models. Data Preparation And Appropriate Evaluation Are Important Because Language Is Ambiguous And Context-Dependent.
82. What Is Sentiment Analysis?
Ans:
Sentiment Analysis Identifies The Emotional Tone Or Opinion Expressed In Text. It Commonly Classifies Text As Positive, Negative, Or Neutral, Although More Detailed Labels Are Possible. Applications Include Product Review Analysis, Customer Feedback Monitoring, And Social Media Research. Challenges Include Sarcasm, Context, Mixed Opinions, And Language Differences.
83. What Is Recommendation System?
Ans:
A Recommendation System Suggests Items That May Be Relevant To A User Based On Preferences, Behavior, Or Item Characteristics. Collaborative Filtering Uses Patterns Across Users And Items, While Content-Based Filtering Uses Item Features And User Preferences. Hybrid Systems Combine Multiple Approaches To Improve Coverage And Relevance. Evaluation Can Include Ranking Metrics, User Engagement, And Business Outcomes.
84. What Is Collaborative Filtering?
Ans:
Collaborative Filtering Generates Recommendations By Using Patterns In Interactions Between Users And Items. User-Based Methods Find Similar Users, While Item-Based Methods Identify Items With Similar Interaction Patterns. Matrix Factorization Can Represent Users And Items In A Lower-Dimensional Latent Space. These Methods Can Personalize Recommendations Without Requiring Detailed Item Descriptions.
85. How Does Improve User Engagement On Facebook Or Instagram?
Ans:
The First Step Is To Define Engagement Clearly, Such As Meaningful Interactions, Sessions, Or Relevant Content Consumption. Data Analysis Can Identify User Segments, Common Drop-Off Points, And Features Associated With Engagement. Experiments Can Test Potential Improvements Against A Suitable Control Group. Guardrail Metrics Should Monitor User Satisfaction, Content Quality, Safety, And Long-Term Retention.
86. How Does Analyze A Sudden Drop In Daily Active Users?
Ans:
The Investigation Should Begin By Validating Tracking Systems, Data Pipelines, And Metric Definitions. The Drop Can Then Be Segmented By Platform, Region, User Cohort, App Version, And Acquisition Channel. Historical Trends And Recent Product Changes May Help Identify When And Where The Decline Started. Statistical Comparisons Can Determine Whether The Change Is Unusual Or Within Expected Variation.
87. How Does Measure The Success Of An Instagram Feature?
Ans:
Success Measurement Begins By Defining The Feature’s Goal And Identifying A Primary Success Metric. Supporting Metrics Can Track Adoption, Repeat Usage, Retention, And Relevant User Interactions. An Experiment Can Compare Outcomes Between Treatment And Control Groups. Guardrail Metrics Should Check For Negative Effects On Reliability, Safety, Or Overall User Experience. The Final Recommendation Should Consider Statistical Uncertainty, Practical Significance, And Whether Benefits Persist Over Time.
88. What Is A North Star Metric?
Ans:
A North Star Metric Is A Key Measure Intended To Represent The Core Value A Product Delivers To Users. It Helps Teams Align Product Decisions Around A Shared Objective. The Metric Should Reflect Meaningful Value Rather Than A Vanity Measure That Can Increase Without Improving The Product. Supporting Metrics Help Explain The Factors That Influence It. A Useful North Star Metric Should Be Interpretable, Measurable, And Closely Connected To Long-Term Product Success.
89. What Is Cohort Analysis?
Ans:
- Cohort Analysis Groups Users Or Other Entities Based On A Shared Characteristic Or Starting Event. For Example, Users Can Be Grouped By Signup Week To Compare Their Retention Over Time.
- This Approach Helps Reveal Behavioral Differences Between Groups That Overall Averages May Hide.
- Cohort Definitions And Observation Windows Must Be Consistent For Fair Comparisons.
90. What Is Customer Retention Analysis?
Ans:
Customer Retention Analysis Measures How Many Users Continue Using A Product Over A Defined Period. It Often Tracks The Percentage Of An Initial User Group That Returns After A Specific Time. Cohort Analysis Helps Compare Retention Across Signup Periods, Regions, Or Product Experiences. Retention Patterns Can Reveal Onboarding Problems Or Differences In Long-Term Product Value.