Last updated on 13th Jul 2020| 1396
What Is A Marketing Report?
A marketing report is a set of data created to analyze the performance of a specific marketing campaign or effort. It is utilized to effectively communicate a company’s marketing strategy, including research, promotional tactics, goals and expected outcomes.
How To Write A Marketing Report?
We’ve all heard of that famous end of the month when it’s time to deliver reports, be it in an agency or in-house. While your keyboard is burning and your fingers try to keep up with your brain and comprehend all the data you’re writing about, using an interactive online data visualization tool to set specific time parameters or goals you’ve been tracking can bring a lot of saved time and, consequently, a lot of saved money.
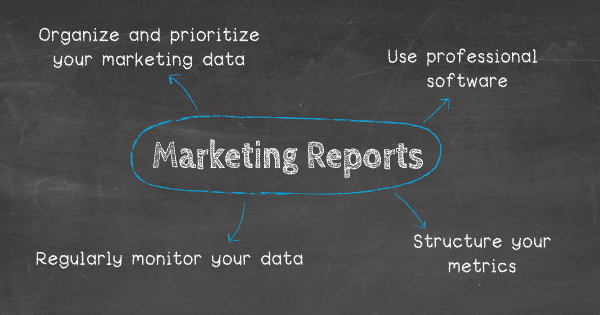
1. First things first – organizing and prioritizing your marketing data
And just like you schedule daily, weekly and monthly marketing activities, so will you build daily, weekly and monthly marketing reports. If you get your practice right and utilize some effective data driven marketing strategy tips and tricks, a report can be generated with just a few clicks. Below, in the article, we’ve gathered some of the marketing reports templates that can easily be used to perfect the efficiency of generating data and reduce the time needed to create it.
2. Use professional software
There are countless reports digging into your marketing data; the question usually is, where do I start? Are there any basic reports that could help me get more comfortable with these mountains of aggregated data? To get started, you might want to equip yourself with a marketing BI software to analyze all your data and easily build professional reports.
3. Structure your metrics
As with any report you might need to create, structuring and implementing metrics that will tell an interesting and educational data-story is crucial in our digital age. We will go into detail with each report below in the article, but it is important to keep in mind that low-level metrics such as CPC or CTR will not take part in the strategic report that focuses on customers’ costs. You need to decide which story you want to tell and to whom: your colleagues, supervisor or VP? That way you can choose the best possible metrics for your case.
4. Regularly monitor your data
Secondly, launching a campaign with achievable goals is only worth it if you check on them on a regular basis and see if you’re on track – waiting for the end of the campaign to see how it performed is, unfortunately, a common mistake people do, and the worst practice. As a Forbes article states, “there’s no such thing as ‘set it and forget it’ [in digital marketing]”. Noticing that something does not work as planned on the 7th day instead of the 47th is a lot of time saved, and less money wasted.
Types Of Marketing Reports
There are numerous marketing report types, depending on which data you need to monitor and analyze. Usually, reports are done on an annual, monthly, weekly or daily basis, but sometimes you need to create an ad-hoc, KPI report for a particular purpose.
That said, we will go into details of a marketing campaign report, provide a digital marketing report template, and look into marketing reporting and analysis with the help of carefully created dashboards.
But let’s get over some real data, starting with the annual marketing report.
Annual Marketing Report Examples
As with each part of a business, the end and beginning of a year is usually the time to reflect what was accomplished, conduct a few meetings, consolidate data and prepare for the year ahead. Marketing strategy reports such as annual ones focus on the biggest possible picture a department can have, usually with high-level metrics that will look at marketing activities on a broader spectrum, focusing on strategic developments and goals, discussed by the most senior marketing authorities a company might have such as the chief marketing officer (CMO).
Delivering milestones and reflecting on strengths and weaknesses will ensure your next year will be fresh, full of new opportunities and identified possibilities that will ensure you stay on the right path and deliver the best possible promotional results. Let’s see this through a marketing report sample focused on high-level metrics.
1) Marketing CMO report
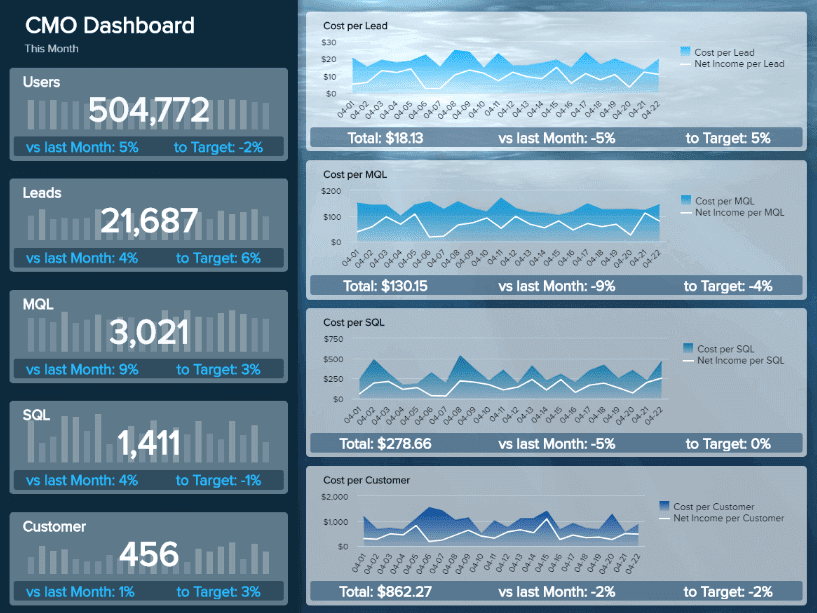
This is one of the marketing reporting template VPs, C-level executives and seniors can use to their strategic advantage and interact with each metric displayed on the screen. It shows how targets are performing in a monthly view, but the user can easily set this marketing dashboard to a yearly time frame. Often CMOs don’t have time to look into each detail of an advertising campaign but focus their resources into strategic goals of a company and this report shows us exactly what kind of metrics and insights are needed to be successful.
The layout of this marketing reporting template is clearly set to guide the viewer if the most important metrics have reached their goals or additional adjustments are needed. The funnel shows the total number of users, leads, MQL, SQL, and customers, compared to the previous period and in relation to the set goal. We can see that our number of leads has increased by 4% in comparison to the previous period, but we still miss 6% to target. Other metrics are structured similarly, which gives the CMO a clear overview of which parts of the strategy need more attention.
On the right side of this marketing report format, you can dig deeper into relevant costs: per lead, per MQL, SQL and customer as well as total costs and net income of each metric. This is useful since seniors need to know and control customer costs and the quality of leads. That way, they can compare their findings with overall sales goals and see if there is a mismatch that leads to more adjustments on operational levels.

2)Marketing KPI Report
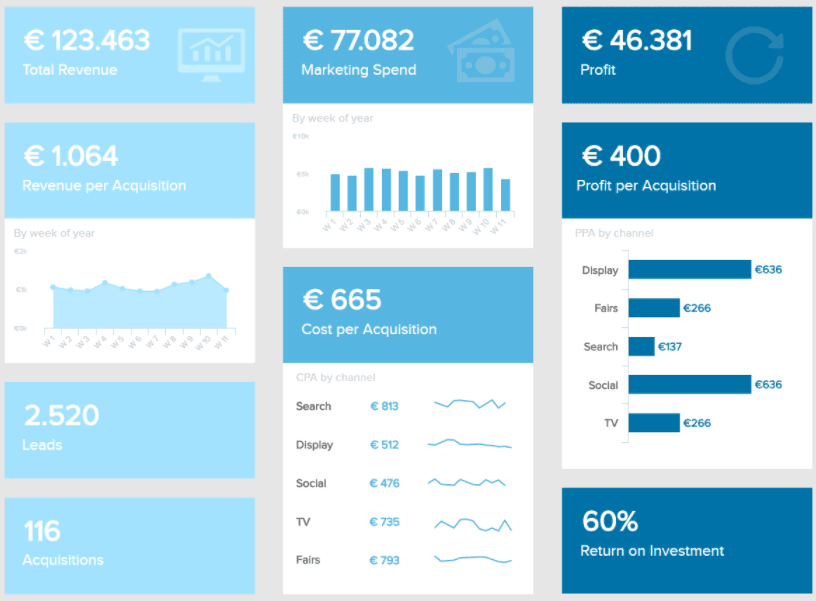
This report example gives a good overview of the most important marketing KPIs in a single glance: costs and revenue stats. In the end, this is what matters: did I get enough bang for my buck?
The design of this report for marketers is clear and lets you focus on the core metrics. Keep in mind that a metric like your CTR (click-through-rate) or the number of sessions should be understood in their globality, and not an absolute truth: increasing them will not systematically generate more profit or raise the ROI (return on investment) displayed on this dashboard. That’s why you should dig deeper: analyze the profit per acquisition you made, in comparison to the cost per acquisition over time. See which campaigns are acquiring the most customers, with the minimum of dollars invested in them. The goal is to have the highest possible return on investment at the lowest costs, but you should not forget about the whole funnel and compare it with other reports you will create.
In this particular example above, we can see how some of the metrics have performed by each week of a year, such as the revenue per acquisition, which will help you in building your future strategies and consolidate with operational objectives (more on that later). This is one of our digital marketing reports that can be seen on a monthly basis as well, it’s just a matter of filtering based on the desired time frame.
The point here is, looking at your different campaigns and channels is key to have the big picture and understand what is going on.
Monthly Marketing Report Examples And Templates
In our second part, we would like to stress the fact that you should also keep looking at the big picture. We have already stated that every report must correlate with the big picture in marketing and provide a steady connection with sales, but looking at a monthly level can deliver more insights than anything else. The weekly marketing report template we provided below in the article can be implemented into a broader perspective and utilized for monthly decisions. The channel bringing in the most traffic is not always the one bringing the best quality leads in the end – but that you cannot know before some weeks have passed. That is why a monthly marketing report is so useful, providing a cross-disciplinary overview of several parameters at stake in a campaign, that you can analyze conjointly for more accuracy.
This first monthly marketing report below provides you with a broader feeling of how your marketing campaigns are performing based on web analytics – even though, as we said, it can take too long to spot problems and adjust. This is why each of these different reports should be used conjointly, to get the best possible insights into the state of the whole department.
1) Web Analytics Report
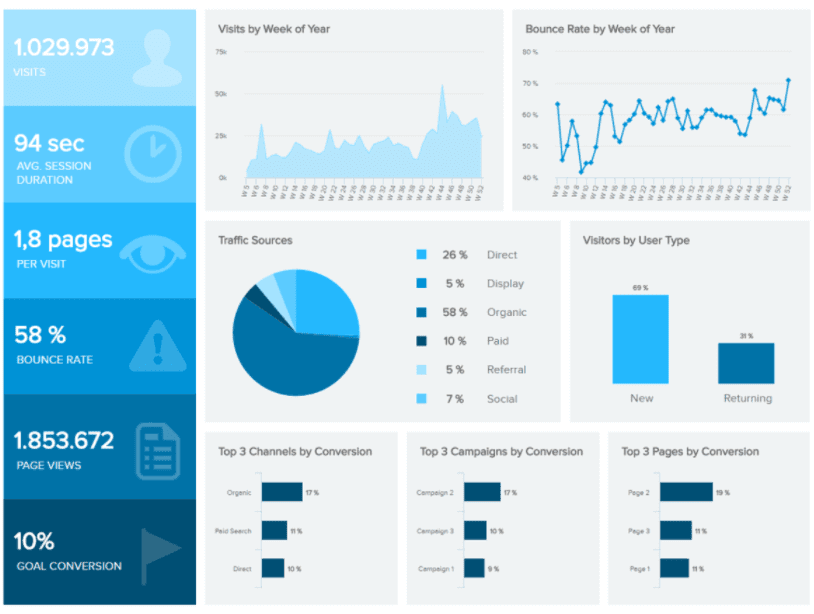
Simply, the web analytics dashboard will track all of your website traffic details that you get thanks to Google Analytics (GA). GA is a great tool and provides a lot of affordable data on your visitors. Well-designed, custom Google Analytics dashboards will give you a deeper understanding and greater clarity on your audience.
On this second monthly marketing report template, shown above, you can track basic info like the number of visitors over time, their behavior (new, returning, time on page, pages per session, …), the bounce rate, etc. In addition to the more general demographics, knowing your audience’s behavior is an asset. Secondly, monitoring the traffic sources is as important, as already stated earlier in this article. That way, you can tailor time and budget accordingly. Finally, the bottom line is the conversion. You want all of these people coming to your site to take action, and convert – whichever that conversion is, provided that you stated it beforehand: signing up for a newsletter, starting a free trial, watching a video, buying your product. Your monthly report should track these conversion rates and see how they perform compared to the initial goals.
This web marketing report basically consolidates all your GA data, often the only roadmap you have to see how your website performs and how visitors behave. Monitoring the traffic source, whether it’s paid, social, referral or organic, will tell you where your potential buyers are coming from and learn how you can improve your website to offer the best possible user experience that will, ultimately, increase your conversions.
2) Marketing Performance Report
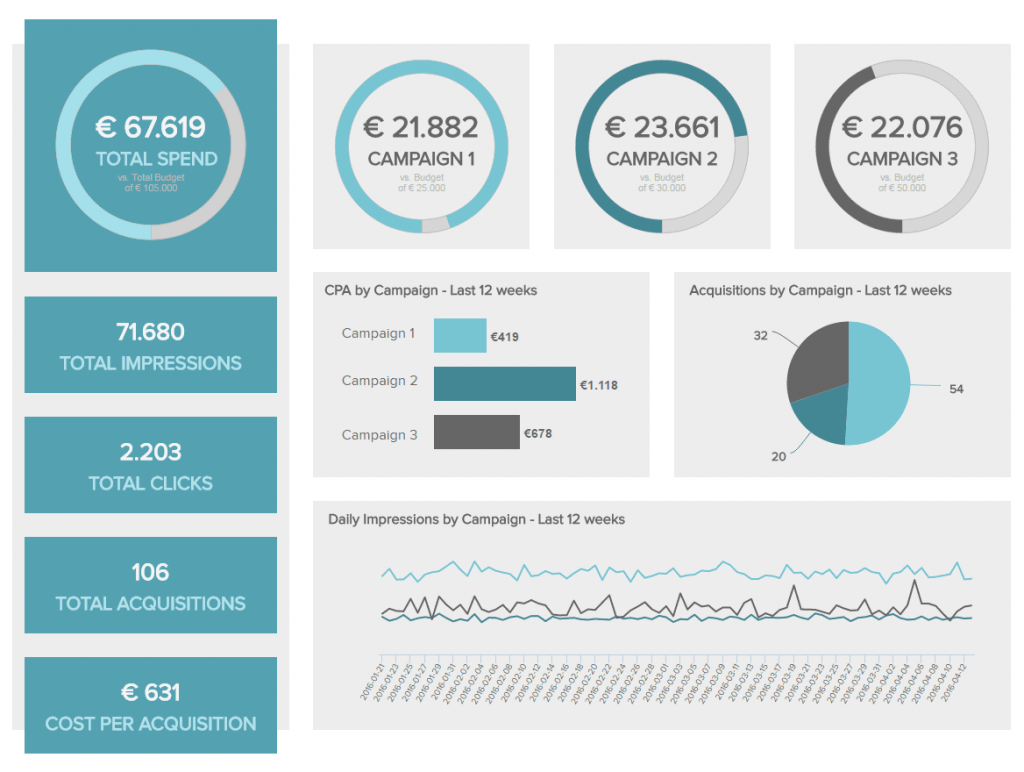
Our final monthly report is providing a good overview of the performance of all your paid advertisement campaigns. How much do you spend? Is it complying with what was initially planned? These are the questions you want to answer through that report. This monthly marketing report template also wants to answer, “how much are we spending to get a new customer”? The cost per acquisition (CPA) addresses that question according to the campaign, and you can see which is the most profitable. Thanks to these insights you know how to acquire a new customer with the minimum of investments, and can then replicate the best practices from that campaign.
In essence, this marketing campaign report template is focused on the costs of your paid promotional activities that you can easily compare, drill down into bits and pieces of each campaign and decide what strategy works best. Monitoring the total spent budget, amount of clicks, and the total number of acquisitions, just to name a few, will certainly give you an insight into which campaign performed best, which ones didn’t live to your expectations, and why.
Thanks to the data gathered on that marketing campaign performance report, you have all in hand to strategically decide where to allocate your money.
Weekly Marketing Report Examples And KPIs
The weekly monitoring of your traffic will ensure that there is no “breakdown” in the performance, that could affect a whole month’s progress. A weekly report will gather data that can be of the utmost importance to the overall marketing strategy. If you see on a daily basis that your channels aren’t performing the way you expected them to, then the weekly summary can provide you with more insights and create a basis for future decisions. Especially in digital marketing reporting, where data can change on a daily basis, but keeping in mind the big picture is crucial for a successful campaign.
1) Blog Traffic And Blog Leads Report
Some research showed that within a week of posting, a blog article’s traffic can drop by 90%. This is mainly due to the fact that you share the article on social media, which explains the short-term traffic, and the fact that after getting a couple of hundreds of visitors, depending on your reach, it may drop significantly. If it has been optimized for SEO though, you shouldn’t stop measuring it after the first week, as it needs a couple of months to reach its “cruising traffic”, and you can get several thousands of monthly visits. Tracking the weekly development of the blog traffic will show you how it actually takes off. You don’t need to panic if you don’t see the results right away, but do keep in mind the weekly progress to know when to take specific actions. If a blog post doesn’t deliver immediate results, it should not affect the whole marketing strategy, patience, in this case, is key.

UPGRADE Your Career with Digital Marketing Training By Highly Experienced Faculty
- Instructor-led Sessions
- Real-life Case Studies
- Assignments
We can see in our example below which pages have the highest number of visitors, but you can also adjust and easily filter by the number of leads. This is useful to track on a weekly basis to see if any changes in traffic or leads will signal a more lengthy trend.
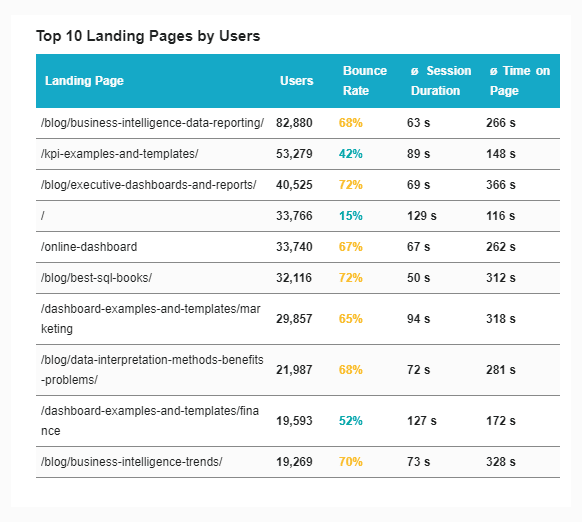
We know by now how important blogs are for companies, and not only for ranking on Google. Correlation is not limited to the number of times a company blogs and the traffic they drive, but also to the number of leads they generate. Producing a blog leads report gives a quick overview of how many leads you bring every week with your articles. Sharpening the analysis a bit more, you can see which category of articles is bringing the most traffic, and focus then on improving the quality of content in that category, to attract even more.
2) Website Traffic And Leads Per Channel
What we described above can also be applied to your website traffic in general. Breaking it down into channels and analyzing which ones are bringing in the most leads may shed light on under-performing (or on the contrary, super-performing) channels that may need more attention and investments. The number of sessions by source or by channel groupings, can track your traffic in many different ways thanks to Google Analytics KPIs available in your GA account. Having an interactive report tool to establish your performance on a weekly basis can reduce the amount of time needed to consider additional actions or to simply decide what the next step will be.
Identify which channel from paid, organic, social, referral or any other is your gem and increment your strategies’ performance in order to boost the traffic coming from it. Although keep in mind your long-term performance is one of the most important parameters to decide in which way you have to adjust your campaigns and efforts, weekly summaries can decrease the number of interdepartmental meetings between marketing professionals, and provide a faster way to analyze big data.
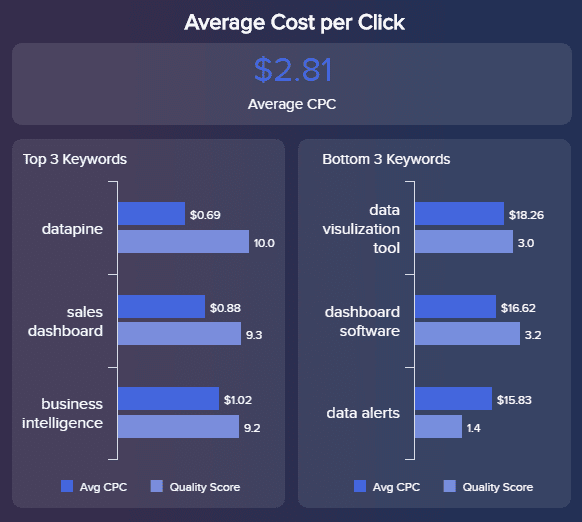
3) Online Advertising Performance
If you choose to invest money to advertise online, you also need to track how it performs. The most common pricing model, Cost-Per-Click (CPC), as presented in the picture above, is used by the main search engines like Google Ads, Yahoo Search Marketing, or Yandex Direct. In our example above, we focused on the CPC and keyword performance as well as quality scores to get a more holistic overview of our paid campaigns. You pay a fixed price for each click on your ad, and the goal is to decrease that price over time, which will decrease as a result of your customer acquisition costs (as long as your conversion rate is not decreasing). When you choose the most suitable online advertising model for your business, you can set your payment also on CPM or CPA, it all depends on which platform you want to advertise, how big is your marketing budget and which goals you expect. For example, there are programmatic advertising technologies that have their own sets of platforms on which your advertisement is shown. Also, if you set a branding campaign, then it differentiates from the standard paid search campaign. It all depends on your overall marketing strategy and how it aligns with your general sales report, which you have to keep in mind since sales are directly interconnected with marketing activities.