Last updated on 18th Apr 2025| 8030
- Introduction to Data Analytics
- Fundamentals of Data Collection and Cleaning
- Exploratory Data Analysis (EDA)
- Descriptive and Inferential Statistics
- Data Visualization Techniques and Tools
- SQL for Data Analysis
- Python and R for Data Analytics
- Machine Learning Basics for Data Analysts
- Business Intelligence and Reporting
- Real-World Case Studies and Industry Applications
- Capstone Projects in Data Analytics
- Career Opportunities After Completing a Data Analytics Course
Introduction to Data Analytics
Data analytics is the process of examining, transforming, and modeling data to discover useful insights, draw conclusions, and support decision-making. With the ever-increasing amount of data generated by businesses, organizations, and individuals, data analytics has become a crucial component of modern-day business operations. By utilizing data analytics techniques, companies can make data-driven decisions that enhance productivity, efficiency, and profitability. The field of Data Analyst encompasses various subfields, such as descriptive analytics, predictive analytics, and prescriptive analytics, each serving different functions. Data analysts are trained to examine data to uncover patterns, correlations, and trends, which are valuable in making informed decisions. In this guide, we will explore the core concepts and tools used in data analytics and how these techniques are applied in real-world scenarios.
Want to Earn Your Data Analytics Certification? Check Out Data Analytics Online Course Offered By ACTE Right Now!
Fundamentals of Data Collection and Cleaning
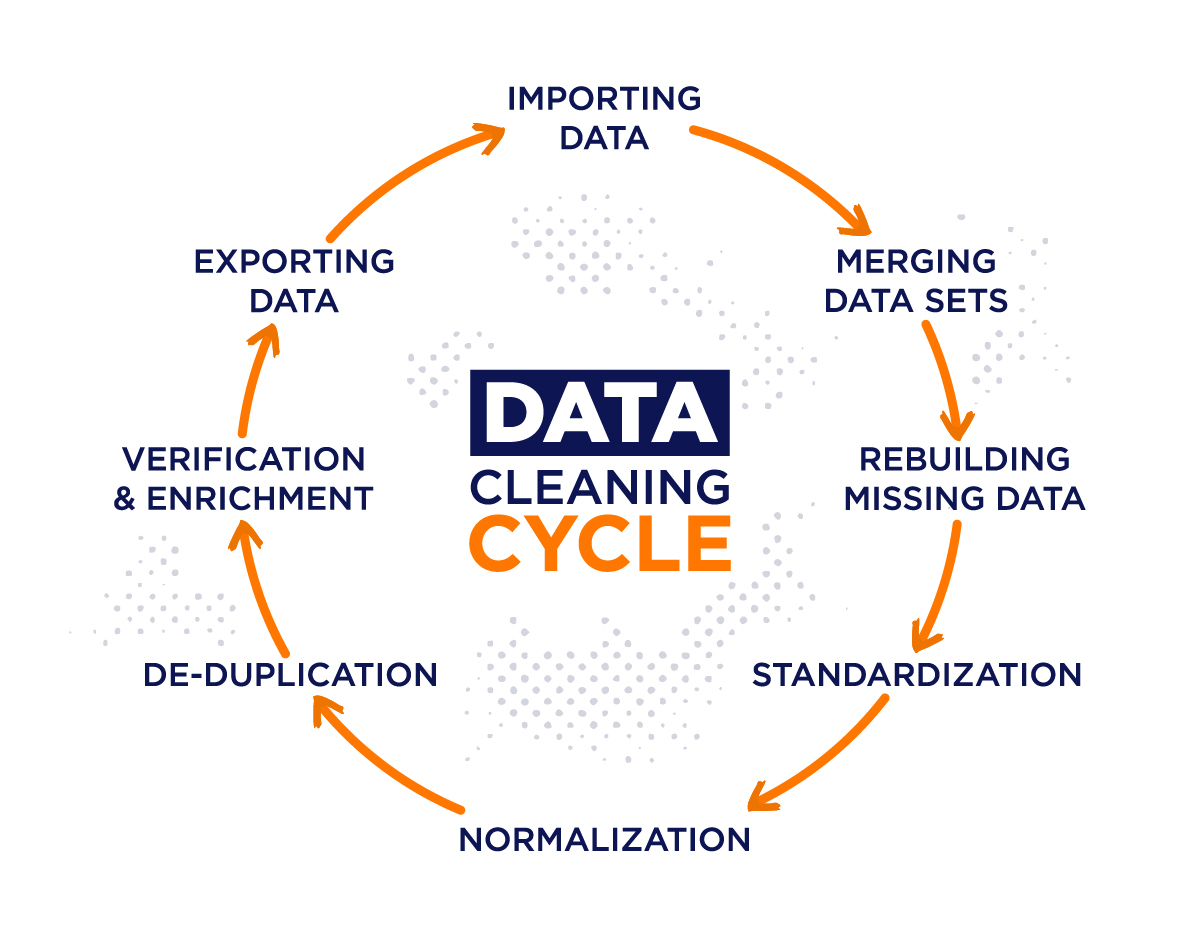
Data collection and cleaning are essential steps in the data analytics process. In order to conduct meaningful analysis, data must be gathered from relevant sources, ensuring it is accurate, reliable, and complete. Data Analyst Training helps professionals understand how to handle raw data collected from different sources, which may often contain missing values, duplicates, and errors. This is why cleaning is a critical phase in data analysis.
Data Collection Data can be collected from various sources, including:- Surveys and Questionnaires: Structured methods of gathering data directly from individuals.
- Transactional Data: Data from business transactions such as sales, purchases, and customer interactions.
- Sensor Data: Data generated from devices or IoT sensors in industries like manufacturing or healthcare.
- Public Datasets: Data made available from government sources, research institutions, or open-data platforms.
- Web Scraping: Extracting data from websites using automated scripts. Data Cleaning Data cleaning involves several key tasks:
- Handling Missing Data:Fill in missing values using imputation techniques, or remove rows or columns with excessive missing data.
- Removing Duplicates: Identifying and eliminating duplicate records that may skew analysis.
- Correcting Errors: Addressing inconsistencies in data entries, such as misspellings or incorrect formats.
- Standardizing Data: Converting data into a consistent format, for instance, converting dates to a uniform date format or currency values into a standard unit. Clean data is crucial for ensuring accurate analysis and reliable conclusions.
Exploratory Data Analysis (EDA)
Exploratory Data Analysis (EDA) marks the first step in data analysis, where analysts dive into the dataset to explore and visualize information, helping them uncover patterns, relationships, and trends. It’s a crucial phase that offers a clear overview of the data, highlights key variables, and spots any potential issues before moving on to advanced modeling techniques. If you’re looking to gain hands-on experience or deepen your understanding of EDA, check out our Data Analyst Training program designed to build your skills from the ground up.
Key Techniques in EDA:- Summary Statistics: Calculate basic statistics such as mean, median, standard deviation, and correlation to understand data distribution.
- Data Visualization: Visual tools such as histograms, box plots, scatter plots, and heat maps allow analysts to observe relationships, outliers, and distributions visually.
- Outlier Detection: Identifying outliers is important for cleaning data and preventing them from affecting the analysis.
- Correlation Analysis: Checking for correlations between variables using correlation matrices or scatter plots. EDA is crucial for making data-driven decisions, forming hypotheses, and refining the focus of deeper analysis.
- Measures of Central Tendency: Mean, median, and mode describe the center of the data.
- Measures of Dispersion: Range, variance, and standard deviation provide insights into the spread of data.
- Frequency Distribution: Displays how often different values appear in the data set Descriptive statistics are helpful for understanding the general characteristics of data, but they do not allow for generalization beyond the dataset.
- Hypothesis Testing: Testing assumptions about a population parameter (e.g., t-tests, chi-square tests).
- Confidence Intervals: Providing a range of values that are likely to contain the true population parameter.
- Regression Analysis: Identifying relationships between variables and predicting outcomes (e.g., linear regression, logistic regression). Inferential statistics help analysts make decisions and predictions beyond the dataset at hand.
- Bar Charts: Useful for comparing discrete data categories.
- Line Graphs: Used to represent trends over time or continuous data.
- Pie Charts: Display proportions and percentages of a whole.
- Heat Maps: Represent the intensity of values across two dimensions.
- Scatter Plots: Show the relationship between two variables. Popular Data Visualization Tools:
- Tableau: A powerful business intelligence tool used for creating interactive dashboards and visualizations.
- Power BI: A Microsoft tool for data analysis and visualization, widely used in business settings.
- Matplotlib and Seaborn (Python): Libraries for creating a wide range of static, animated, and interactive visualizations.
- ggplot2 (R): A popular R package for creating complex, multi-layered graphics. Data visualization helps to present complex results in an understandable format, making it easier to communicate findings to stakeholders.
- SELECT Queries: Extracting specific data from a database.
- JOIN Operations: Combining data from different tables based on common attributes
- Aggregation Functions: Using functions like COUNT, SUM, AVG, MIN, and MAX to analyze large datasets.
- Filtering Data: Using WHERE clauses to filter records based on specific conditions.
- Grouping Data: Using GROUP BY to group data into categories for summarization. SQL is fundamental for querying large databases and is widely used across industries for data analysis.
- Pandas: A library for data manipulation and analysis.
- NumPy: A library for numerical operations, especially with arrays and matrices
- Matplotlib and Seaborn: Libraries for data visualization.
- SciPy: A library for scientific and technical computing. R for Data Analytics:
- ggplot2: A popular package for creating data visualizations.
- dplyr: A library for data manipulation and transformation.
- tidyr: Used for tidying data to make it easier to analyze.
- Supervised Learning: Algorithms that learn from labeled data to make predictions (e.g., linear regression, decision trees).
- Unsupervised Learning: Techniques used to find hidden patterns in unlabeled data (e.g., k-means clustering, principal component analysis).
- Model Evaluation: Understanding accuracy, precision, recall, and F1-score to assess the performance of ML models.
- Tableau and Power BI: Widely used for creating reports, dashboards, and visualizations.
- QlikView: A self-service BI tool that allows users to create reports and dashboards with minimal technical knowledge. Data analysts play a critical role in business intelligence by analyzing data and creating meaningful reports that drive decision-making.
- Retail: Analyzing customer behavior and sales patterns to optimize inventory and enhance customer experiences.
- Healthcare: Using data analytics to predict patient outcomes, improve treatments, and reduce costs.
- Finance: Fraud detection, risk analysis, and algorithmic trading.
- Sports: Analyzing player performance and game statistics to make strategic decisions.
- Gathering data from various sources.
- Cleaning and preparing the data for analysis.
- Applying statistical and machine learning models.
- Visualizing the results and presenting actionable insights.
- Data Analyst: Analyzes data to generate insights and help organizations make data-driven decisions.
- Business Intelligence Analyst: Works with BI tools to analyze business data and create reports.
- Data Scientist: Uses advanced statistical methods and machine learning to analyze data and make predictions.
- Data Engineer: Designs and implements data pipelines for data ingestion, transformation, and storage.
- Quantitative Analyst: Works in finance to apply statistical and mathematical models to data.
Descriptive and Inferential Statistics
Data analytics relies heavily on statistical techniques to interpret data. These can be broadly categorized into descriptive and inferential statistics.
Descriptive Statistics
Descriptive statistics summarize and describe the main features of a dataset. Common methods in descriptive statistics include:
Inferential Statistics
Inferential statistics allow analysts to make predictions or inferences about a population based on sample data. Key concepts in inferential statistics include:
Earn Your Data Analytics Certification, Gain Insights From Leading DevOps Experts And Advance Your Career With ACTE’s Data Analytics Online Course Today!
Data Visualization Techniques and Tools
Data visualization is an integral part of data analytics. It involves the graphical representation of data to help individuals better understand trends, patterns, and insights.
Common Data Visualization Techniques: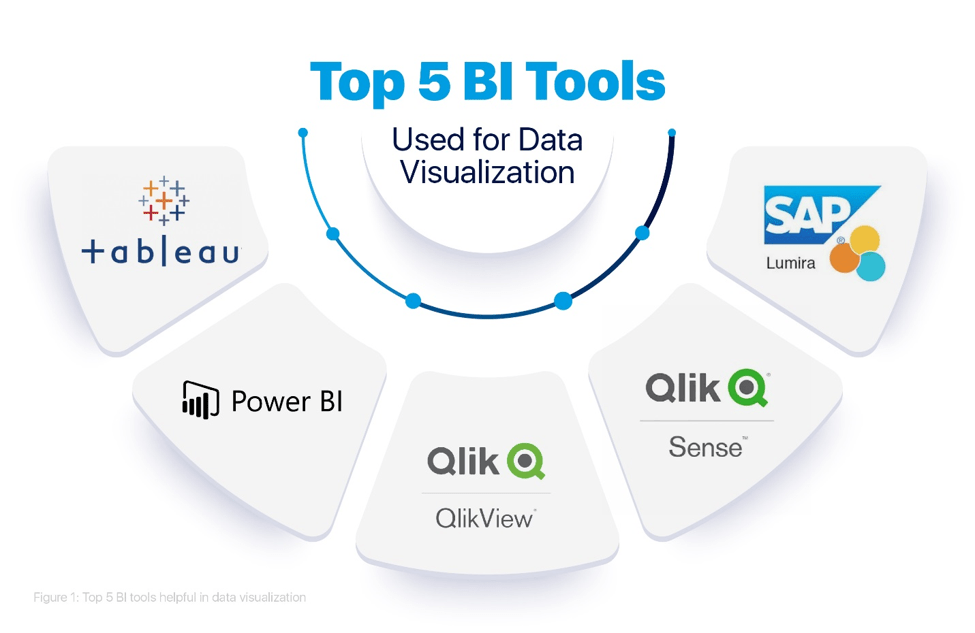
SQL for Data Analysis
Structured Query Language (SQL) is a powerful tool used for managing and querying relational databases. It is essential for data analysts to know SQL as it allows them to extract, filter, and perform data manipulation in SQL on data stored in databases.
Key SQL Skills for Data Analysis:
Python and R for Data Analytics
Python is versatile and widely used in the data science community. Key libraries for data analysis include:
R is specifically designed for statistical computing and is widely used for data analysis in academia and research. Key R libraries include:
Both Python and R are essential for data analytics professionals, with Python being more versatile for general programming tasks, while R excels in statistical analysis and visualizations.
Considering Pursuing a Data Analyst Master’s Degree? Enroll For Data Analyst Masters Course Today!
Machine Learning Basics for Data Analysts
Machine learning (ML) uses algorithms that learn from data to generate predictions. Although becoming a machine learning expert isn’t necessary for every data analyst, having a foundational understanding of ML is crucial for improving your skills with Data analytics tools
Common Machine Learning Techniques for Data Analysts:Basic knowledge of ML helps data analysts to take their analysis to the next level and uncover deeper insights.
Business Intelligence and ReportingBusiness Intelligence (BI) refers to the technologies, practices, and tools used to collect, analyze, and present business data. BI systems help organizations make data-driven decisions by providing insights into key business metrics and trends.
BI Tools:Real-World Case Studies and Industry Applications
Data analytics is used across various industries to solve business problems. For example:
Real-world case studies provide a practical understanding of how data analytics can be applied in different domains.
Capstone Projects in Data Analytics
Capstone projects are an integral part of data analytics courses and training programs. These projects allow students to apply the skills they’ve learned in real-world scenarios. A typical capstone project involves:
Capstone projects help to solidify the knowledge gained during the course and are a valuable addition to a data analyst’s portfolio.
Career Opportunities After Completing a Data Analytics Course
After completing a data analytics course, numerous career opportunities become available:
The demand for data analytics professionals continues to rise as businesses increasingly rely on data to guide their decisions.
In conclusion, data analytics is a powerful tool that can help organizations unlock insights, optimize operations, and make informed decisions. By mastering the fundamentals, tools, and techniques of data analytics, professionals can enhance their career prospects and contribute to the growth of data-driven organizations.