Last updated on 08th May 2024| 5963
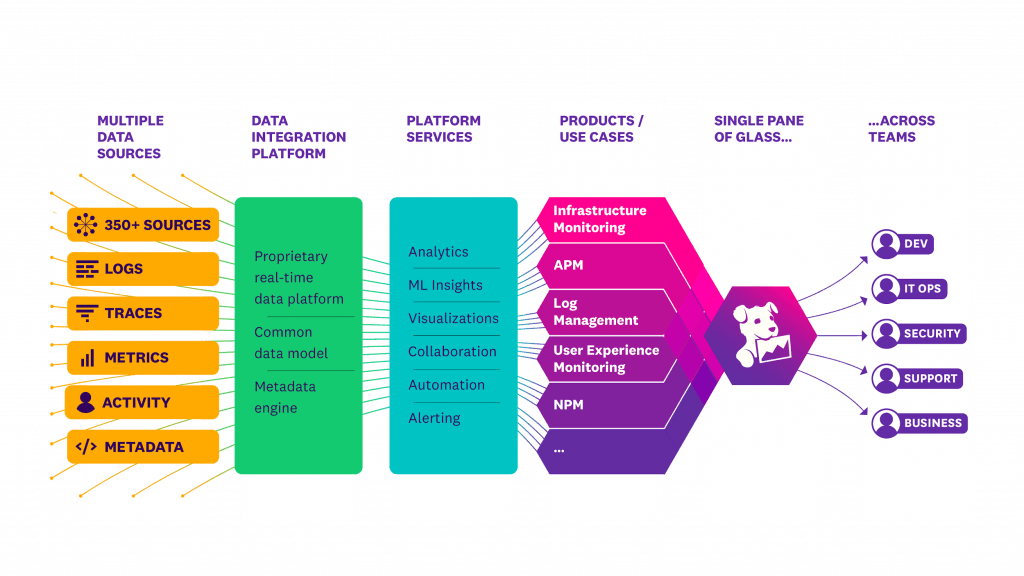
Datadog is a popular monitoring and analytics platform used for monitoring the performance of applications, infrastructure, and cloud services. A Datadog course typically covers various aspects of using the Datadog platform effectively for monitoring, troubleshooting, and optimizing systems.
1. What is Datadog?
Ans:
Datadog is a comprehensive monitoring and analytics platform designed for cloud-scale applications, offering observability into dynamic infrastructure and applications. It enables users to collect, visualize, and analyze metrics, traces, and logs from various sources, facilitating proactive monitoring and troubleshooting. With its customizable dashboards, alerting capabilities, and collaboration tools, Datadog empowers organizations to optimize performance, ensure reliability, and enhance the efficiency of their IT operations.
2. How does DataDog work?
Ans:
Datadog works by deploying an agent onto servers, containers, or other infrastructure components. This agent collects metrics, traces, and logs from these sources. The data is then securely transmitted to the Datadog platform for analysis. Through aggregation and correlation, Datadog provides insights into the performance and health of the entire infrastructure. Users can visualize this data on customizable dashboards, set up alerts for abnormal behavior, and collaborate with team members to address issues effectively.
3. What are the Features of Datadog?
Ans:
- Real-time monitoring of infrastructure and applications.
- Comprehensive APM (Application Performance Monitoring) capabilities.
- Log management for centralized log aggregation and analysis.
- Infrastructure monitoring for cloud, on-premises, and hybrid environments.
- Customizable dashboards to visualize and analyze data.
- Alerting and collaboration tools to facilitate rapid issue resolution.
4. What method does Datadog use to collect data?
Ans:
- Datadog employs agents, lightweight software
- Deployed on servers, containers, and hosts,
- These agents monitor performance metrics,
- Collecting data on resource usage and more.
- They transmit this data to the Datadog platform,
- Where it’s processed and analyzed for insights galore.
5. What is the difference between Datadog’s infrastructure and application monitoring?
Ans:
Yes, it’s possible to send logs to Datadog without their agent.Using Datadog’s API, logs can be pushed directly to their service.Various libraries and frameworks offer integrations for seamless log transmission.Custom scripts can also be written to format and transmit logs to Datadog.However, using Datadog’s agent can simplify log management and provide additional features.Ultimately, the decision depends on the specific requirements and preferences of the user.
6. What is the difference between Datadog’s infrastructure and application monitoring?
Ans:
| Aspect | Infrastructure Monitoring | Monitoring |
|---|---|---|
| Scope | Focuses on monitoring the performance and health of underlying infrastructure components such as servers, databases, networks, and cloud services. | Concentrates on monitoring the behavior, performance, and availability of software applications and services running on the infrastructure. |
| Metrics Tracked | Monitors metrics related to resource utilization, system performance, network traffic, and infrastructure availability. | Tracks metrics specific to application performance, such as response times, error rates, throughput, and dependencies. |
| Use Cases | Useful for detecting issues related to server load, disk space, memory usage, network latency, and other infrastructure-related problems. | Helps in identifying application-level issues like slow database queries, memory leaks, inefficient code, and service dependencies. |
| Granularity of Insights | Provides insights into the overall health and performance of infrastructure components, allowing for proactive monitoring and capacity planning. | Offers detailed insights into the behavior and performance of individual application components, enabling developers to optimize performance and troubleshoot issues efficiently. |
7. Who uses Datadog?
Ans:
Datadog is utilized by IT teams worldwide,From startups to Fortune 500 companies, it’s relied upon,DevOps engineers find it invaluable for monitoring,Cloud architects leverage its insights for optimization,Software developers use it to track performance,Across industries, from tech to finance, Datadog finds its place.
8. Which are the main advantages of utilising Datadog?
Ans:
- Datadog offers real-time monitoring, alerting, and visualization,
- Helping teams identify and troubleshoot issues with precision.
- Its comprehensive platform integrates with many tools and services,
- Providing a unified view across the entire infrastructure stack.
- With robust analytics and AI-driven insights, performance optimization is streamlined,
- Empowering teams to improve efficiency and enhance user experience.
9. What is the process for sending Datadog Tags in Exometer?
Ans:
To send Datadog Tags in exometer,First, ensure the Datadog client is configured.Then, add tags to your metrics using exometer.
For example, use `exometer_statsd:increment/3` with tags.Pass tags as a list of key-value pairs.These tags will be sent along with your metrics.Ensure Datadog recognizes and interprets them correctly.
10. What approach does Datadog use to monitor scalable systems?
Ans:
- Datadog scales with ease, monitoring diverse arrays,
- Agents deployed, capturing metrics in real-time ways.
- Metrics, traces, logs, all seamlessly aligned,
- Tracking performance, ensuring systems are refined.
- Auto-scaling alerts, proactive in its approach,
- Datadog’s insight empowers, systems it encroaches.
11. Which are the main benefits of utilising Datadog?
Ans:
- Datadog offers comprehensive monitoring for diverse systems.
- Its centralized platform integrates metrics, traces, and logs.
- Real-time visibility enables proactive issue resolution.
- Auto-scaling alerts ensure timely responses to anomalies.
- Extensive integrations support seamless workflow integration.
- Scalability and flexibility adapt to evolving infrastructure needs.
12. What types of problems does Datadog resolve?
Ans:
- Datadog resolves issues related to performance bottlenecks.
- It identifies and troubleshoots system errors swiftly.
- Resource utilization is optimized through insightful metrics.
- Scalability challenges are addressed with auto-scaling capabilities.
- Complex architectures are managed effectively through centralized monitoring.
- Security vulnerabilities are detected and mitigated in real-time.
13. What makes a Cliff AI different from a Datadog?
Ans:
Cliff AI primarily focuses on AI-driven analytics and insights.It may offer predictive analytics and anomaly detection specific to AI models.Datadog, on the other hand, provides broader system monitoring capabilities.Datadog integrates metrics, logs, and traces across various systems.Cliff AI’s specialization lies in AI model performance optimization.Both tools may complement each other in a comprehensive monitoring strategy.
14. What distinguishes Datadog?
Ans:
Datadog stands out for its comprehensive monitoring solution. Its integration of metrics, logs, and traces streamlines troubleshooting. Real-time visibility and alerts enable proactive issue resolution. Extensive integrations support seamless workflow integration. Auto-scaling capabilities adapt to changing infrastructure demands. The platform’s scalability and flexibility accommodate diverse system architectures.
15. Where are the Datadog files stored?
Ans:
- Datadog files are typically stored within Datadog’s cloud infrastructure.
- This includes metrics, logs, traces, and configuration data.
- Storage may vary depending on the specific service or feature used.
- Files can be accessed and analyzed through Datadog’s web interface.
- Users can also export data for further analysis or archival purposes.
- Data storage complies with Datadog’s security and privacy standards.
16. Where is Datadog hosted, and is it on Azure?
Ans:
Datadog can be hosted on Azure cloud infrastructure. It provides monitoring and analytics capabilities for Azure services and seamlessly integrates with Azure Monitor for comprehensive monitoring. Users can monitor Azure resources, applications, and infrastructure in real-time, including metrics, logs, and traces from Azure services. Datadog’s Azure integration ensures visibility and performance optimization.
17. What characteristics does Datadog have?
Ans:
Its comprehensive monitoring capabilities characterize Datadog. It offers real-time visibility into system metrics, logs, and traces. Auto-scaling alerts enable proactive issue resolution. The platform supports extensive integrations with various tools and services. Scalability and flexibility adapt to evolving infrastructure needs. Datadog prioritizes ease of use and seamless workflow integration.
18. What are the most important reasons to use Datadog?
Ans:
- Datadog provides comprehensive monitoring for diverse systems.
- Its centralized platform integrates metrics, logs, and traces.
- Real-time visibility enables proactive issue resolution.
- Auto-scaling alerts ensure timely responses to anomalies.
- Extensive integrations support seamless workflow integration.
- Scalability and flexibility adapt to evolving infrastructure needs.
19. What is a Datadog span?
Ans:
A Datadog span refers to a unit of work within a distributed system. It represents a specific operation or transaction across multiple services. Spans include metadata such as start time, duration, and associated tags. They are essential for tracing and understanding system behavior. Datadog’s tracing feature aggregates spans to visualize request flows. Spans provide insights into system performance and dependencies.
20. How will you calculate the interval between Datadog logs?
Ans:
- The interval between Datadog logs can be calculated by subtracting the timestamps of consecutive logs.
- Determine the time difference between the timestamps of the latest and earliest logs.
- This time difference represents the interval between the logs.
- Alternatively, utilize Datadog’s logging features to extract logs with specific time intervals.
- Datadog’s querying capabilities enable precise retrieval of logs within desired timeframes.
21. What are the differences between Prometheus and Datadog?
Ans:
Prometheus offers open-source monitoring, while Datadog is a commercial platform. Prometheus relies on a pull-based model for metrics collection, whereas Datadog uses agents for data collection. Datadog provides a wider range of integrations and features compared to Prometheus. Additionally, Datadog typically offers more out-of-the-box dashboards and advanced analytics capabilities.
22. What are some alternatives to Datadog for monitoring?
Ans:
Some alternatives to Datadog include Prometheus, Grafana, New Relic, Splunk, and Zabbix. Prometheus offers open-source monitoring with a focus on reliability and scalability. Grafana provides visualization and monitoring capabilities, often used alongside Prometheus or other data sources. Additionally, New Relic is known for its application performance monitoring, while Splunk excels in log management and analytics. Zabbix is a comprehensive open-source monitoring solution with extensive customization options.
23. What is the method for integrating Datadog with Kubernetes?
Ans:
Datadog can integrate with Kubernetes for monitoring containerized environments. Datadog provides a Kubernetes integration that collects metrics from Kubernetes API and Kubelet. It offers visibility into resource usage, performance metrics, and the health of Kubernetes clusters. Datadog can monitor Kubernetes pods, deployments, services, and nodes. It supports auto-discovery of new services and dynamically scales with Kubernetes deployments.
24. How does Datadog handle metric aggregation?
Ans:
- Datadog aggregates metrics using its agents deployed across the infrastructure.
- Agents collect and aggregate metrics locally before sending them to the Datadog backend.
- Datadog offers customizable metric aggregation based on tags, filters, and functions.
- Users can aggregate metrics from various sources, such as applications, infrastructure, and cloud services.
25. What role does anomaly detection play in Datadog?
Ans:
- Anomaly detection in Datadog helps identify unusual behavior or deviations from normal patterns in metrics.
- It automatically detects anomalies in metrics data and alerts users for potential issues.
- Anomaly detection improves incident response time by highlighting abnormal system behavior.
- Datadog’s anomaly detection algorithms adapt to changing patterns and seasonality in data.
- It reduces false positives by considering historical trends and patterns.
26. What methods does Datadog use to support monitoring of containerized environments?
Ans:
Datadog provides comprehensive support for monitoring containerized environments such as Docker and Kubernetes. It offers container-specific integrations that collect metrics, logs, and traces from containers. Datadog’s agents can be deployed as sidecar containers to monitor individual containers or as DaemonSets in Kubernetes clusters.
27. What capabilities does Datadog have for monitoring serverless architectures?
Ans:
Datadog can monitor serverless architectures across various cloud platforms. It offers integrations with serverless computing services such as AWS Lambda, Azure Functions, and Google Cloud Functions. Datadog collects metrics, logs, and traces from serverless functions to provide visibility into their performance and health. Additionally, Datadog provides features for tracking serverless invocations and latency, helping to identify performance bottlenecks and optimize function efficiency.
28. What is distributed tracing, and how does Datadog support it?
Ans:
- Distributed tracing is a method used to monitor and troubleshoot microservices-based architectures.
- Datadog supports distributed tracing through its APM (Application Performance Monitoring) solution.
- It traces requests as they traverse through multiple services and components of a distributed system.
- Datadog automatically instruments applications to capture trace data without code modification.
29. What options does Datadog provide for creating custom dashboards?
Ans:
Yes, Datadog offers custom dashboard creation to visualize and monitor metrics relevant to users’ needs. Users can create dashboards using a drag-and-drop interface, selecting metrics, graphs, and visualizations. Datadog provides various widgets and templates to customize dashboards according to specific requirements.
Dashboards can include metrics from different sources, such as infrastructure, applications, and cloud services.
30. What strategies does Datadog use to handle high availability and scalability?
Ans:
- Datadog ensures high availability and scalability through its distributed architecture and redundant infrastructure.
- It operates across multiple data centers and regions to minimize downtime and ensure reliability.
- Datadog dynamically scales its infrastructure to handle fluctuations in data volume and workload.
- It employs load balancing, auto-scaling, and failover mechanisms to maintain service availability.
31. What capabilities does Datadog offer for monitoring hybrid cloud environments?
Ans:
Yes, Datadog can monitor hybrid clouds without bounds, Agents deployed across cloud and on-premises grounds. Unified visibility achieved, regardless of location,
Metrics, logs, traces—essential information compilation. Seamless integration, bridging gaps with ease, Datadog ensures hybrid setups operate with peace.
32. What is the process for setting up alerts in Datadog?
Ans:
Setting up alerts in Datadog is a streamlined process. You define thresholds, conditions, and other parameters to tailor your alerts. Customize notifications and choose preferred channels for alerting to ensure timely responses. Additionally, you can leverage Datadog’s advanced features to create complex alert conditions and integrate with various tools, ensuring comprehensive monitoring and swift reaction to issues.
33. What approach does Datadog use for handling metric retention?
Ans:
- Metric retention in Datadog is a flexible affair,
- Customizable retention policies, ensuring data care.
- Granular control over retention periods, tailored to need,
- Ensuring historical metrics are readily available to heed.
- Options to archive or delete, as policies dictate,
- Datadog’s retention management, keeping data’s fate.
34. What integrations does Datadog offer with AWS services?
Ans:
- Indeed, Datadog and AWS integration are strong,
- Monitoring AWS services, where metrics belong.
- From EC2 to S3, Lambda to RDS,
- Datadog’s integrations cover AWS’s vast address.
- Gain insights across your AWS stack with ease,
- Datadog’s integration brings monitoring expertise.
35. What options are available for routing alerts from a single Datadog monitor to different Slack channels?
Ans:
Alerts from a single DataDog monitor can be directed to different Slack channels, streamlining notification strategies. This flexibility enables tailored alert delivery, ensuring pertinent information reaches the right recipients promptly. By configuring monitors with specific criteria, teams can optimize communication workflows, enhancing response efficiency. DataDog’s versatile routing capabilities empower users to align alerting systems with organizational needs effectively.
36. What tools does Datadog provide to assist in troubleshooting performance issues?
Ans:
Datadog aids in troubleshooting with profound insights, Identifying bottlenecks wherever they’re found. Visualizations, traces, logs—all in one place, Pinpointing issues, accelerating the chase.With real-time data and historical trends to explore,
Datadog’s assistance makes troubleshooting no more a chore.
37. What integrations does Datadog offer for CI/CD pipelines?
Ans:
Datadog integrates seamlessly with CI/CD pipelines, tracking performance as code progresses through various stages. It provides observability into each step, from build to deployment, ensuring smooth releases without issues. Metrics and logs are continuously analyzed, and Datadog’s integration helps maintain an efficient pipeline flow by delivering real-time insights and alerts. Additionally, Datadog can visualize metrics and logs in context with code changes, facilitating rapid troubleshooting and optimization throughout the CI/CD proces
38. What capabilities does Datadog have for monitoring network performance?
Ans:
- Absolutely, Datadog extends its monitoring embrace,
- Capturing network performance with unwavering grace.
- From traffic volume to latency, every detail it captures,
- Ensuring networks operate smoothly, without fractures.
- Visualizations and alerts, keeping network health in sight,
- Datadog’s network monitoring ensures everything’s right.
39. What approach does Datadog take to handle security monitoring?
Ans:
Datadog’s security monitoring is robust and keen, Detecting threats and anomalies unseen. Logs, metrics, and traces were analyzed with precision, Identifying potential breaches without any omission. Compliance checks and threat detection, all in one place,
Datadog’s security features offer a comprehensive embrace.
40. What are some best practices for using Datadog effectively?
Ans:
- To wield Datadog effectively, here are some clear guidelines,
- Define your monitoring goals, ensuring they’re sincere.
- Leverage tags and labels for organization profound,
- Segment data effectively, and insights are easily found.
- Utilize dashboards and alerts for actionable insight,
- And regularly review and refine, keeping performance tight.

Get JOB Datadog Training for Beginners By MNC Experts
- Instructor-led Sessions
- Real-life Case Studies
- Assignments
41. What features does Datadog offer for monitoring real-time application performance?
Ans:
Datadog excels in real-time monitoring by capturing metrics continuously and offering instant insights. It tracks performance with precision and low latency, promptly alerting you to any anomalies or issues. Real-time dashboards provide live views for in-depth analysis, and its advanced analytics tools help diagnose and resolve problems quickly. Datadog ensures that applications perform at peak efficiency by delivering comprehensive, actionable data in real time.
42. What methods does Datadog use to handle time-series data?
Ans:
- Datadog efficiently stores and processes time-series data.
- It leverages optimized data structures for scalability.
- Aggregation functions enable meaningful analysis over time.
- Flexible retention policies cater to various data needs.
- Time-series data is easily visualized through customizable dashboards.
- Datadog ensures accurate and actionable insights from time-series data.
43. What is the role of agents in Datadog monitoring?
Ans:
- Agents collect and send data to Datadog’s platform.
- They monitor system metrics, logs, and traces.
- Agents deploy seamlessly across diverse environments.
- Customizable configurations adapt to specific monitoring needs.
- Agents ensure real-time visibility into system performance.
- Datadog’s monitoring relies on the efficient operation of these agents.
44. How does Datadog handle custom metrics?
Ans:
Datadog effortlessly accommodates custom metrics, which can be ingested via various integrations. It provides APIs for custom metric ingestion and querying. Custom metric visualizations are easily created on dashboards. Alerting mechanisms support custom metric thresholds. Datadog ensures comprehensive monitoring, including custom metrics.
45. What capabilities does Datadog offer for monitoring databases?
Ans:
Yes, Datadog offers extensive database monitoring capabilities. It supports various database technologies and vendors. Metrics such as queries per second and latency are tracked. Database performance insights aid in optimization and troubleshooting. Customized alerts notify of database-related issues promptly. Datadog ensures holistic monitoring, including databases.
46. What are some common use cases for Datadog in DevOps?
Ans:
- Datadog serves as a central tool for DevOps teams.
- Monitoring infrastructure, applications, and services in real time.
- Streamlining deployment processes with continuous integration.
- Automating alerting and remediation to enhance reliability.
- Facilitating collaboration between development and operations teams.
- Datadog empowers DevOps practices with actionable insights.
47. What tools does Datadog provide to assist with capacity planning?
Ans:
- Datadog provides comprehensive insights for capacity planning.
- Historical data analysis aids in predicting future resource needs.
- Real-time monitoring helps in understanding current utilization levels.
- Customizable dashboards visualize key performance indicators.
- Autoscaling alerts trigger based on predefined thresholds.
- Datadog’s data-driven approach optimizes capacity planning processes.
48. What API access does Datadog provide for custom integrations?
Ans:
Yes, Datadog offers robust API access for custom integrations.APIs enable seamless integration with existing toolchains, and custom scripts and applications can interact with Datadog’s platform.APIs support data ingestion, querying, and visualization. Developers leverage APIs to extend monitoring capabilities. Datadog’s API ecosystem enhances flexibility and extensibility.
49. What approach does Datadog use for handling multi-cloud monitoring?
Ans:
Datadog excels in multi-cloud monitoring scenarios. It provides unified visibility across multiple cloud providers. Agents deploy effortlessly in various cloud environments. Customizable dashboards consolidate data from different clouds. Integration with cloud-native services ensures comprehensive coverage. Datadog ensures seamless monitoring in complex multi-cloud architectures.
50. What features does Datadog offer for monitoring serverless functions?
Ans:
- Yes, Datadog offers specialized monitoring for serverless functions.
- It supports popular serverless platforms like AWS Lambda.
- Metrics, logs, and traces from serverless functions are captured.
- Customizable dashboards visualize serverless performance metrics.
- Alerts notify of issues or anomalies in serverless function execution.
- Datadog ensures holistic monitoring, including serverless environments.
51. What are some common challenges in implementing Datadog?
Ans:
- Initial configuration complexity, ensuring all metrics are captured.
- Integrating with existing tools and systems for seamless operation.
- Optimizing resource usage to prevent performance overhead.
- Training staff for effective use and interpretation of data.
- Ensuring compliance and security measures are met.
- Managing costs as usage scales, avoiding unexpected expenses.
52. What methods does Datadog use to assist in monitoring microservices?
Ans:
Provides detailed insights into each microservice’s performance. It captures metrics related to latency, error rates, and throughput. Utilizes distributed tracing to identify bottlenecks across services.Offers service maps for visualizing dependencies and interactions.Supports auto-discovery of new microservices for seamless integration.Enables setting alerts based on microservice-specific metrics.
53. What capabilities does Datadog have for monitoring user experience and performance?
Ans:
It offers real user monitoring (RUM) for tracking user interactions. It measures frontend performance metrics like page load times and interactions. It provides insights into user behavior and engagement. It helps identify performance issues impacting user experience. It integrates with synthetic monitoring for proactive testing. It enables the correlation of user experience data with backend performance.
54. What approach does Datadog take to handle billing and pricing?
Ans:
- Offers flexible pricing based on metrics, hosts, and additional features.
- Provides usage-based billing, allowing scaling according to needs.
- Offers transparent pricing plans with clear feature differentiations.
- Allows monitoring and adjusting usage to control costs.
- Provides billing insights and reports for cost optimization.
- Offers enterprise agreements and custom pricing for larger deployments.
55. What are some recommended alerting strategies with Datadog?
Ans:
- Set thresholds based on historical performance data.
- Utilize anomaly detection for automatic alert triggering.
- Implement multi-alert correlation to reduce alert fatigue.
- Utilize tags and groups for granular alerting based on specific components.
- Establish escalation policies for critical alerts.
- Regularly review and refine alerting configurations based on changing needs.
56. What features does Datadog offer for handling custom dashboards and visualizations?
Ans:
Offers a drag-and-drop dashboard builder for custom layouts.Supports widgets for displaying various data sources and metrics.Provides customization options for visualizing data with charts and graphs.Allows sharing dashboards across teams for collaborative monitoring.Supports dashboard APIs for programmatic dashboard creation.Enables integration with third-party visualization tools for extended functionality.
57. What capabilities does Datadog have for monitoring IoT devices?
Ans:
Datadog can monitor IoT devices through custom integrations. It utilizes IoT-specific protocols for data collection and monitoring, captures metrics related to device performance, connectivity, and usage, provides insights into IoT device behavior and health, supports alerting based on IoT device metrics, and enables visualization and analysis of IoT device data alongside other infrastructure metrics.
58. What methods does Datadog use to assist in monitoring serverless containers?
Ans:
- Integrates with serverless platforms to monitor containerized workloads.
- Captures metrics related to serverless container performance and usage.
- Provides insights into resource utilization and scaling behavior.
- Supports tracing and logging for serverless containerized applications.
- Enables setting alerts based on container metrics and performance.
- Offers specialized monitoring for serverless architectures to optimize performance and costs.
59. What role does APM (Application Performance Monitoring) play in Datadog?
Ans:
- APM in Datadog provides insights into application performance and dependencies.
- Captures detailed traces and metrics to identify performance bottlenecks.
- Offers distributed tracing to map transactions across microservices.
- Provides code-level visibility for troubleshooting and optimization.
- Integrates with infrastructure monitoring for holistic insights.
- Enables setting alerts based on application performance metrics.
60. What approach does Datadog use for log management and analysis?
Ans:
Collects logs from various sources, including applications and infrastructure.Supports log aggregation and parsing for efficient storage and analysis.Provides powerful search and filtering capabilities for log analysis.Offers visualization tools for understanding log data trends and patterns.Integrates with monitoring and alerting systems for correlation with metrics. Supports log-based alerting and anomaly detection for proactive monitoring.

61. What integrations does Datadog offer with third-party tools and services?
Ans:
Yes, Datadog offers extensive integrations, seamlessly interacting with different tools and services. From AWS to Slack, the options are vast. Integrations enable holistic monitoring across the stack, and they are easy to set up, enhancing operational tracks. Additionally, Datadog’s API allows for custom integrations, providing flexibility to connect with virtually any third-party service or tool you use.
62. What measures does Datadog take to handle data privacy and compliance?
Ans:
- Datadog prioritizes data privacy and compliance,
- Adhering to strict standards to safeguard information.
- Encryption, access controls, and auditing are key,
- Ensuring data is protected, meeting regulatory decree.
- With GDPR and HIPAA in mind, users trust Datadog’s guarantee.
63. What role does machine learning play in Datadog’s monitoring capabilities?
Ans:
- Machine learning enhances datadog’s monitoring prowess,
- Analyzing vast datasets to identify anomalies and trends.
- Predictive alerts and dynamic baselines emerge,
- Automating insights, reducing manual urge.
- With ML, Datadog optimizes performance, providing a competitive surge.
64. What capabilities does Datadog offer for monitoring serverless databases?
Ans:
Datadog adeptly monitors serverless databases by tracking performance metrics and resource usage. It supports platforms like AWS Lambda and Azure Functions, providing insights into function executions and errors. Datadog also integrates with serverless databases to offer detailed visibility into queries, latency, and throughput, ensuring that serverless monitoring is both comprehensive and efficient.
65. What methods does Datadog use to assist in monitoring cloud-native applications?
Ans:
Datadog offers tailored solutions for cloud-native apps, Providing visibility into containers, microservices, and beyond. Kubernetes orchestration and Docker monitoring are robust, and Insights into performance and dependencies are disclosed.
With Datadog, cloud-native monitoring is effortlessly unshackled.
66. What are some common integrations available in Datadog Marketplace?
Ans:
- Datadog Marketplace hosts a plethora of integrations,
- Covering databases, messaging platforms, and more destinations.
- MySQL, Kafka, and Jira are among the popular picks,
- Expanding Datadog’s capabilities with just a few clicks.
- With the Marketplace, customization swiftly takes flight.
67. What capabilities does Datadog offer for monitoring on-premises infrastructure?
Ans:
Datadog effectively monitors on-premises infrastructure by deploying agents that gather metrics with precision. It provides profound insights into servers, networking gear, and other on-premises components, bridging the gap between legacy systems and modern cloud environments. Additionally, Datadog offers unified visibility by integrating on-premises data with cloud-based metrics, ensuring comprehensive monitoring across your entire infrastructure.
68. What approach does Datadog take to monitor distributed architectures?
Ans:
Datadog excels in monitoring distributed architectures by providing visibility across complex, interconnected systems. It tracks requests and correlates logs to offer insights into latency, errors, and overall performance. Additionally, Datadog’s distributed tracing and service maps help pinpoint issues and optimize interactions between services, ensuring that monitoring across distributed systems is both comprehensive and actionable.
69. What is the process for creating custom metrics in Datadog?
Ans:
- Creating custom metrics in Datadog is straightforward,
- Leveraging APIs or DogStatsD for data transfer.
- Define your metrics, send them with ease,
- Visualize and alert as you please.
- With Datadog, custom metrics empower your expertise.
70. How does Datadog handle monitoring of legacy systems?
Ans:
- Datadog bridges the gap, monitoring legacy systems,
- Agents deployed to gather metrics from aged mechanisms.
- Whether it’s mainframes or older servers in the stack,
- Datadog provides insights, preventing a monitoring lack.
- With legacy support, Datadog ensures no system drawbacks.
71. What capabilities does Datadog offer for monitoring serverless computing platforms like AWS Lambda?
Ans:
Datadog can monitor AWS Lambda, collecting metrics and logs, and insights into invocations, durations, and errors in your code’s cogs. Integration with AWS CloudWatch for Lambda metrics and more, Monitoring performance in real-time, uncovering what’s in store. Alarms configured to alert on thresholds breached, Datadog ensures Lambda functions are always reached.
72. What methods does Datadog use to monitor ephemeral resources?
Ans:
Datadog adapts to transient nature, tracking instances as they shift; agents dynamically discover, ensuring no monitoring drift. Metrics and logs are gathered regardless of transient state, Ensuring insights are captured, and monitoring remains great. Auto-scaling capabilities to handle fluctuating loads, Datadog ensures no resource monitoring abodes.
73. What is the role of synthetic monitoring in Datadog?
Ans:
- Synthetic monitoring in Datadog mimics user interactions with precision,
- Testing applications and APIs, ensuring functionality’s decision.
- From various locations, synthetic tests simulate real-world scenarios,
- Detecting performance issues before they become horridarios.
- Proactively identifying weaknesses, enhancing user experience,
- Synthetic monitoring in Datadog is a vigilant assurance.
74. What capabilities does Datadog offer for monitoring container orchestration platforms like Kubernetes and Docker Swarm?
Ans:
Indeed, Datadog can monitor Kubernetes and Docker Swarm with flair, Capturing container metrics and orchestrator insights it does share. Autodiscovery of services, dashboards tailored to container needs, Monitoring container health, detecting anomalies and weeds.Insights into pod performance, resource utilization trends,
Datadog ensures containerized environments are well-defends.
75. How does Datadog assist in monitoring serverless API gateways?
Ans:
- Datadog integrates with serverless API gateways, collecting vital data,
- Monitoring requests, response times, and errors without a fade.
- Insights into API performance, traffic patterns well-defined,
- Alarms are set to trigger when anomalies unwind.
- Ensuring APIs are responsive, delivering as designed,
- Datadog’s monitoring keeps them refined.
76. What are some recommended practices for optimizing Datadog performance?
Ans:
- Limiting custom metrics and avoiding overloading are initial keys,
- Smart sampling and batching to reduce monitoring fees.
- Careful selection of monitored resources, prioritizing critical few,
- Ensuring integrations are streamlined, reducing overhead, too.
- Regular review of dashboards and alerts for efficiency,
- Optimizing Datadog’s performance, a practice with proficiency.
77. What features does Datadog provide for monitoring serverless streaming platforms like Apache Kafka?
Ans:
Yes, Datadog can monitor serverless streaming platforms without dismay, Capturing Kafka metrics and understanding the flow each day. Insights into throughput, latency, partition health, and more, Ensuring Kafka operates smoothly, as it did before. Alarms set to detect anomalies, ensuring issues are addressed, Datadog ensures Kafka’s performance is always impressed.
78. What approach does Datadog take to monitor serverless storage solutions?
Ans:
Datadog integrates with serverless storage, capturing metrics at play and monitoring storage usage and performance without delay. Insights into read and write operations, latency trends, and Ensuring storage solutions meet performance ends. Alarms configured to alert on storage limits or issues found, Datadog ensures serverless storage remains sound.
79. What role does log aggregation play in Datadog’s monitoring stack?
Ans:
- Log aggregation in Datadog collects logs from various sources far and wide,
- Centralizing them for analysis, with clarity as our guide.
- Searching, filtering, and analyzing logs with ease,
- Correlating with metrics, identifying issues to cease.
- A crucial component in understanding system health,
- Log aggregation in Datadog ensures insights wealth.
80. How does Datadog assist in monitoring serverless messaging systems like Amazon SQS?
Ans:
- Datadog integrates seamlessly with Amazon SQS, monitoring its flow,
- Capturing metrics, tracking queue depth, and performance on the go.
- Insights into message throughput, processing times, and more,
- Alarms are set to trigger when thresholds we deplore.
- Ensuring message queues operate as intended,
- Datadog’s monitoring keeps them comprehended.
81. What capabilities does Datadog offer for monitoring serverless computing platforms such as Google Cloud Functions?
Ans:
Indeed, Datadog provides integrations tailored for Google Cloud Functions. These integrations furnish insights into performance metrics and traces. Monitoring encompasses resource utilization and function execution. Alerts can be established for anomalies or deviations in performance thresholds. The integration enables comprehensive observability of serverless functions. Datadog’s platform guarantees visibility into the operations of Google Cloud Functions.
82.How does Datadog handle monitoring of serverless event-driven architectures?
Ans:
- Datadog seamlessly integrates with event-driven architectures.
- It captures metrics from diverse event sources and functions.
- Traceability across functions aids in understanding event flows.
- Alerting mechanisms notify users about issues related to event processing.
- Monitoring covers performance metrics, latency, and error rates.
- Datadog ensures holistic visibility into event-driven systems.
83. What role does infrastructure-as-code play in Datadog’s monitoring approach?
Ans:
- Infrastructure-as-code facilitates the establishment of consistent monitoring setups.
- Datadog’s configuration can be synchronized with infrastructure definitions.
- This synchronization ensures monitoring setups align with deployment changes.
- Changes in infrastructure automatically prompt adjustments in monitoring.
- Such an approach streamlines monitoring across dynamic environments.
- Datadog promotes DevOps practices by incorporating infrastructure-as-code.
84. What capabilities does Datadog offer for monitoring serverless databases like Amazon Aurora Serverless?
Ans:
Certainly, Datadog provides support for monitoring Amazon Aurora Serverless. It gathers metrics pertaining to database performance and utilization. Monitoring encompasses latency, throughput, and error rates. Users can configure alerts for anomalies in database performance. Datadog furnishes insights into the operations of serverless databases. Users attain visibility into the performance of Aurora Serverless instances.
85. What methods does Datadog use to monitor serverless file storage solutions?
Ans:
Datadog seamlessly integrates with serverless file storage solutions. It captures metrics related to file operations and storage utilization. Monitoring includes metrics such as latency, throughput, and error rates. Alerts can be configured for issues pertaining to file storage performance. Datadog ensures comprehensive visibility into file storage systems. Users can effectively monitor the performance of serverless file storage solutions.
86. What are some advanced features available in Datadog for anomaly detection?
Ans:
- Datadog provides machine learning-based anomaly detection capabilities.
- It autonomously learns normal behavior patterns.
- Anomalies trigger alerts for proactive issue resolution.
- Adaptive alerting mechanisms adjust to evolving system behavior.
- Forecasting capabilities predict future performance trends.
- Datadog’s advanced anomaly detection enhances system reliability.
87. What features does Datadog provide for monitoring serverless application deployment pipelines?
Ans:
Absolutely, Datadog offers monitoring for serverless deployment pipelines. It captures metrics concerning deployment performance and success rates. Monitoring encompasses deployment duration, frequency, and errors. Users can configure alerts for pipeline failures or delays. Datadog ensures visibility into serverless deployment processes. Users gain insights to optimize and troubleshoot deployment pipelines.
88. What methods does Datadog use to assist in monitoring serverless authentication and authorization services?
Ans:
- Datadog seamlessly integrates with serverless authentication and authorization services.
- It captures metrics concerning authentication and authorization latency.
- Monitoring includes error rates and request volumes.
- Alerts can be configured for failures in authentication or authorization.
- Datadog ensures visibility into the performance of these services.
- Users can effectively monitor and optimize serverless authentication and authorization processes.
89. What are some recommended strategies for managing alert fatigue in Datadog?
Ans:
- Employ intelligent alerting with anomaly detection to mitigate alert fatigue.
- Group related alerts to minimize noise and redundancy.
- Set alerting thresholds based on business priorities.
- Utilize escalation policies to prevent teams from being overwhelmed by alerts.
- Regularly review and refine alerting configurations.
- Datadog offers features like alerting deduplication to effectively manage alert fatigue.
90. What approach does Datadog take to monitor serverless content delivery networks (CDNs)?
Ans:
Datadog integrates seamlessly with serverless CDNs for comprehensive monitoring. It captures metrics pertaining to CDN performance and traffic, including, including latency, cache hit rates, and bandwidth usage. Alerts can be configured for anomalies in CDN performance. Datadog ensures visibility into the performance of serverless CDNs.Users can efficiently optimize CDN configurations and troubleshoot issues.