
Last updated on 10th Jul 2020| 3610
What is meant by Tableau?
Tableau is a robust and well-liked application for business intelligence and data visualisation software created by Tableau Software, which is now a part of Salesforce.
Users are able to connect with various data sources, visualise data, and produce engaging dashboards, reports, and charts. Using Tableau, users of different levels of skill can more easily and effectively analyse data and make decisions.
Tableau’s main attributes and abilities include:
- Connectivity to data
- visuals that are interactive
- Ad-Hoc Evaluation
The primary abilities required to operate Tableau Software efficiently and extract useful insights from data are a combination of data analysis, technical competency in Tableau Desktop, and an awareness of data visualisation principles.
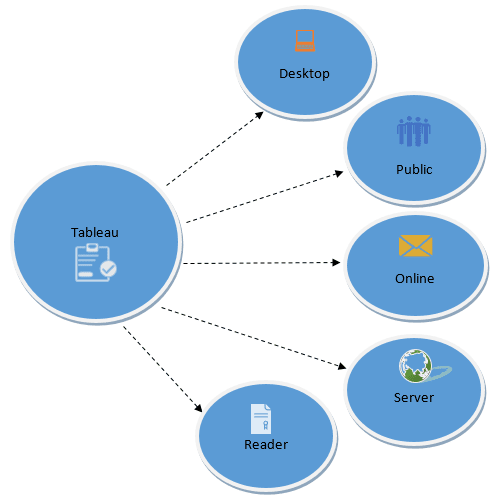
Tableau Software
Tableau software contains
- Tableau Prep
- Tableau Extensions
- Tableau Mobile
- Tableau Bridge
- Tableau Data Server
- Tableau Prep:
With the help of Tableau Prep, users may clean, shape, and transform unstructured data into a format that is appropriate for analysis and visualization. It is intended to simplify data wrangling activities and streamline the data preparation process.
Users may spend more time in Tableau on data analysis and visualization and less time on data cleansing.
Data profiling features in Tableau Prep enable users to comprehend the composition and properties of their data.
- Tableau Prep Builder
Users may interactively work with their data using Tableau Prep Builder’s user-friendly and graphical interface. Users can also do data cleansing, pivot and split data, and design data flows to automate data preparation procedures.
Tableau Extensions
Users of Tableau Desktop and Tableau Server can add their own unique capabilities or visualizations using Tableau Extensions. Through the use of extensions, users may expand Tableau’s functionality and incorporate specialized features into their dashboards and reports, improving the experience of data analysis and visualization as a whole.
Users can immediately integrate external services, APIs, or third-party apps into Tableau dashboards by using Tableau Extensions. Users can make use of other data sources, analytics, or interactive components thanks to this integration.
Tableau Mobile
Users of smartphones and tablets can view and interact with Tableau dashboards and reports via Tableau Mobile, a mobile application provided by Tableau Software. With Tableau Mobile, users can access their data wherever they are and make decisions based on that data.
Directly from their mobile devices, users can engage with visualizations, apply filters, and dive down into data to acquire deeper insights. By interacting with Tableau Server or Tableau Online, where data access permissions are managed by administrators, Tableau Mobile ensures safe data access.
Users of Tableau Mobile can download dashboards and reports for offline access so they can view and study data even when there is no internet connection.
Tableau Bridge
A part of Tableau Server called Tableau Bridge enables safe data communication between Tableau Server and on-premises data sources.
It is intended to fill the gap between data sources that are not immediately available from the cloud owing to security constraints or network setups and cloud-based Tableau Online or Tableau Server.
In order to protect data while it is being transferred between Tableau Server and on-premises data sources, Tableau Bridge employs encryption and secure communication protocols.
Tableau Data Server
Tableau Server is an on-premises or cloud-based platform for sharing and collaborating on Tableau dashboards and reports within an organization. Tableau Data Server was a part of Tableau Server.
Tableau Data Server made it easier for users of Tableau to collaborate by letting them exchange and reuse data sources, cutting down on duplication, and fostering data consistency.

Enroll in Tableau Certification Course to Build Your Skills & Career
Weekday / Weekend BatchesSee Batch DetailsUtilise Tableau to produce interactive dashboards and reports.
- Connect Tableau first to your data sources, which could be databases, spreadsheets, or cloud services. You may immediately import data into Tableau for analysis, and Tableau supports a number of different data sources.
- Create visualizations with your data using Tableau’s drag-and-drop interface. Drag the one you want data fields onto the canvas after identifying them. Depending on the data type, Tableau will automatically generate the appropriate maps, graphs, and charts.
- Set up your visualizations in an interactive style on the dashboard canvas. To make the visualizations more aesthetically pleasing and understandable, resize and format them. To give context and enable people to engage with the dashboard, add text, images, and filters.
- Filters, settings, and actions should be added to the dashboard to increase its interaction. Users can manipulate data through filters, while parameters allow calculations and visualizations to modify dynamically. Based on user inputs, actions enable interactive elements such as drill-downs or highlighting.
Architecture & Server Components for Tableau:
- Tableau Desktop: With Tableau Desktop, users can drag and drop data fields into a canvas to produce interactive visualizations, reports, and dashboards. It supports a range of data sources and provides an easy-to-use interface for data exploration and analysis.
- Tableau Server: A centralized platform called Tableau Server makes it easier for employees to collaborate and share Tableau material with one another. Users may engage with live data and work together in real -time because of the web-based access, it offers to Tableau dashboards.
- Tableau Online: Hosted by Tableau, Tableau Online is a cloud-based version of Tableau Server. It enables businesses to distribute and publish Tableau workbooks and dashboards without requiring an on-site server infrastructure. Users may use any internet-connected device to access Tableau Online.
- Data Sources: Databases (SQL, NoSQL), spreadsheets, cloud services (like Salesforce, Google Analytics), and online data connectors are just a few of the many data sources that Tableau can connect to. Users may analyze data from many platforms inside Tableau because of its versatility.
- Data Engine: The in-reminiscence information processing technology utilized by Tableau’s Data Engine permits brief information searching and evaluation. As a result, performance is stepped forward and real-time interactions with visualizations are made possible. Data is stored in a relatively optimized way.
- VizQL: Tableau’s proprietary language, VizQL (Visual Query Language), converts consumer interactions into database queries. Users’ selected information is used to construct visualizations on the fly, allowing for actual-time comments and interactive capabilities.
- Data Server: Metadata, extracts, and other resources utilized by Tableau Server or Tableau Online are managed and stored by the Data Server component of Tableau. It facilitates effective user cooperation and data exchange.
- Extracts: Data extracts, which are optimized subsets of the data stored in Tableau’s in-memory database, can be made by users. Extracts improve functionality and let users work effectively with big datasets.
- Gateway: The Gateway controls communication between various Tableau components, such as Tableau Desktop and Tableau Server, and external requests, guaranteeing safe and effective data flow.
- Repository: The Repository is a centralized database where configuration data, permissions, and details about Tableau workbooks, data sources, and users are kept. In controlling Tableau Server resources, it is crucial.
- Authentication & Authorization: To provide safe access to Tableau resources, Tableau offers a number of authentication techniques, such as local authentication, SAML, and Active Directory. Authorization controls specify the dashboards and data each user has access to.
- Backgrounder: The Backgrounder is a component in charge of carrying out background duties including managing subscriptions for automatic content distribution and updating data extracts.
- Tableau Bridge: Data freshness for cloud-hosted dashboards is ensured via Tableau Bridge, a component that provides secure data connections between Tableau Online and on-premises data sources.
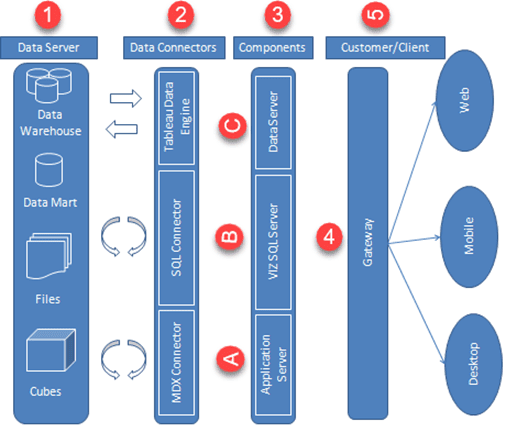
Tableau Architecture Diagram
Work Flow
As Tableau helps in analyzing lots of data over diverse time periods, dimensions, and measures, it needs a very meticulous planning to create a good dashboard or story. Hence, it is important to know the approach to design a good dashboard. Like any other field of human endeavor, there are many best practices to be followed to create good worksheets and dashboards.

Get Experts Curated Tableau Certification Training From Real-Time Experts
- Instructor-led Sessions
- Real-life Case Studies
- Assignments
Though the final outcome expected from a Tableau project is ideally a dashboard with story, there are many intermediate steps which needs to be completed to reach this goal. Following is a flow diagram of design steps that should be ideally followed to create effective dashboards.
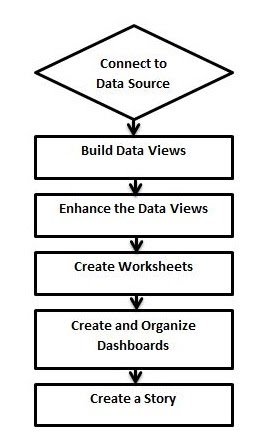
Connect to Data Source
Tableau connects to all popular data sources. It has inbuilt connectors which take care of establishing the connection, once the connection parameters are supplied. Be it simple text files, relational sources, SQL sources or cloud data bases, Tableau connects to nearly every data source.
Build Data Views
After connecting to a data source, you get all the column and data available in the Tableau environment. You classify them as dimensions and measures, and create any hierarchy required. Using these you build views, which are traditionally known as Reports. Tableau provides easy drag and drop feature to build views.
Enhance the Views
The views created above needs to be enhanced further by the use of filters, aggregations, labeling of axes, formatting of colors and borders, etc.
Create Worksheets
Create different worksheets to create different views on the same or different data.
Create and Organize Dashboards
Dashboards contain multiple worksheets which are linked. Hence, the action in any of the worksheet can change the result in the dashboard accordingly.
Create a Story
A story is a sheet that contains a sequence of worksheets or dashboards that work together to convey information. You can create stories to show how facts are connected, provide context, demonstrate how decisions relate to outcomes, or simply make a compelling case.
Benefits
1. Quickly create interactive plots
Volume, variety, and velocity, right? Today the 3V’s not only define Big Data, but also accurately summarize the projects being thrown at data scientists.
There are lots of them; every business problem is unique and they are coming at you at incredible speeds. I’ve had situations where 2-3 stakeholders came to me with multiple project requests on a daily basis!
So how do you deal with this onslaught of work and produce a great deliverable every time? One way is to get very good at ggplot2, shiny, htmlwidgets, dygraphs, googleVis & co. and hope that your pre-built templates fit the next project that comes your way so you can save some precious development time.
Another way is to use Tableau’s drag-n-drop interface to build many (beautiful) visuals in minutes. The interface can handle endless variations and helps tackle just about any project thrown your way with ease.
When I first start a project what I really want is to SEE my data. Ever since I started using Tableau, the first thing I do on a new project is throw all my data into this magic box. Drag-drop and I can see the trends, drag-drop and there are the anomalies, drag-drop and hmmm, that’s interesting, let me drill into that further… You get the point.
2. Build interactive dashboards using a GUI
With Tableau you can build interactive dashboards to empower your clients. It’s so easy that this has become my default option.
Now when somebody comes to me after project delivery and asks, “Can you do a very quick adjustment for me? Pretty pleeeeeease.” I point them to their dashboard and say “You wanted this? Here you go. It’s interactive, so make as many changes as you like!” (like building a Shiny app using a GUI interface)
The best part is that dashboards can be deployed at enterprise level (Tableau Server) and can be viewed and interrogated on a laptop, tablet, and even mobile. Managing executives of your company are going to be your new best friends! It’s self-Service Analytics at its finest.

3. Connects to R
You can perform basic calculations and even run some simple stats in Tableau itself. But if that’s not enough and heavy artillery analytics is required, simply run your models in R, import results into Tableau and visualize away! Need to leverage R computations in real-time? Not a problem! Tableau has in-built support for R via Rserve.
These programs complement each other well and this allows you to harness the power of each for a great end result.
4. Growth
For the third time, Tableau has been named a leader in the Magic Quadrant for Business Intelligence and Analytics Platforms report by Gartner:
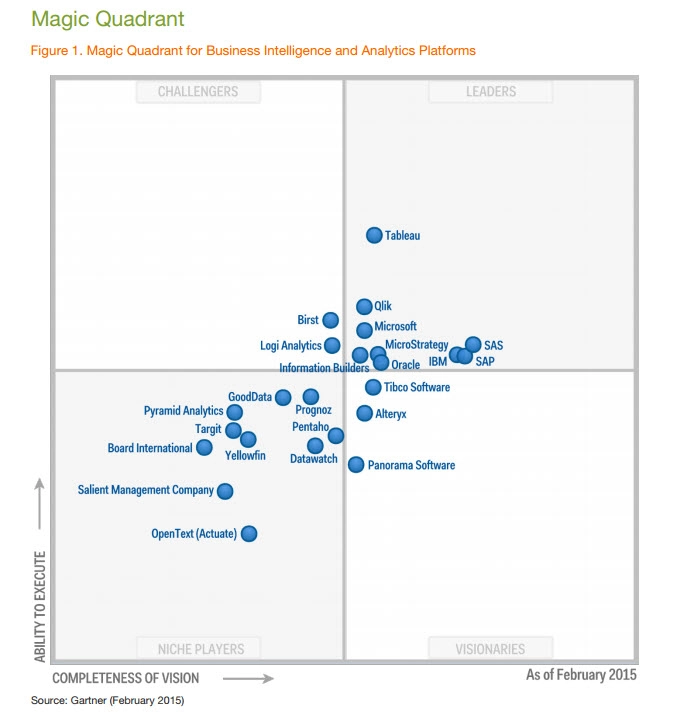
This doesn’t come as a surprise. With incredible year-on-year growth and record adoption rates globally, Tableau is setting itself up for long-term success. It’s completely expected that the company delivers one of the best analytics and visualization platforms out there.
And when you join the Tableau community, you will set yourself up for long-term success too. Akin to R followers, Tableau fans are extremely passionate about the tool. They are there to help each other and their numbers are growing rapidly.
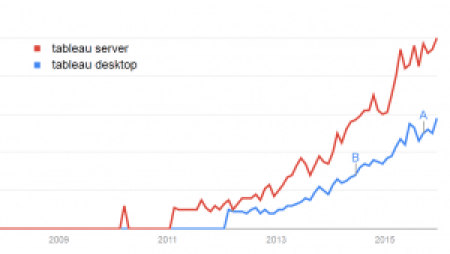
In fact, Tableau is becoming so popular that many organizations require Tableau on your resume to even apply for their data science positions. I won’t be surprised if in 5 years this will be the norm. Just check out the growth for Tableau search terms on Google Trends:
5. Short learning curve
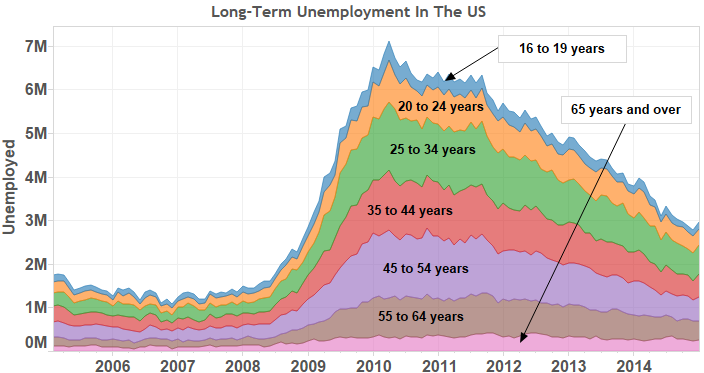
Tableau is extremely easy to learn. It’s such an intuitive tool that you can pick it up on the fly. With the right type of training, in less than 7 hours you will be seamlessly creating fully interactive MIS dashboards like this:
6. Pricing
The Professional Version of Tableau is priced with enterprises in mind: $1,999 + maintenance fee per license. But here’s the good news: Tableau has a completely free version of their software called Tableau Public.
With Tableau Public you cannot connect to as many Data Sources as with Tableau Professional and all visualizations have to be saved on a public server. Apart from that, Tableau Public is capable of producing the same incredible visualizations and dashboards as Tableau Professional, making it a great solution for learning the software.
Advantages of Tableau
- Data visualization: Tableau is the data visualization tool. It provides the facilities for complex computations, data blending. It plays a vital role in real-time decision-making.
- Quickly create interactive visualization: Tableau has a drag and drop facility. The user can create complex and interactive visuals within a minute.
- Ease of implementation: Tableau provides multiple ways to create visuals. It becomes very easy to the end user, to choose a comfortable way of creating visuals.
- Tableau can handle massive data: Tableau can manage large data efficiently — different visualizations created for large data, without affecting the performance of dashboards.
- Use of other scripting languages in tableau: For better performance and complex table calculations, tableau allows the usage of other languages like R, python in the tableau.
- Mobile support and responsive dashboard: Tableau dashboard has striking reporting feature. That feature allows the user to customize the dashboard to individual devices such as mobile or laptop. Tableau dashboard identifies automatically, which device used by the user to view the reports.
Disadvantages of Tableau
- Scheduling Reports: Tableau does not provide the facility of an automatic refresh. Automatic refresh can be achieved with the help of scheduling. Tableau does not have an option of scheduling. Need a manual work after every modification or updation.
- No custom visual imports: Tableau does not allow importing the custom visuals, and user needs to create it instead.
- Custom formatting in Tableau: Tableau has the limited formatting option. It displays only 16 column of data only at a time. If user want to create visuals of more than 16 column or user want to create the same formatting for multiple columns, then the user needs to do it manually.
- Screen Resolution on tableau dashboards: If the tableau’s developers screen resolution is different from the screen resolution of clients, then the layout of the dashboard get distorted. Moreover, the dashboard will be no longer responsive. In that case, either the screen resolution of developer and end user should be same or developer has to create a dashboard to view it on mobile.
- Limited data pre processing: a Tableau is a visualization tool, it provides only basic facilities such as blending data, joining data but it does not provide cleaning data facility. Data cleaning is a necessary step.
Conclusion
As we conclude our brief study on data visualization, it is clear that the field is rich in potential applications in diverse disciplines, at the same time we need to be aware of its practical and ethical complexities. In the previous chapters, we have presented some important theoretical and practical principles to keep in mind when designing a data visualization. We have also discussed and critiqued several examples of data visualizations, learning common pitfalls and helpful tricks along the way. As we have seen, developing an effective and ethical data visualization is a complex process. In this chapter we will touch upon the future of data visualization and additional resources for data visualizers.