
Last updated on 10th Jul 2020| 3622
- Power BI is a Data Visualization and Business Intelligence tool that converts data from different data sources to interactive dashboards and BI reports. Power BI suite provides multiple software, connector, and services – Power BI desktop, Power BI service based on Saas, and mobile Power BI apps available for different platforms. These set of services are used by business users to consume data and build BI reports. This tutorial covers all the important concepts in Power BI and provides a foundational understanding on how to use Power BI.
- Power BI is a Data Visualization and Business Intelligence tool that converts data from different data sources to interactive dashboards and BI reports. Power BI suite provides multiple software, connector, and services – Power BI desktop, Power BI service based on Saas, and mobile Power BI apps available for different platforms. These set of services are used by business users to consume data and build BI reports.
- Power BI desktop app is used to create reports, while Power BI Services (Software as a Service – SaaS) is used to publish the reports, and Power BI mobile app is used to view the reports and dashboards.
Power BI Desktop
We can install the Power BI desktop on our local computer to create our reports. By using this Power BI desktop, we can connect to different data sources such as text files, databases, excel files, etc. Next, we use this data to build Power BI reports by dragging the required charts. Finally, we can share those reports across the organization.
Download and Install Power BI Desktop
In this section, we show you how to Download and Install Power BI Desktop with screenshots. Installing the Power BI Desktop includes the following steps. So, please follow the steps as we mentioned below.
Steps to Download and Install Power BI Desktop
The following are the steps involved in download and install Power BI Desktop.
Download Power BI Desktop
- Power BI Desktop is a Free windows based application. You can use this Desktop to Shape the data in a proper format, and to design reports as per the requirements.
- In order to download Power BI Desktop, first Go to the official tableau website by clicking this link Download Link.
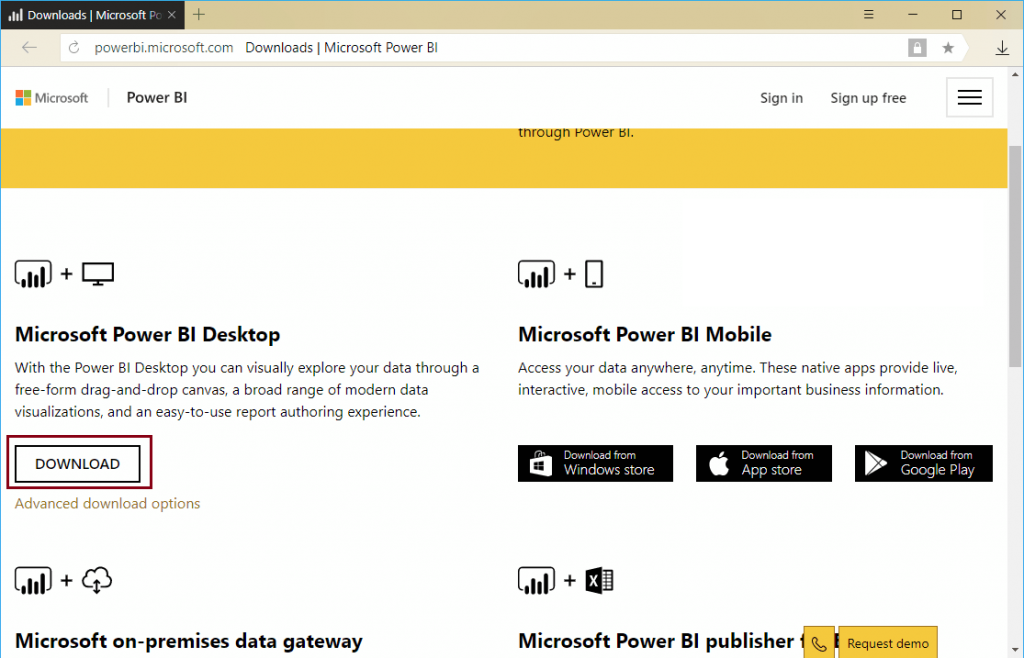
- The below screenshot shows you the Downloads page. Either you can click the Download button, or you can click the hyperlink of Advanced Download Options.
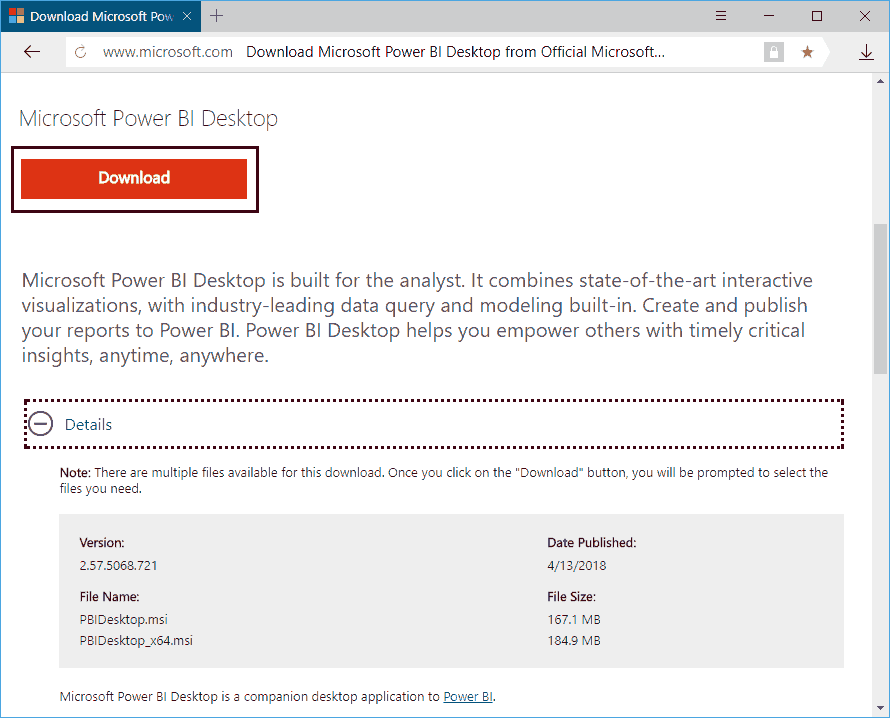
- Clicking the Advanced Download Options takes you to the Microsoft website. Here, you can read the Installation steps, software, and hardware requirements.
- Click the Download button to download the Microsoft Power BI desktop from this location.
Install Power BI Desktop
- To install the Power BI desktop, Please navigate your file system to the Power BI Software that we downloaded previously. Next, click on the application.
- Once you click on the application, the below-shown window will open. It is a Security warning, and it may appear if you have any security measures; otherwise, skip to the next step.
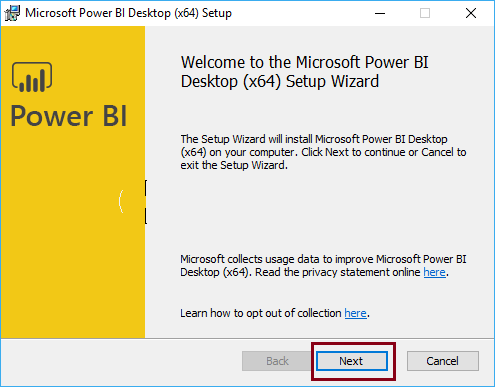
The first page of the Power BI install is a Welcome page. Please click the Next button
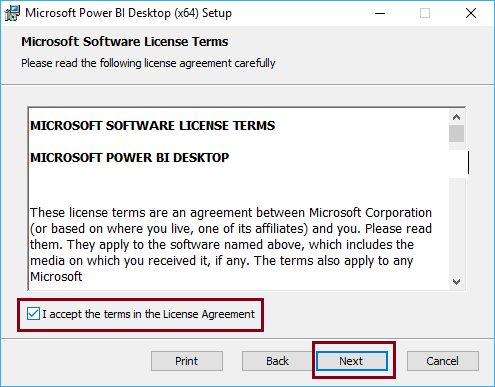
Please, checkmark the I accept the terms of the Licence Agreement option and click the Next button.
Select the location where you want to install this application. Here, either you can leave the default C location or use the Change button to alter the installation directory.
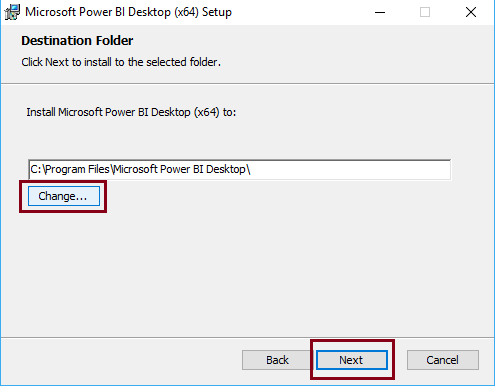
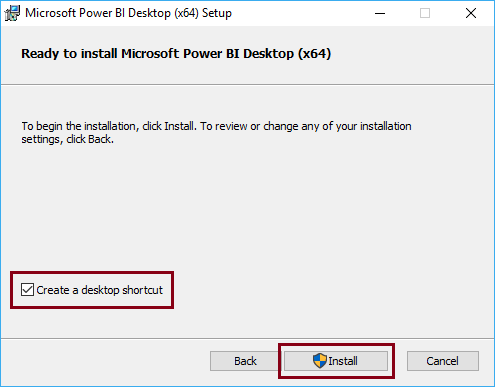
Next, Click the Install button
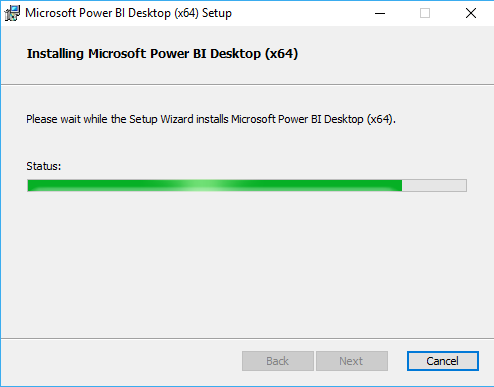
Wait until the installation is completed.
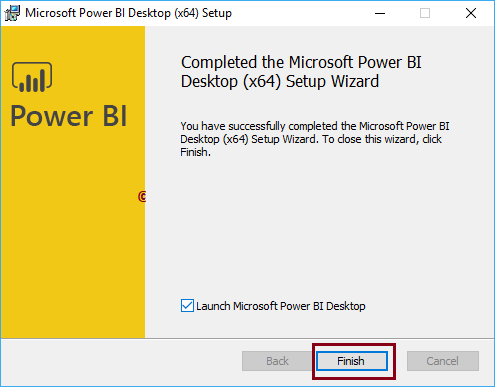
Click the Finish button to complete the installation process
Wait till the Power BI Desktop initializes the desktop features.

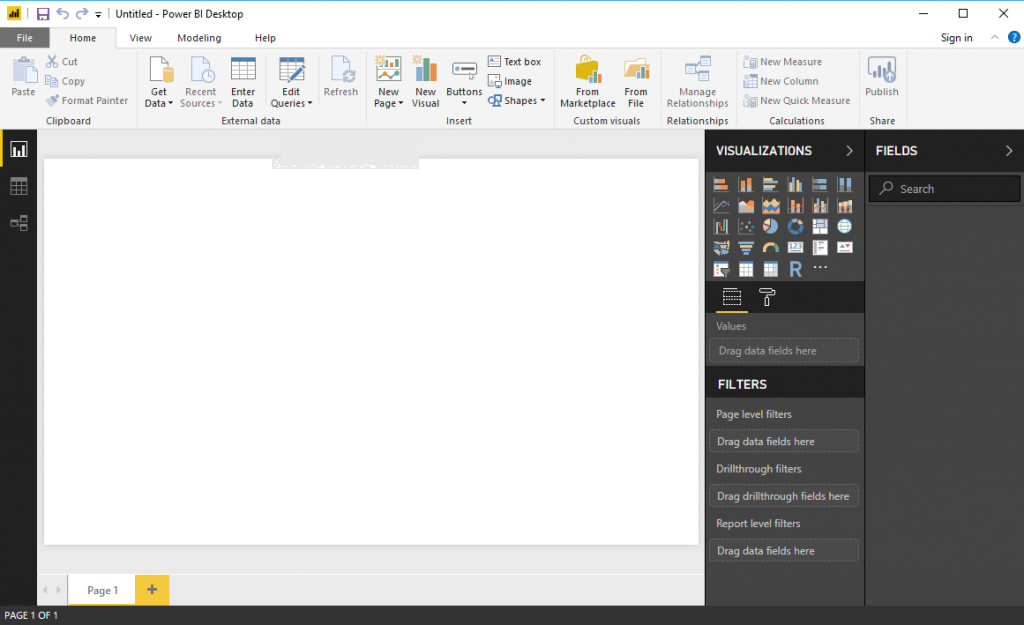
Now you can see the installed Power BI Desktop. Let me close the start page
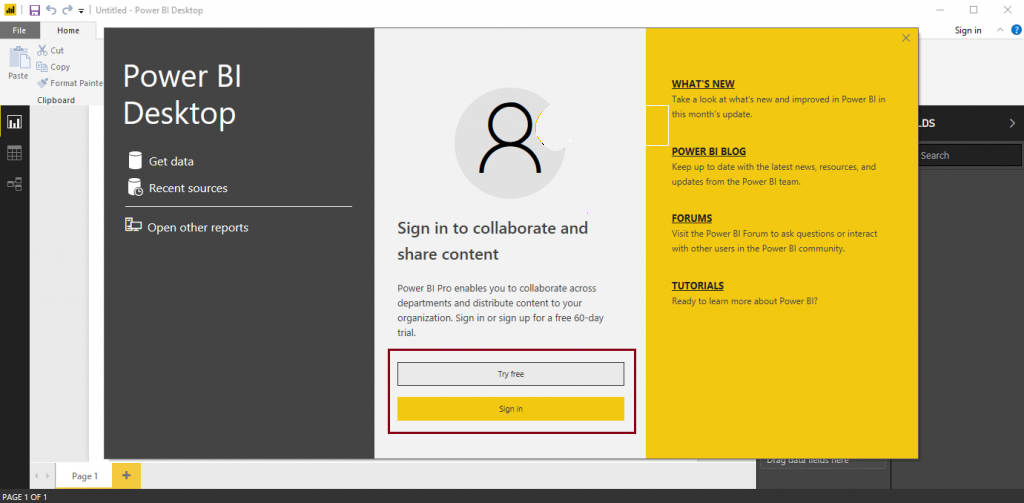
It is the Power BI Desktop, where we load data from different sources, design reports, and publish them.
Add Rename and Duplicate Pages in Power BI
In this article, we show how to add New Pages, Rename the Pages, Hide Pages, Duplicate Pages, and Delete Pages in Power BI with an example.

Get On-Demand Power BI Training to Advance Your Career
- Instructor-led Sessions
- Real-life Case Studies
- Assignments
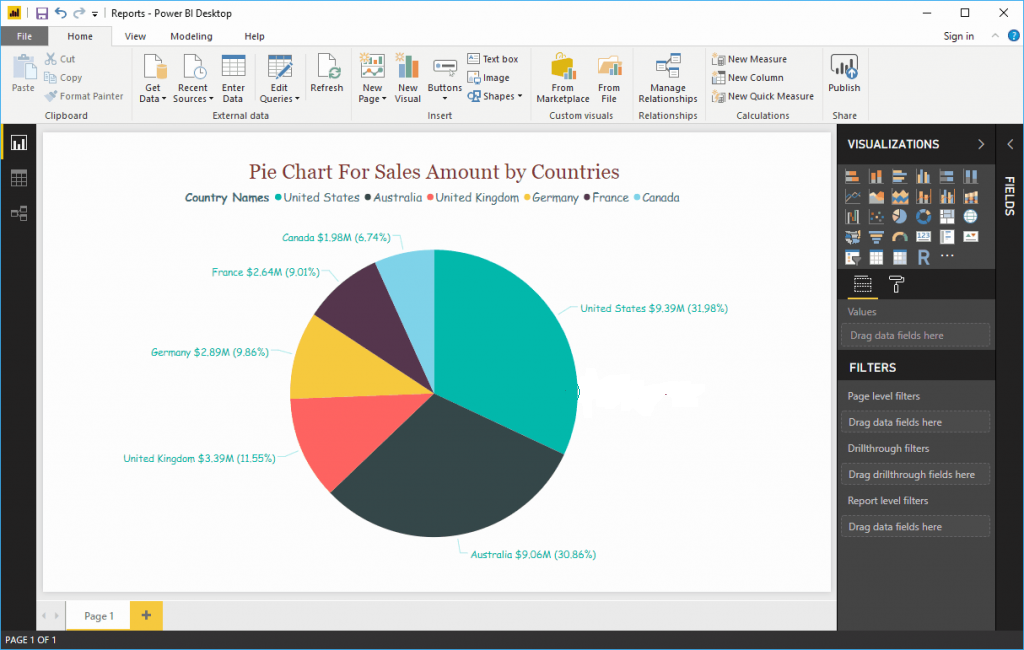
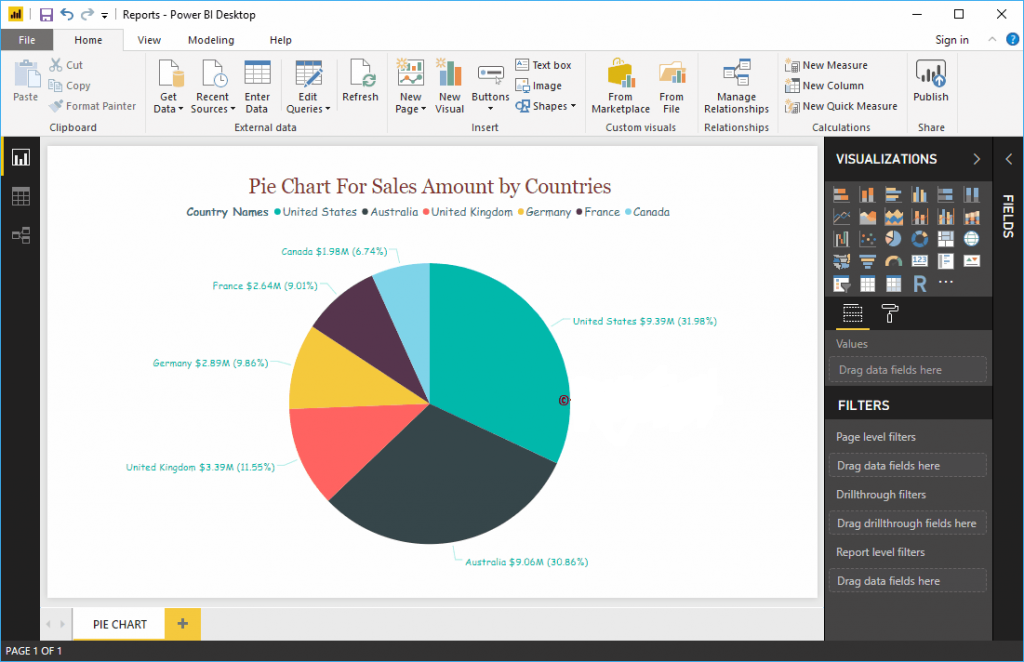
For the Add Rename and Duplicate Pages in Power BI demo purpose, we are going to use the Pie Chart that we created earlier. Please refer Pie Chart in Power BI article to understand the steps involved in creating Power BI Pie Chart.
Add Rename and Duplicate Pages in Power BI
The following are the ways to change page names, add new pages, duplicate existing pages, and delete pages in Power BI.
Rename a Page in Power BI

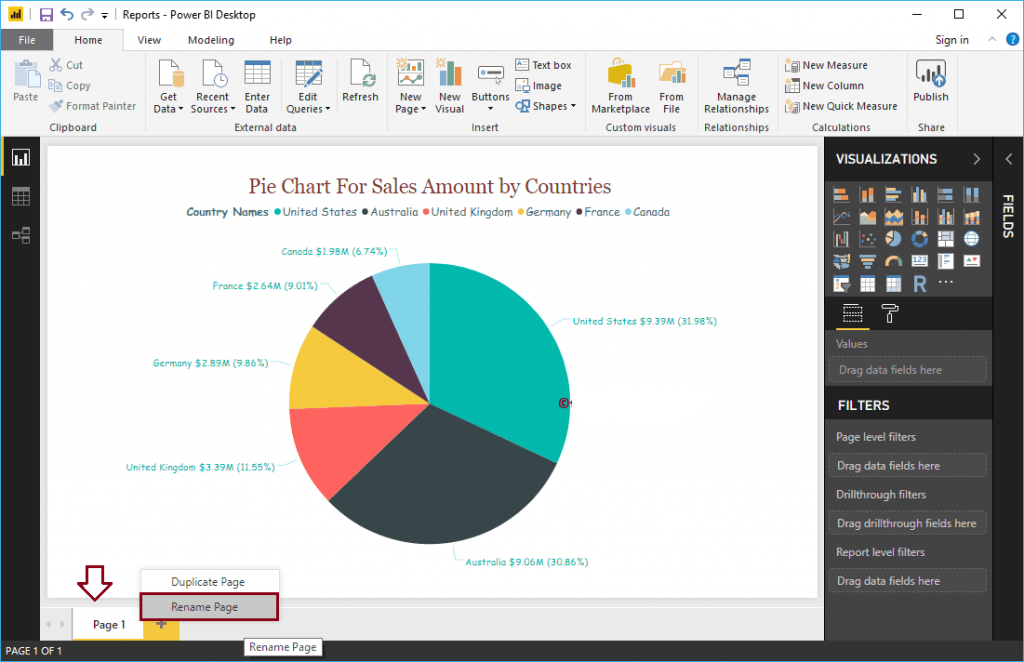
Right-click on the existing page name at the bottom open the context menu. Please select the rename option, as shown below. Or double-click on the Power BI page title allows you to rename it.
We are renaming the Page to Pie Chart
And you can see that the page name has changed
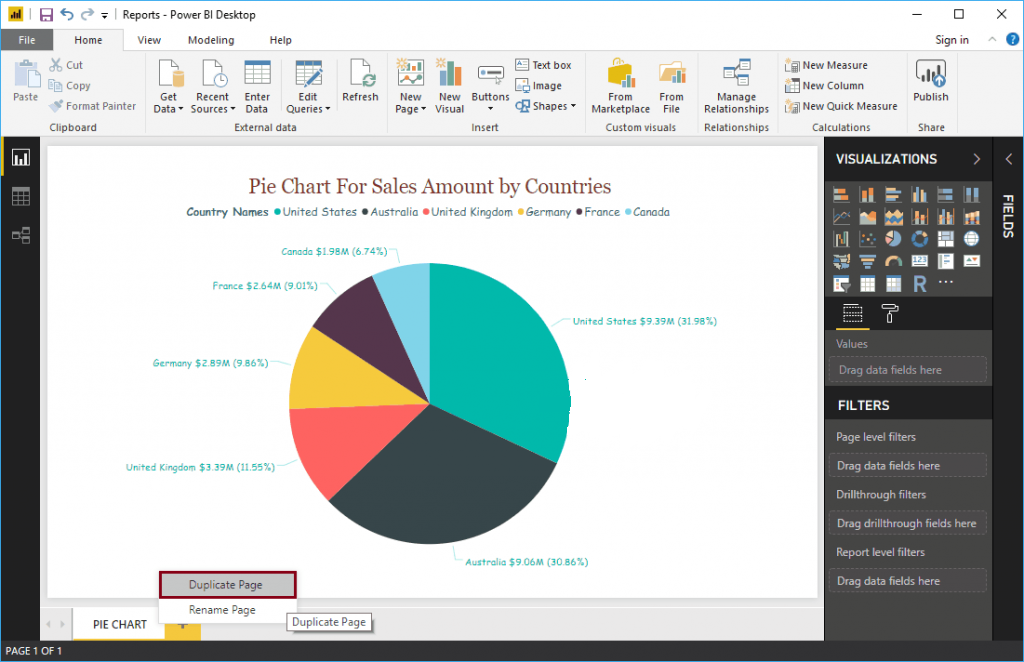
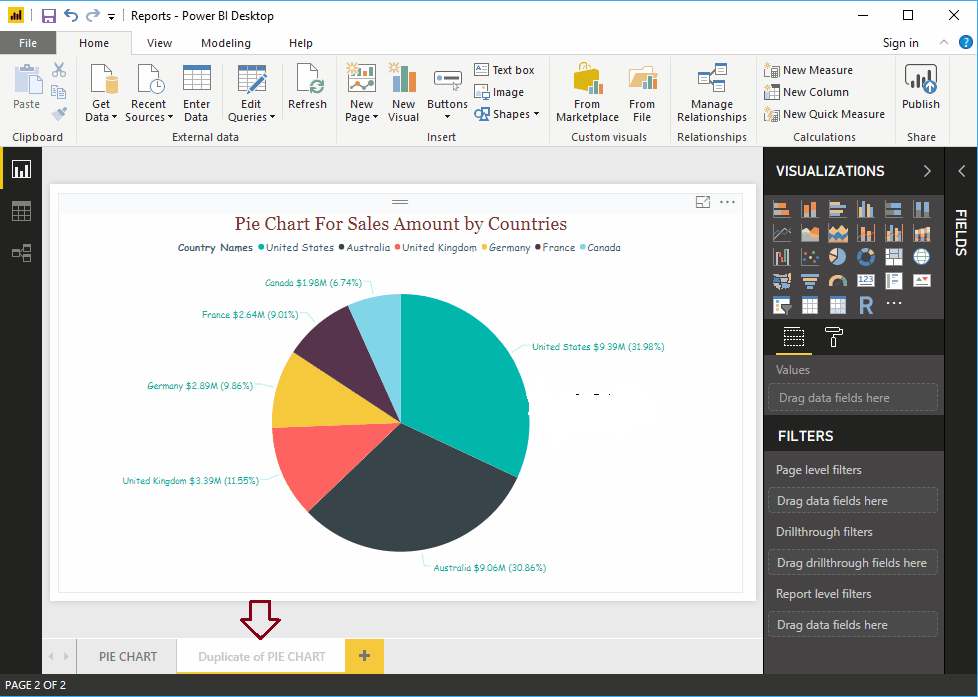
Duplicate a Page in Power BI
Right-click on the existing page that you want to duplicate open the context menu. Please select the Duplicate Page option, as shown below.

It duplicates the Page for you
Create a New page in Power BI
Please click on the Plus + button to create a new page in Power BI
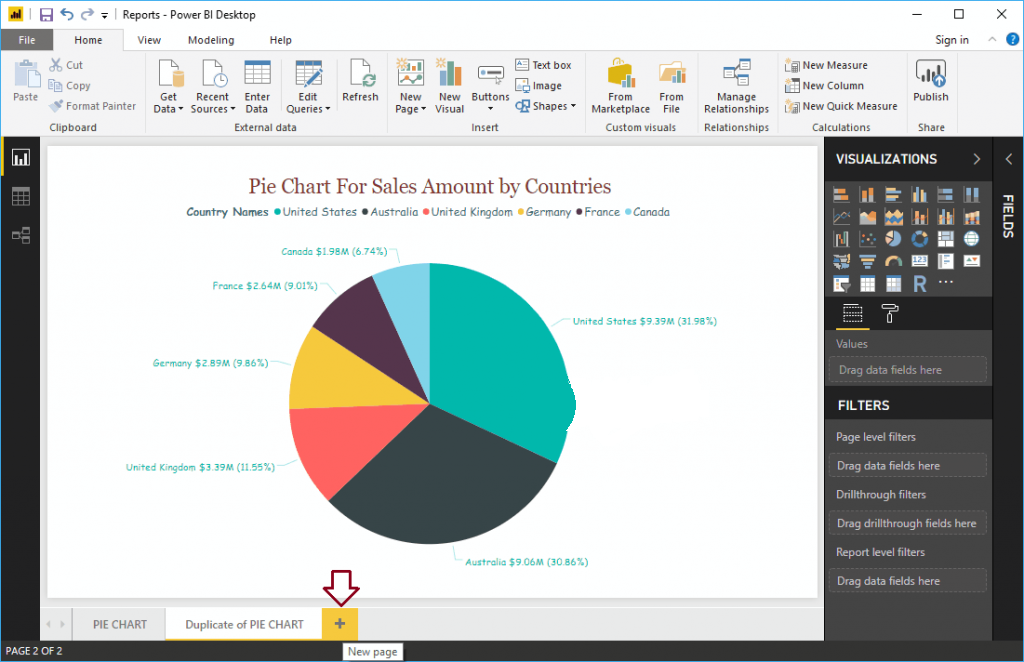
And you can see the New page.
Delete Pages in Power BI
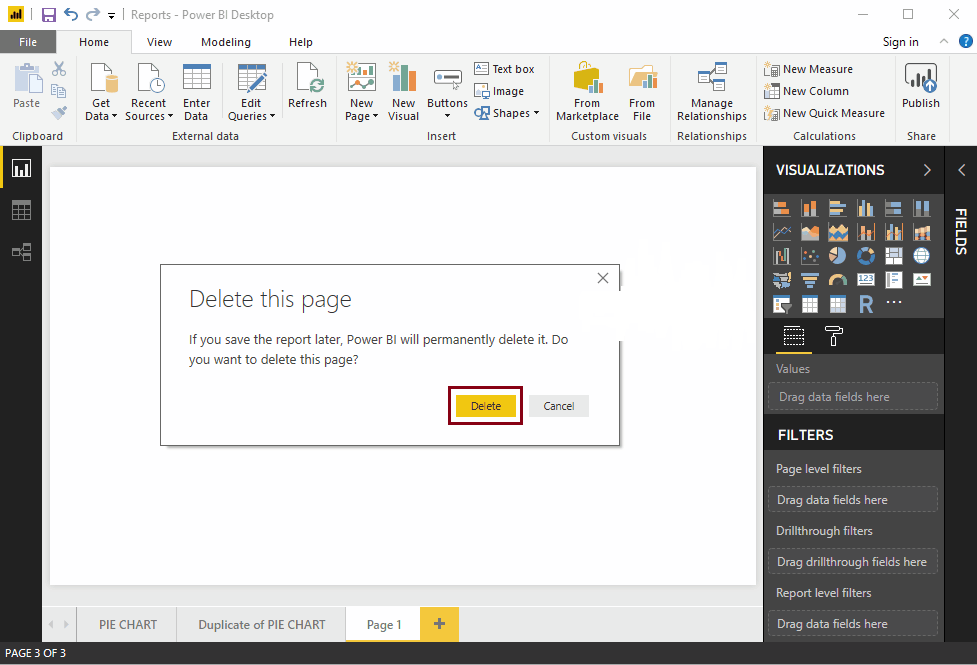
Please click on the X button on top of the existing page
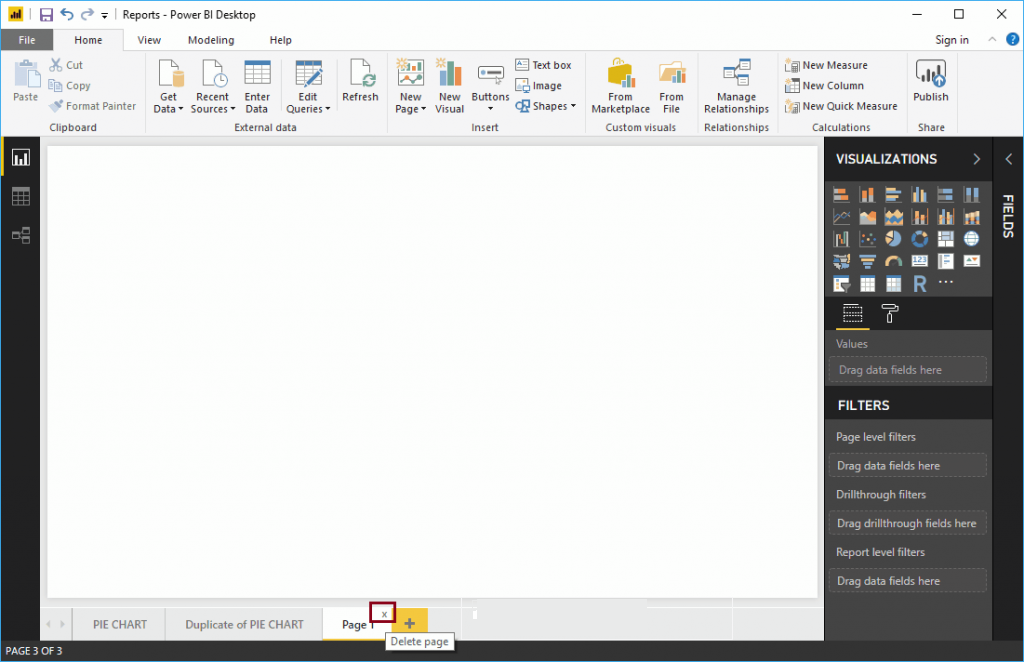
A pop-up message box displayed. Please click on the Delete button to delete the Page.
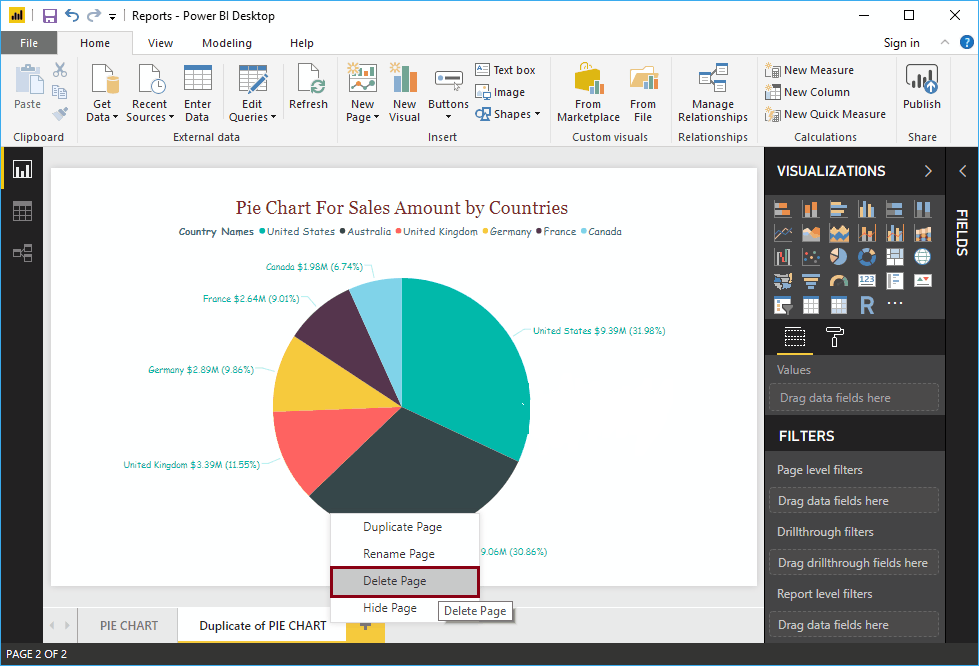
Or, right-click on the existing page that you want to delete open the context menu. Please select the Delete Page option.
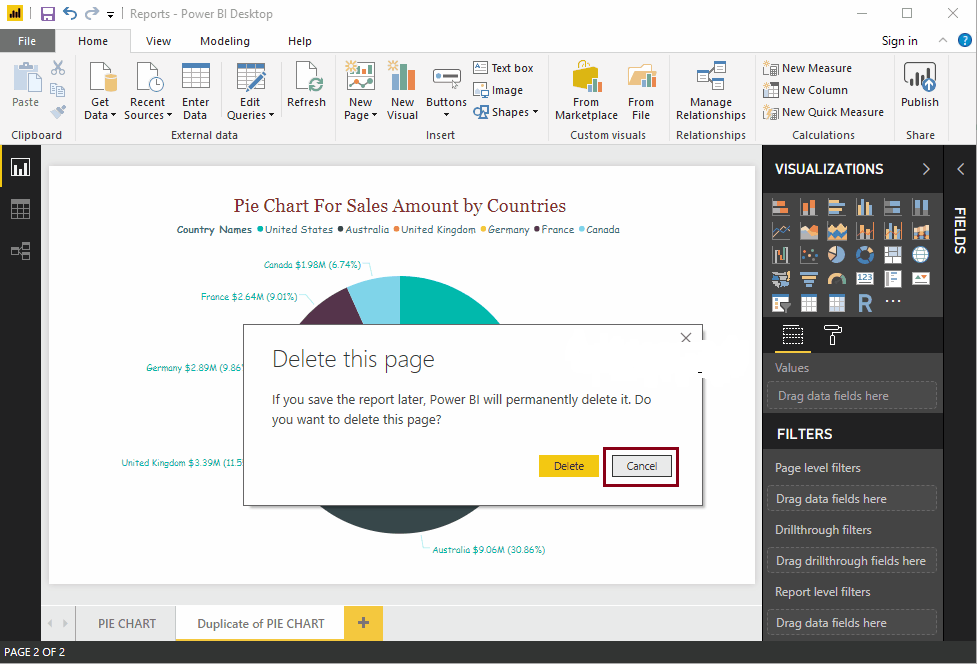
It opens the Message box. This time, I will click the Cancel button.
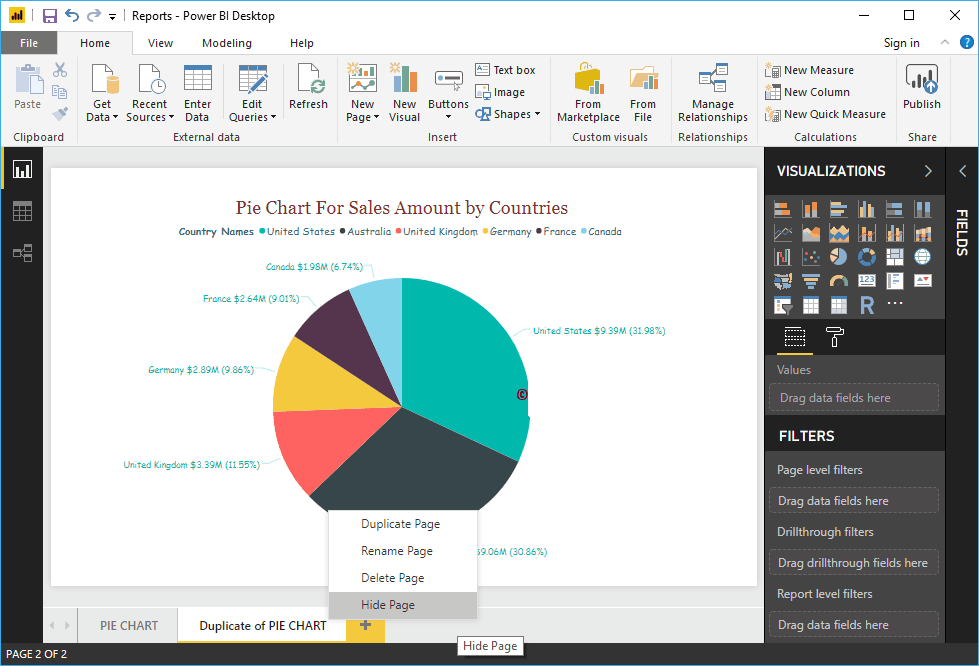
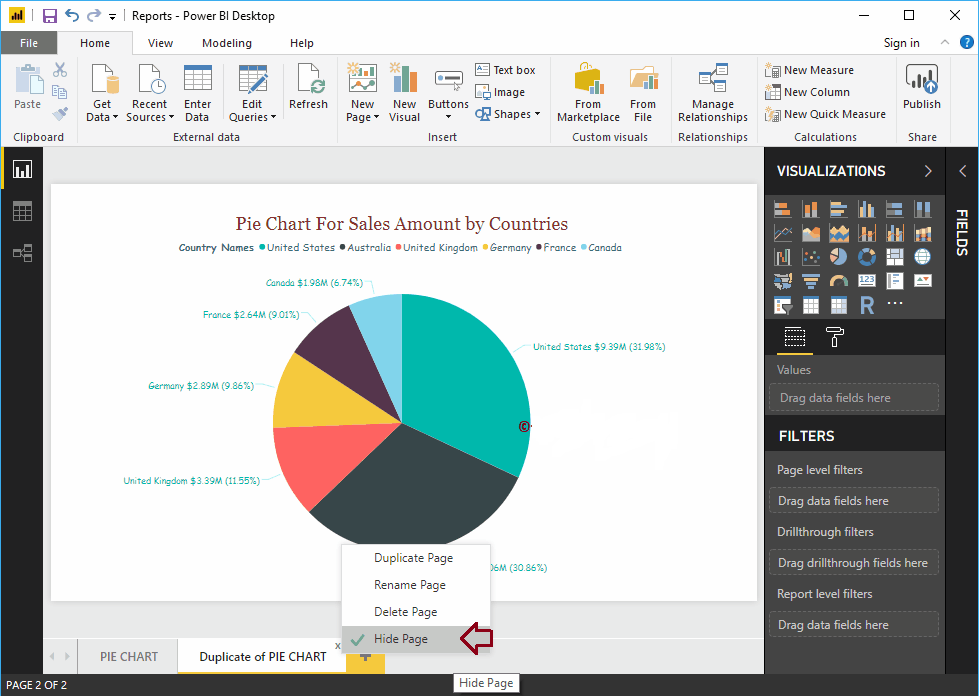
Hide Pages in Power BI Desktop
Right-click on the page that you want to hide and select the Hide Page option from the context menu.
And you can see the page is hidden
Unchecked the Hide Page option to remove the Hide option
Users of Power BI
Power BI users are categorized into four sections according to the purpose of the usage of Power BI. These four types of users are Analysts, Business users, IT professionals and Developers. Let’s learn some more about them.
1. Analysts
Analysts use Power BI to develop reports, dashboards, data models and study them to discover valuable insights in the data. Power BI offers a wide range of data sources from which an analyst can extract data, make a common dataset, cleanse and prepare that data to make reports and conduct analysis.
2. Business Users
The business users are the common users who study the reports and dashboards available to share with them on the Power BI website or mobile app. Business users remain updated with the latest information which helps in taking important decisions in time. They can also set an alert notification for any change or abnormality in data (if occurs).
3. IT professionals
The IT professionals are mainly concerned with the scalability, availability, and security of data. They also centrally manage all the Power BI services and users.
4. Developers
Developers are responsible for all the technical work. Their key roles are to create custom visuals to be used in Power BI, embedding Power BI into other applications, creating reports, etc.
Pros & Cons
The pros & cons are mentioned below.
- Unlike other BI tools, we use its full access without paying.
- We can use the Power BI Web tool as well if needed.
- The process of creating charts in Power BI is the same as that of MS Excel.
- Power BI cannot be used in iOS laptops and desktops.
Conclusion
This brings our introductory tutorial on Microsoft Power BI to an end. We hope it helped you lay a solid foundation about the technology. In the tutorials to come, we will expand on more interesting topics and tools of Power BI.
- BI helps you to analyze data and to provide actionable information which helps corporate executives, business managers to make informed business decisions.
- Power BI is a Business Intelligence and Data Visualization tool which helps you to convert data from a various data source
- Some important Power BI tools are 1)Power BI Desktop 2) Power BI service 3) Power BI Data Gateway 4) Power BI Report Server 5) Power BI Mobile Apps
- Excel (.xlsx, xlxm), Comma Separated Value (.csv), Power BI Desktop (.pbi), Databases in the Cloud, Databases on-premises are important data sources used in Power BI.
- Visualization, Datasets, Dashboard, Reports, Tile are important terms used in a Power BI.
- Power BI was conceptualized by Ruler and Dhers Netz of the SQL server coverage services team at Microsoft.
- Data Integration 2) Data Processing 3) Data Presentation are important components of Power BI architecture.
- Power Query, Power Pivot, Power View, Power Map, Power BI Service, Power BI Q&A, Data Management Gateway, Data Catalog are important elements of Power BI Dashboard.
- DAX is a formula expression language which is called (DAX) which can be used with various visualization tools like Power BI.
- Power BI offers Complete Dashboards for analysis, while Tableau only allows Ad Hoc Analysis.
- Important professional who uses Power BI is PMO – Project and Portfolio Manager, Business & Data Analyst, IT Team, IT Professional, etc.
- The biggest drawback for Power Bi will not accept the file larger than 250MB and zip file which is compressed by the data of X-velocity in-memory database.