Last updated on 10th Jul 2020| 4140
In this tutorial, we will go through some basic concepts and terminologies used while writing MDX Queries on your OLAP Cube, We will also look into Why-What and How of MDX Query.
- While we Google, we can find some good articles on this topic, but I did not find a tutorial with all the stuff which I am looking for in one when I was searching as a beginner in this direction. So I have taken this small step to write an article and share with you all, so you can Learn Custom MDX with ease and enjoy it.
Multi Dimensional Expression (MDX)
- MDX Query Language is used to retrieve information stored in OLAP Cube created in various technologies like Microsoft SQL Server Analysis Services(SSAS), Oracle, Tera data, etc. Key difference between MDX and T-SQL is that MDX Query builds a Multidimensional View of the data, where T-SQL builds a Relational View. SQL Query designed to handle only two dimensions while processing tabular data. While MDX Can process more dimensions in Query.
- MDX is also used to write expressions for custom calculation in Power Pivot and for creation of Calculated members in OLAP Cube.
What do you mean by dimensions in Query? In general, we can say entities with related member details using which you have planned to study & analyze Data in OLAP Cube.
Introduction to Basic Concepts Used within MDX Query
We need to have a clear idea in our mind about the various concepts and terminologies used while working with MDX Query. Initially, I found it very confusing to understand all these when I was new, but I don’t want you to be stuck on this all, so let us begin.
Cube
OLAP Cube is the basic unit of storage for Multidimensional data, on which we can do analysis on stored data and study the various patterns. You can take further ideas on OLAP cube creation using this article Create First OLAP Cube in SSAS.
Dimensions
The primary functions of dimensions are to provide Filtering, Grouping and Labeling on your data. Dimension tables contain textual descriptions about the subjects of the business. Dimensions in general we can say are the Master entities with related member attributes using which we can study data stored in OLAP Cube Quickly and effectively.
Measure & Measure Groups
- Metrics stored in your Fact Tables are called Measures. Measures are used to analyze performance of the Business. Measure usually contains numeric data, which can be aggregated against usage of associated dimensions. Measure Group holds a collection of related Measures.
- To learn about Data Warehouse quickly refer to the article Create First Data Warehouse.
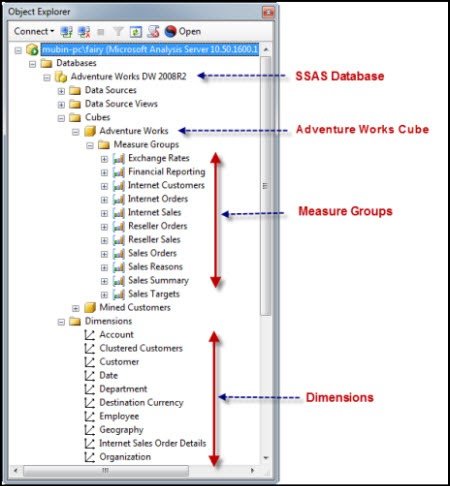
- Take a look at the image given below which represents terminologies discussed above.
OLAP Database is a container of Cubes. It is important to identify Cube Name before we start writing our query. Then after we need to select Measure from the appropriate Measure Group and use related dimensions.
Introduction to Level, Member, Hierarchy
Let us take a look at brief descriptions of frequent terms used in MDX query
1).Level
Generally Attributes under Dimension are considered as levels, they are also called as Attribute Hierarchy.
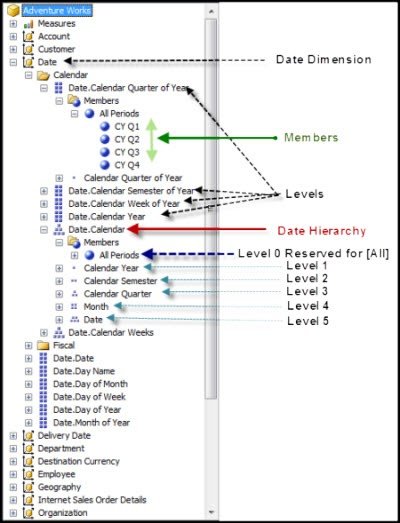
Let’s take an example of Date Dimension in this we have various levels like Quarter of the Year, Semester of the Year, Week of the Year, Calendar Year, etc.
2).Members
Key component of the MDX query is membership. Each Level contains one or more members.
e.g. Calendar Quarter of Year contains various members like CY Q1, CY Q2, CY Q3, CY Q4 .
3).User Defined Hierarchy
We usually create this type of hierarchy while designing OLAP Cube as per their relations. You can refer to the Date Hierarchy shown in the figure shown below.
This hierarchy also contains various levels, by default Level 0 is reserved for [ALL] .
Background
Please refer to my previous articles if you are more interested to know about Data Warehouse and OLAP Cube Creation using Microsoft Business Intelligence.
Here we are going to work with Microsoft SQL Server 2008 R2 (Standard, Enterprise edition) .
Using the Code:
Let us make Our Test Environment Ready
1. Here you need to download Adventure Works Data Warehouse from CodePlex Site.
2. Also download Analysis Services Solution created using this AdventureWorksDW2008 R2 from CodePlex Site.
3.Check in Services.msc that your SQL Server Analysis services were up and running.
4. Configure Connection string in above SSAS Solution and Deploy your Cube.
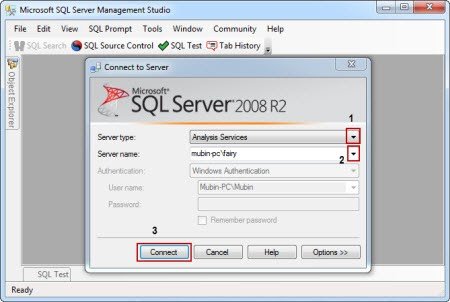
5. Now Open Microsoft SQL Server Management Studio (SSMS) and connect Analysis Services using Windows Authentication.
Select Server type: Analysis Services–>Specify your SQL Server name: e.g. mubin-pc\fairy or localhost –>Click: Connect
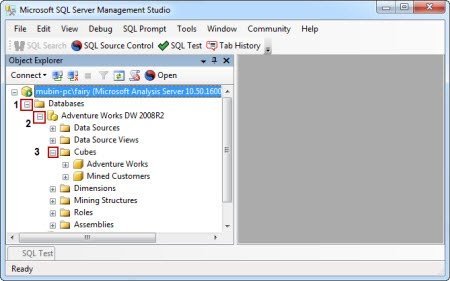
6. After Successfully Connecting to your SQL Server Analysis Server, you can view your OLAP Cube Deployed, just do the drill down by clicking on + button.
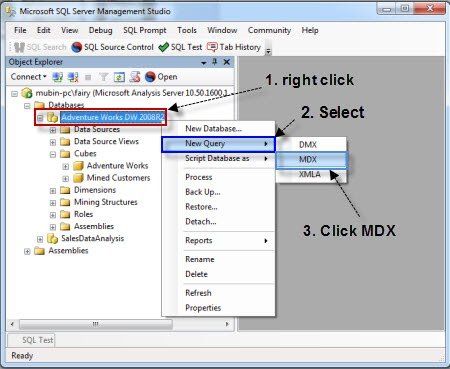
7. Open New MDX Query Editor Window
Right Click on Database Name (Adventure Works DW 2008 R2)–> Select New Query –> Click MDX
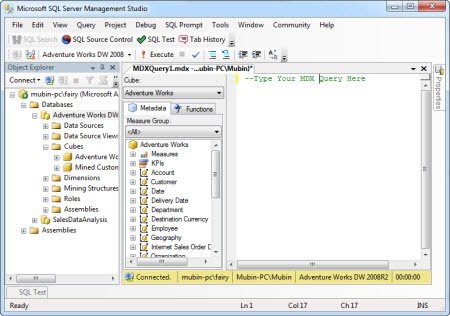
8. Now we are ready to start playing with MDX Query in our Query Editor Window.
Introduction to Axis in MDX Query

Get Hands-on SSAS Training from Industry Experts
- Instructor-led Sessions
- Real-life Case Studies
- Assignments
MDX queries can have 0, 1, 2 or up to 129 query axes in the SELECT statement. Each axis behaves in exactly the same way, unlike SQL where there are significant differences between how the rows and the columns of a query behave.
Refer to the following table for Axis Numbers reserved and Alias given to them:
| Axis Number | Alias |
|---|---|
| 0 | Columns |
| 1 | Rows |
| 2 | Pages |
| 3 | Section |
| 4 | Chapter |
Using SQL Server Management Studio (SSMS), we can only browse values on two axes, Columns (Axis 0) and Rows (Axis 1).
This tutorial describes MDX and its main concepts. It is meant to be a gentle introduction and is targeted to any person who wants to get a quick grasp of MDX capabilities.
Overview:
MDX stands for ‘Multi-Dimensional Expressions’ and is the standard language defined by Microsoft to query multi-dimensional servers.
- At first glance, it may appear similar to SQL. However, MDX is a completely new language. SQL was designed to query dimensional data structures, called tables, where data is organized in rows and columns. In MDX, data is organized around multiple measures, dimensions, hierarchies, and levels.
- MDX is a language used to perform calculations and analysis around multi-dimensional structures. MDX includes a rich set of functions for ‘performing’ statistical analysis. Unlike SQL, MDX does not have DDL (Data Definition) or DML (Data Manipulation) capabilities. MDX is purely for analyzing and reading data.
- Similar to the way tables and columns are central to SQL, dimensions, hierarchies, and levels, are the centerpieces of MDX. They are mapping business models into language-specific concepts (e.g. a list of countries will be mapped as an MDX dimension).
- The most natural way to explain these concepts is with an example.
Let’s introduce a classic sales related business problem. We would like to generate some charts on our sales department and the information we have is as follows:
- Pierre Dupont sold one corporate license 2009 Q1 in Geneva
- Pierre Dupont sold one corporate license 2009 Q3 in Geneva
- Pierre Dupont sold one corporate license 2010 Q1 in Paris
- Rosa Maza sold one corporate license 2009 Q2 in Madrid
- Rudolf von Richthofen sold one partnership license 2009 Q1 in Zurich
- Rudolf von Richthofen sold one partnership license 2009 Q3 in Zurich
- John Bin sold one corporate license 2009 Q2 in New York
- Patty Bing sold one corporate license 2009 Q4 in Los Angeles
With this example we have introduced the concepts of ‘Sales People’, ‘License’, ‘Time’, ‘City’, and ‘amount of licenses’. In a relational database we could model this with one table per concept and foreign keys in a ‘amount_of_licenses’ table.
- In MDX ‘Sales People’, ‘License’, ‘Time’, and ‘City’, will be modeled as dimensions and the ‘amount of licenses’ as a measure. Measures in MDX are a special case of dimensions and they hold numeric values.
- The concrete value of a dimension (e.g. Paris) is a member of the dimension and is similar to the value of an SQL table.
- A multi-dimensional cube, then, is a collection of dimensions indexing a list of measures.
- You should not try to visualize the multi-dimensional cube as a geometrical cube. A geometrical cube can have only three dimensions, whereas an MDX cube can have many dimensions. In our example above, we have four dimensions (‘Sales People’, ‘License’, ‘City’, and ‘Time’) and one numeric measurable quantity (‘License Quantity Sold’). Of course, real-life business problems can have many more dimensions and measures.
To start, let’s look at an MDX statement that gives us a table with the amount of licenses sold per country per year:
- SELECT
- ([Geography].[Geo].[Country].members) ON 0,
- ([Time].[Year].members ) ON 1
- FROM
- [Sales]
| Spain | Switzerland | France | United States | Canada | Mexico | |
|---|---|---|---|---|---|---|
| 2010 | 3.0 | 248.0 | 4 | 768.0 | ||
| 2011 |
As we would like to compute some statistics on this data, we will enrich the information with additional details.
We would like to organize the countries as a geographical tree (Continent, Country, City) and economic partnerships (EU, NAFTA, None).
For the Time dimension, we’re interested in years and quarters.
Comparing an MDX Query to an SQL Query
- The MDX and SQL languages have a similar structure, and include some of the same keywords. However, one of the significant conceptual differences between the two languages is that MDX builds a multidimensional view of the data, where SQL builds a relational view. Although it is possible to use SQL exclusively to query cubes, the MDX query was designed specifically to retrieve multidimensional data structures with almost any number of dimensions. Additionally, SQL was designed to handle only two-dimensional tabular data when processing queries, where MDX can process one, two, three, or more dimensions in queries. Each dimension in MDX is referred to as an axis, and the terms column and row are simply used as aliases for the first two axis dimensions in an MDX query (the alias itself holds no real meaning to MDX).
- Additional to the conceptual differences between MDX and SQL, both languages use different terms to describe their basic concepts. For example, the cube concept explained above is actually a table in the SQL language; and the multidimensional term level is a column in SQL (referring to a string or discrete number). Additionally, a dimension in MDX refers to what would be understood in relational terms as several related columns or a dimension table; and a measure in MDX refers to a discrete, continuous or numeric column in SQL. Finally, a member in MDX refers to the specific row and column of a dimension table.
MDX Query Structure
A basic MDX query uses the SELECT statement to identify a data set that contains a subset of multidimensional data. The SELECT statement is composed of the following clauses:
- WITH clause (optional):Allows calculated members or named sets to be computed during the processing of the SELECT and WHERE clauses.
- SELECT clause:Defines the axes for the MDX query structure by identifying the dimension members to include on each axis. The number of axis dimensions of an MDX SELECT statement is also determined by the SELECT clause.
- FROM clause:Names the cube that is being queried, and determines which multidimensional data source will be used when extracting data to populate the result set of the MDX SELECT statement. The FROM clause (in an MDX query) can list only a single cube. Queries are restricted to a single data source or cube.
- WHERE clause (optional):Determines which dimension or member is used as a slicer dimension (the slicer usually refers to the axis formed by the WHERE clause). This restricts the extracting of data to a combination of dimension members. Any dimension that does not appear on an axis in the SELECT clause can be named on the slicer.
An MDX query, and specifically the SELECT statement, can have up to 128 axis dimensions. The first five axes have aliases. Furthermore, an axis can be referred to by its ordinal position within an MDX query or by its alias.
The SELECT clause can use MDX functions to construct different members in a set of axes. The WITH clause can use MDX functions to construct calculated members, which are used in an axis or slicer.
For the full article regarding MDX query structure, see the SAS documentation website.
About the Series…
- This is the first article of my new series, MDX Essentials. The primary focus of this series will be an introduction to the MDX language. The series is designed to provide hands-on application of the fundamentals of the Multidimensional Expressions (MDX) language, with each tutorial progressively adding features designed to meet specific real-world needs.
- As we progress through the series, we will build upon previous lessons and the concepts we have introduced therein. However, one of my objectives is to make each lesson as “standalone” as possible, meaning that we should not encounter cases where we cannot complete a given lesson without components or objects that we have created in previous lessons. This should make it easier for “casual” visitors to join us with any lesson, and still successfully complete that session, given an existing understanding of concepts and principles that we have accumulated up to that point.
- To get the most out of the MDX Essentials series, we need to have installed at least the Analysis Services component of MSSQL Server 2000. While the full installation of SQL Server 2000 allows for virtually any exercise we might undertake, the majority of our sessions center on Analysis Services, the PivotTable Service, and their constituent parts. Installation of Analysis Services from the Standard Edition of SQL Server 2000 will be adequate for the vast majority of our activities.
- For purposes of carrying out limited Microsoft Office — related activities, Microsoft Excel 2000 and, to a lesser extent, Microsoft FrontPage 2000 will come in handy. We will also make use of the Microsoft OLAP Provider, included in a typical Excel 2000 installation, which consists of the data source driver and the client software needed to access cubes created by Microsoft SQL Server 2000 Analysis Services.
- For purposes of the series, it is assumed that MSSQL Server 2000 and, specifically, the MSSQL Server 2000 Analysis Services components (I will often substitute the term “Analysis Services” going forward, to save time and space) are accessible to/installed on the PC, with the appropriate access rights to the sample cubes provided in a Typical installation of Analysis Services. It is also assumed that the computer(s) involved meet the system requirements, including hardware and operating systems, of the applications we have mentioned.