Last updated on 09th Jul 2020| 2921
What is the ELK Stack?
The ELK Stack is a collection of three open-source products — Elasticsearch, Logstash, and Kibana. They are all developed, managed ,and maintained by the company Elastic.
- E stands for ElasticSearch: used for storing logs
- L stands for LogStash: used for both shipping as well as the processing and storing logs
- K stands for Kibana: is a visualization tool (a web interface) which is hosted through Nginx or Apache
ELK Stack is designed to allow users to take to data from any source, in any format, and to search, analyze, and visualize that data in real-time.
ELK provides centralized logging that be useful when attempting to identify problems with servers or applications. It allows you to search all your logs in a single place. It also helps to find issues that occur in multiple servers by connecting their logs during a specific time frame.
ELK Stack Architecture
Here is the simple architecture of ELK stack
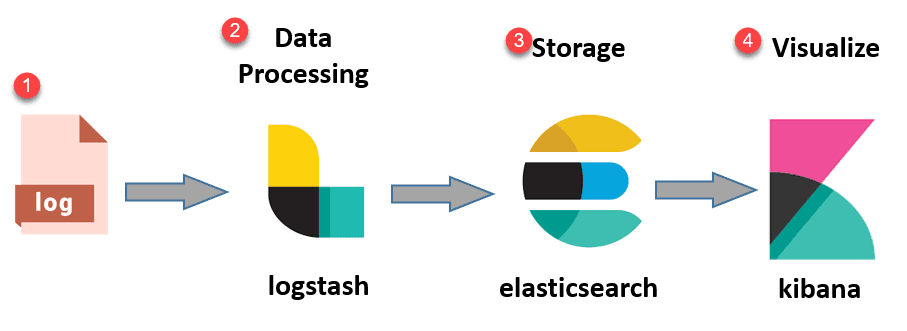
- Logs:
Server logs that need to be analyzed are identified
- Logstash:
Collect logs and events data. It even parses and transforms data
- ElasticSearch:
The transformed data from Logstash is Store, Search, and indexed.
- Kibana:
Kibana uses Elasticsearch DB to Explore, Visualize, and Share
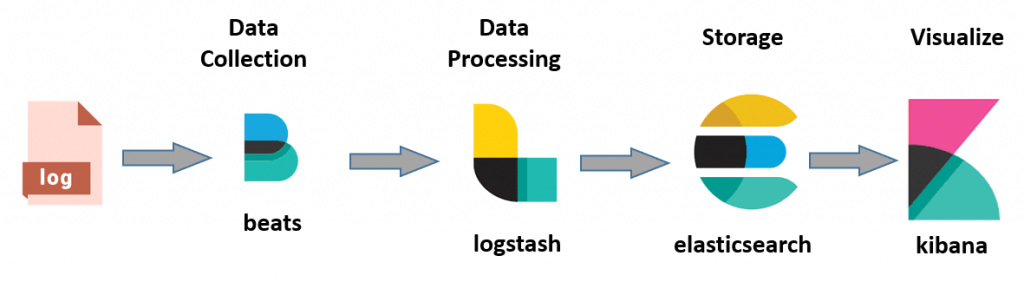
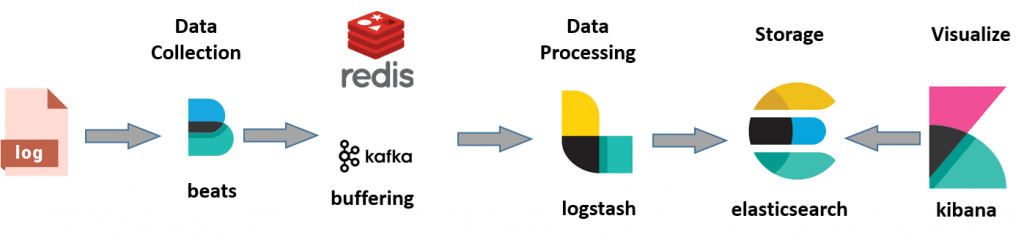
However, one more component is needed or Data collection called Beats. This led Elastic to rename ELK as the Elastic Stack.
While dealing with very large amounts of data, you may need Kafka, RabbitMQ for buffering and resilience. For security, nginx can be used.
Let’s deep drive all of these open source products:
What is Kibana?
- Kibana is a data visualization which completes the ELK stack. This tool is used for visualizing the Elasticsearch documents and helps developers to have a quick insight into it. Kibana dashboard offers various interactive diagrams, geospatial data, and graphs to visualize complex quires.
- It can be used for search, view, and interact with data stored in Elasticsearch directories. Kibana helps you to perform advanced data analysis and visualize your data in a variety of tables, charts, and maps.
- Kibana is an open source browser based visualization tool mainly used to analyze large volume of logs in the form of line graph, bar graph, pie charts, heat maps, region maps, coordinate maps, gauge, goals, timelion etc. The visualization makes it easy to predict or to see the changes in trends of errors or other significant events of the input source. is an open source browser based visualization tool mainly used to analyze large volume of logs in the form of line graph, bar graph, pie charts, heat maps, region maps, coordinate maps, gauge, goals, timelion etc. The visualization makes it easy to predict or to see the changes in trends of errors or other significant events of the input source.
Here are the most common search types:
Free text searches
It is used for searching a specific string
Field-level searches
It is used for searching for a string within a specific field
Logical statements
It is used to combine searches into a logical statement.
Proximity searches
It is used for searching terms within specific character proximity.
Features of Kibana:
- Powerful front-end dashboard which is capable of visualizing indexed information from the elastic cluster
- Enables real-time search of indexed information
- You can search, View, and interact with data stored in Elasticsearch
- Execute queries on data & visualize results in charts, tables, and maps
- Configurable dashboard to slice and dice logstash logs in elasticsearch
- Capable of providing historical data in the form of graphs, charts, etc.
- Real-time dashboards which is easily configurable
- Enables real-time search of indexed information
| How to Install Kibana as a Windows Service with AlwaysUp |
Automatically start Kibana whenever your computer reboots and keep it running 24×7 in the background. No logon necessary.
Kibana is an open source data visualization plugin for Elasticsearch. It is the “K” in the popular ELK stack.
Elasticsearch already runs as a Windows Service, and we have already documented how to setup Logstash to run 24×7. This tutorial focuses on Kibana — to ensure that your entire Elastic Stack easily survives reboots and other outages.

Learn On-Demand Kibana Training Course from Real Time Experts
Weekday / Weekend BatchesSee Batch DetailsTo setup Kibana as a Windows Service:
- If necessary, download, install and configure Kibana.
- Grab the Kibana zip file from the Elastic web site and expand its contents to a location of your choice. We have unzipped version 6.22 to C:\kibana-6.2.2-windows-x86_64 and we’ll use that folder throughout this tutorial.
- Configure Kibana as you desire (basic instructions are on the download page). Ensure that Kibana starts properly when you run the “kibana.bat” file from the “bin” folder. You should be able to access the console from your browser:
- AlwaysUp will not be able to run Kibana as a Windows Service if you can’t start Kibana from the batch file!
- Download and install AlwaysUp, if necessary.
- Start AlwaysUp.
- Select Application > Add to open the Add Application window:
- On the General tab:
- In the Application field, enter the full path to the batch file that starts Kibana, kibana.bat. You will find it the bin folder in your Kibana home directory.Since we unzipped Kibana to C:\kibana-6.2.2-windows-x86_64, our full path to the batch file is:C:\kibana-6.2.2-windows-x86_64\bin\kibana.bat
- In the Name field, enter the name that you will call this application in AlwaysUp. We have stuck with the default of Kibana but you can enter something else if you like.
- Click over to the Logon tab and:
- Check the box at the top and enter the username and password of the Windows account where you can start Kibana normally. Kibana uses Java, which requires a few environment variables to work properly. You must run Kibana/Java from an account where we know these environment variables are configured.
- Check the When a user logs on, don’t show the application’s windows and tray icons box at the bottom. This will hide Kibana’s console window (which you won’t be able to see anyway, because it will be running in the background) and prevent Microsoft’s Interactive Services Detection dialog from annoying you.
- Switch to the Startup tab and check the Ensure that the Windows Networking components have started box. This tells AlwaysUp that Kibana needs the TCP/IP stack to operate.
- And finally, switch to the Extras tab. Here you will redirect the text from Kibana’s console window to a file, so that you can review the details if there is a problem.Check the Capture output to this log file box and enter the full location to the output file. We have placed ours in the Kibana installation folder (to keep everything in one place!), but you can put yours anywhere you like.
- We are done configuring Kibana so click the Save >> button to record our settings. In a couple of seconds, a new entry for Kibana (or whatever you called it) will show up in the AlwaysUp window.Notice that the state will be “Stopped” because the service is not yet running:
- To start Kibana as a service, choose Application > Start “Kibana”. The entry’s state should change to “Running” after a few seconds and Kibana will be active in the background.Browse to the Kibana URL (usually http://localhost:5601/) and check the console output file to confirm that all is well:
- That’s it! Next time your computer boots, Kibana will start immediately, before anyone logs on. We encourage you to edit the service in AlwaysUp and check out the many other settings that may be appropriate for your environment. For example, send an email if the Kibana fails, boost priority, configure a weekly report, and much more.
Advantages and Disadvantages of Kibana
- Easy visualizing
- Fully integrated with Elasticsearch
- Visualization tool
- Offers real-time analysis, charting, summarization, and debugging capabilities
- Provides instinctive and user-friendly interface
- Allows sharing of snapshots of the logs searched through
- Permits saving the dashboard and managing multiple dashboards
Conclusion
ElasticSearch is an excellent program but is not easy to setup specially for complex situations. In all the challenges presented on this article the main key is “documenting yourself” on how things works inside ElasticSearch and how to make things work as you expect. Knowing the most common problems and how to avoid them is the first step. Knowing best installation and configuration practices is the second step but not less important than the first one. Finally, knowing your data and how to improve the way ElasticSearch will handle it is the final step to reach the proper setup for you.
- Kibana is a data visualization which completes the ELK stack
- In cloud-based environment infrastructures, performance and isolation is very important
- In ELK stack processing speed is strictly limited whereas Splunk offers accurate and speedy processes
- Netflix, LinkedIn, Tripware, Medium all are using ELK stack for their business
- ELK works best when logs from various Apps of an enterprise converge into a single ELK instance
- Different components In the stack can become difficult to handle when you move on to complex setup