
Last updated on 08th Jul 2020| 1940
- Data or information is in raw format. The increase in size of the data has lead to a rise in need for carrying out inspection, data cleaning, transformation as well as data modeling to gain insights from the data in order to derive conclusions for better decision making process. This process is known as data analysis.
- Data Mining is a popular type of data analysis technique to carry out data modeling as well as knowledge discovery that is geared towards predictive purposes. Business Intelligence operations provide various data analysis capabilities that rely on data aggregation as well as focus on the domain expertise of businesses. In Statistical applications, business analytics can be divided into Exploratory Data Analysis (EDA) and Confirmatory Data Analysis (CDA).
- EDA focuses on discovering new features in the data and CDA focuses on confirming or falsifying existing hypotheses. Predictive Analytics does forecasting or classification by focusing on statistical or structural models while in text analytics, statistical, linguistic and structural techniques are applied to extract and classify information from textual sources, a species of unstructured data. All these are varieties of data analysis.
- The revolutionising data wave has brought improvements to the overall functionalities in many different ways. There are various emerging requirements for applying advanced analytical techniques to the Big Data spectrum. Now experts can make more accurate and profitable decisions.
Data Analysis Process
Now in the Data Analytics tutorial, we are going to see how data is analyzed step by step.
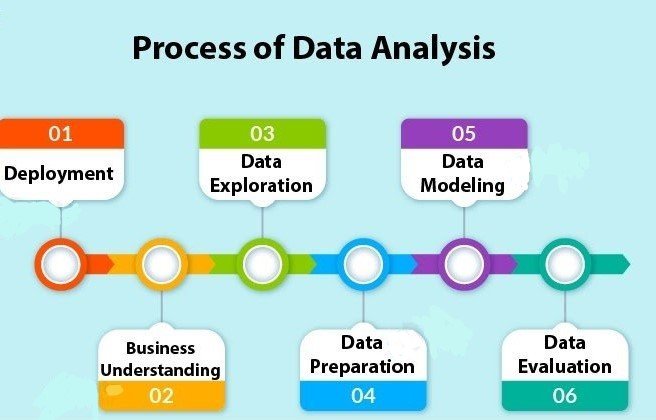
1. Business Understanding
Whenever any requirement occurs, firstly we need to determine the business objective, assess the situation, determine data mining goals and then produce the project plan as per the requirement. Business objectives are defined in this phase.
2. Data Exploration
For the further process, we need to gather initial data, describe and explore data and lastly verify data quality to ensure it contains the data we require. Data collected from the various sources is described in terms of its application and the need for the project in this phase. This is also known as data exploration. This is necessary to verify the quality of data collected.
3. Data Preparation
From the data collected in the last step, we need to select data as per the need, clean it, construct it to get useful information and then integrate it all. Finally, we need to format the data to get the appropriate data. Data is selected, cleaned, and integrated into the format finalized for the analysis in this phase.
4. Data Modeling
After gathering the data, we perform data modeling on it. For this, we need to select a modeling technique, generate test design, build a model and assess the model built. The data model is build to analyze relationships between various selected objects in the data. Test cases are built for assessing the model and model is tested and implemented on the data in this phase.
5. Data Evaluation
Here, we evaluate the results from the last step, review the scope of error, and determine the next steps to perform. We evaluate the results of the test cases and review the scope of errors in this phase.
6. Deployment
We need to plan the deployment, monitoring and maintenance and produce a final report and review the project. In this phase, we deploy the results of the analysis. This is also known as reviewing the project.The complete process is known as business analytics process.
Types of Data Analysis
There are four types of techniques used for Data Analysis:
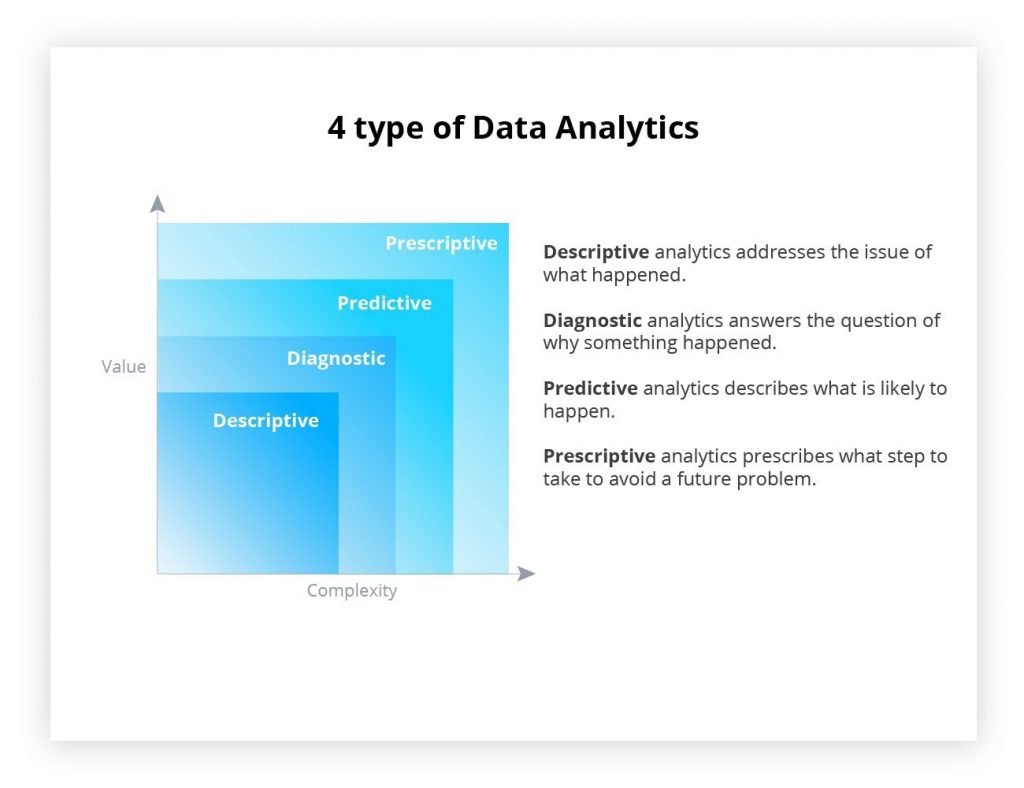
1. Descriptive Analysis
With the help of descriptive analysis, we analyze and describe the features of a data. It deals with the summarization of information. Descriptive analysis, when coupled with visual analysis provides us with a comprehensive structure of data. In the descriptive analysis, we deal with the past data to draw conclusions and present our data in the form of dashboards. In businesses, descriptive analysis is used for determining the Key Performance Indicator or KPI to evaluate the performance of the business.
2. Predictive Analysis
- With the help of predictive analysis, we determine the future outcome. Based on the analysis of the historical data, we are able to forecast the future. It makes use of descriptive analysis to generate predictions about the future. With the help of technological advancements and machine learning, we are able to obtain predictive insights about the future.
- Predictive analytics is a complex field that requires a large amount of data, skilled implementation of predictive models and its tuning to obtain accurate predictions. This requires a skilled workforce that is well versed in machine learning to develop effective models.
3. Diagnostic Analysis
- At times, businesses are required to think critically about the nature of data and understand the descriptive analysis in depth. In order to find issues in the data, we need to find anomalous patterns that might contribute towards the poor performance of our model.
- With diagnostic analysis, you are able to diagnose various problems that are exhibited through your data. Businesses use this technique to reduce their losses and optimize their performances. Some of the examples where businesses use diagnostic analysis are:
- Businesses implement diagnostic analysis to reduce latency in logistics and optimize their production process.
- With the help of diagnostic analysis in the sales domain, one can update the marketing strategies which would otherwise attenuate the total revenue.

Learn Big Data Analytics Training from Expert Trainers to Enhance Your Career
- Instructor-led Sessions
- Real-life Case Studies
- Assignments
4. Prescriptive Analysis
- Prescriptive analysis combines insights from all of the above analytical techniques. It is referred to as the final frontier of data analytics. Prescriptive analytics allows companies to make decisions based on them. It makes heavy usage of Artificial Intelligence in order to facilitate companies into making careful business decisions.
- Major industrial players like Facebook, Netflix, Amazon, and Google are using prescriptive analytics to make key business decisions. Furthermore, financial institutions are gradually leveraging the power of this technique to increase their revenue.
Top Tools in Data Analytics
With the increasing demand for Data Analytics in the market, many tools have emerged with various functionalities for this purpose. Either open-source or user-friendly, the top tools in the data analytics market are as follows.
- R programming – This tool is the leading analytics tool used for statistics and data modeling. R compiles and runs on various platforms such as UNIX, Windows, and Mac OS. It also provides tools to automatically install all packages as per user-requirement.
- Python – Python is an open-source, object-oriented programming language which is easy to read, write and maintain. It provides various machine learning and visualization libraries such as Scikit-learn,TensorFlow, Matplotlib, Pandas, Keras etc. It also can be assembled on any platform like SQL server, a MongoDB database or JSON
- Tableau Public – This is a free software that connects to any data source such as Excel, corporate Data Warehouse etc. It then creates visualizations, maps, dashboards etc with real-time updates on the web.
- QlikView – This tool offers in-memory data processing with the results delivered to the end-users quickly. It also offers data association and data visualization with data being compressed to almost 10% of its original size.
- SAS – A programming language and environment for data manipulation and analytics, this tool is easily accessible and can analyze data from different sources.
- Microsoft Excel – This tool is one of the most widely used tools for data analytics. Mostly used for clients’ internal data, this tool analyzes the tasks that summarize the data with a preview of pivot tables.
- RapidMiner – A powerful, integrated platform that can integrate with any data source types such as Access, Excel, Microsoft SQL, Tera data, Oracle, Sybase etc. This tool is mostly used for predictive analytics, such as data mining, text analytics, machine learning.
- KNIME – Konstanz Information Miner (KNIME) is an open-source data analytics platform, which allows you to analyze and model data. With the benefit of visual programming, KNIME provides a platform for reporting and integration through its modular data pipeline concept.
- OpenRefine – Also known as GoogleRefine, this data cleaning software will help you clean up data for analysis. It is used for cleaning messy data, the transformation of data and parsing data from websites.
- Apache Spark – One of the largest large-scale data processing engine, this tool executes applications in Hadoop clusters 100 times faster in memory and 10 times faster on disk. This tool is also popular for data pipelines and machine learning model development.
Benefits of Data Analysis
- Below is a list of the benefits of data analytics, which provide a clear understanding of the key outcomes businesses and their customers, while maintaining a high level of data protection .
Proactivity and Anticipating Needs
- Organizations are under immense pressure to not only concentrate on acquiring customers on a regular basis, but to also understand the demands of the consumer so that they can optimize the customer experience while developing a long-standing relationship. When customers share their data, they are actually expecting their preferred brands to have a better understanding of them, form the necessary interactions, and deliver seamless experiences across the various touch points .
- This is why companies should capture and reconcile the various customer identifiers such as email addresses, physical addresses, cell phones, etc. Customers are making use of a number of channels for interacting with the companies. This is why both digital and traditional data sources should be combined to understand the customer behavior . Customers also expect companies to deliver relevant and real-time experiences.
Mitigating fraud and risk
- The main objective of fraud and security analytics is to protect the physical, intellectual, and financial assets from being misused by either internal or external threats. Effective data and analytics capabilities will help in delivering the optimum level of prevention from fraud as well as complete organizational security .
- Using statistical methodologies for fraud propensity models, which lead to alerts, assures the timely responses that are triggered by threat detection procedures as well as automated alerts or mitigation. Data management, along with transparent and efficient reporting of all fraud incidents, may result in better management of frauds.
- Moreover, the complete integration and correlation of all the data across the entire enterprise, can provide a unified view of the trickery across the different lines of products, transactions, or businesses .
Delivering the relevant products
- There is no doubt that products are the life and blood of every organization. They are also undoubtedly the biggest investments that companies make. The role of the product management team is to find out the current trends in the market, which are responsible for driving the strategic maps for innovation, services, and new features .
- An effective and proper data collation from third-party sources, where individuals showcase their opinions and thoughts when merged with analytics, will help companies to remain competitive, even when new things are demanded or a new technology is being developed. To better understand data and analytics, you can visit RemoteDBA.com.
Personalization
- Most companies are seen to struggle with structured data . Brands have to be responsive so that they are capable of dealing with the volatility that customers create by engaging with available digital technologies. A company can react and permit the customers to feel valued, and this is possible only because of advanced analytics.
- Big data provides the opportunity to interact with customers, based on their personality and understanding their attitudes . Companies can also consider real-time locations for delivering personalization in multi-channel service environments.

Get JOB Oriented Big Data Analytics Training & Certification Course
Weekday / Weekend BatchesSee Batch DetailsOptimizing the customer experience
- If operations are poorly managed, it can lead to a number of issues that will be expensive. Furthermore, it involves the risk of spoiling the customer experience, and have a negative effect on brand loyalty. When companies apply analytics to design, control of various processes, optimization of business operations for producing products or services, it assures an effectiveness and efficiency of fulfilling customer expectations . Furthermore, companies can achieve an operational experience.
- The analytical techniques that are modern and advanced can be established for improving the productivity of field operations. It can also increase efficiency and help in optimizing the organizational workforce, in accordance with the needs of both the business as well as customer demands. The maximum use of data analytics helps to ensure continuous improvement due to the proper measurement of the main operational metrics.
Advantages of Data Analytics
Following are the advantages of data Analytics:
- It detects and correct the errors from data sets with the help of data cleansing. This helps in improving quality of data and consecutively benefits both customers and institutions such as banks, insurance and finance companies.
- It removes duplicate informations from data sets and hence saves large amount of memory space. This decreases cost to the company.
- It helps in displaying relevant advertisements on the online shopping websites based on historic data and purchase behaviour of the users. Machine learning algorithms are applied for the same. This helps in increasing revenue and productivity of the companies.
- It reduces banking risks by identifying probable fraudulent customers based on historic data analysis. This helps institutes in deciding whether to issue loan or credit cards to the applicants or not.
- It is used by security agencies for surveillane and monitoring purpose based on informations collected by huge number of sensors. This helps in preventing any wrongdoings and/or calamities.
Disadvantages of Data Analytics
The various disadvantages of data analytics are as follows:
- Data analytics can breach customer privacy as information such as online transactions, purchases, or subscriptions, can be viewed by the parent companies. There are chances that the companies will exchange these databases for mutual benefits.
- The price of the tools normally depends on the features and applications that they can support. Moreover, some tools are complex and require proper training.
- The information that is obtained by making use of data analytics can be misused.
- One of the toughest jobs is to select the correct analytics tool.
No matter the disadvantages, if businesses are capable of viewing the data, they will be able to make smart decisions for their business to achieve improved and better services or products.
Conclusion
- It is clear that when businesses bring data together, it is easier for them to get real-time insights about sales and finance, marketing, product development, and much more. Data allows the teams within a business to better collaborate, to achieve better results, and outsell rival companies.