Last updated on 10th Jul 2020| 3852
What is the ELK Stack?
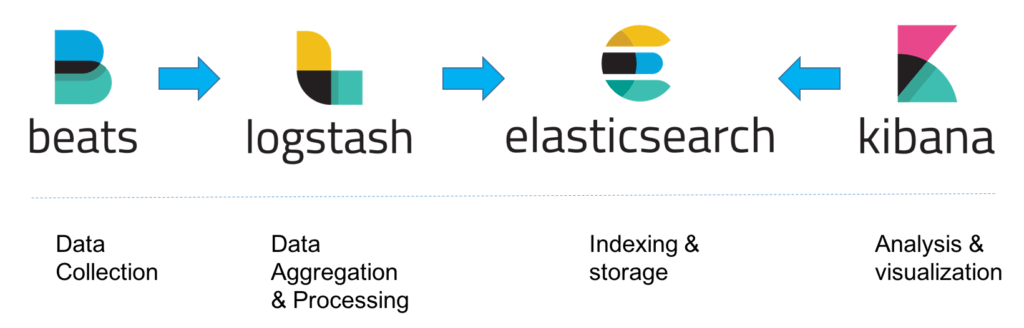
The ELK Stack is a collection of three open-source products : Elasticsearch, Logstash, and Kibana. They are all developed, managed ,and maintained by the company Elastic.
E stands for Elastic Search: used for storing logs
L stands for Log Stash : used for both shipping as well as processing and storing logs
K stands for Kibana: is a visualization tool (a web interface) which is hosted through Nginx or Apache.
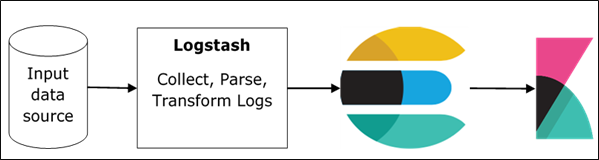
ELK Stack is designed to allow users to take data from any source, in any format, and to search, analyze, and visualize that data in real time.
ELK provides centralized logging that is useful when attempting to identify problems with servers or applications. It allows you to search all your logs in a single place. It also helps to find issues that occur in multiple servers by connecting their logs during a specific time frame.
Why is ELK So Popular?
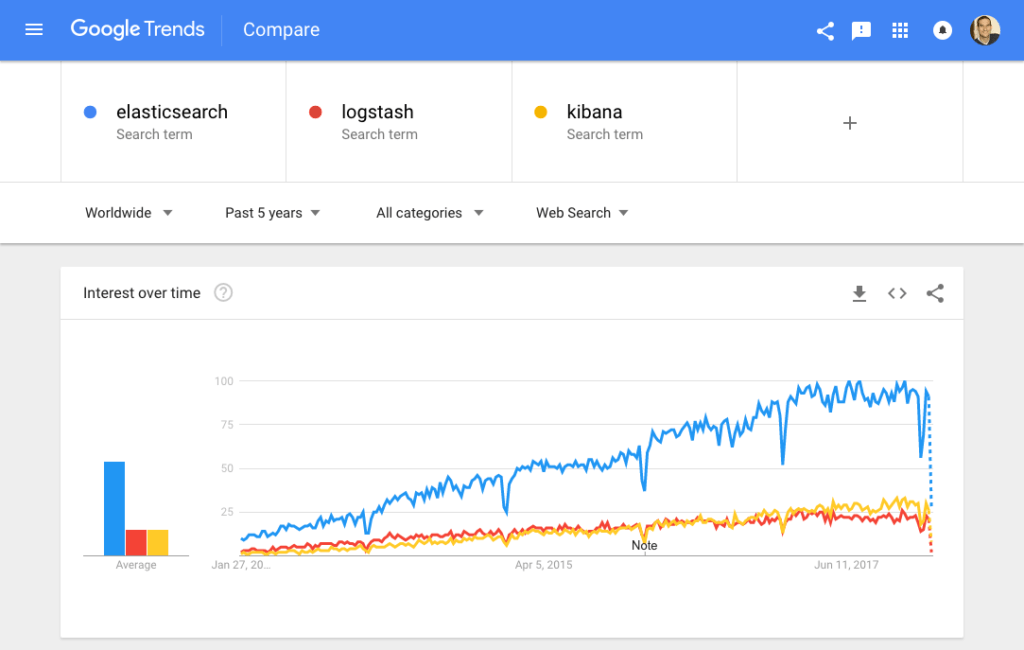
The ELK Stack is popular because it fulfills a need in the log management and analytics space. Monitoring modern applications and the IT infrastructure they are deployed on requires a log management and analytics solution that enables engineers to overcome the challenge of monitoring what are highly distributed, dynamic and noisy environments.
The ELK Stack helps by providing users with a powerful platform that collects and processes data from multiple data sources, stores that data in one centralized data store that can scale as data grows, and that provides a set of tools to analyze the data.
Of course, the ELK Stack is open source. With IT organizations favoring open source products, this alone could explain the popularity of the stack. Using open source means organizations can avoid vendor lock-in and onboard new talent much more easily. Everyone knows how to use Kibana, right? Open source also means a vibrant community constantly driving new features and innovation and helping out in case of need.
Sure, Splunk has long been a market leader in the space. But its numerous functionalities are increasingly not worth the expensive price — especially for smaller companies such as SaaS products and tech startups. S plunk has about 15,000 customers while ELK is downloaded more times in a single month than S plunk’s total customer count — and many times over at that. ELK might not have all of the features of S plunk, but it does not need those analytical bells and whistles. ELK is a simple but robust log management and analytics platform that costs a fraction of the price.
Why is Log Analysis Becoming More Important?
In today’s competitive world, organizations cannot afford one second of downtime or slow performance of their applications. Performance issues can damage a brand and in some cases translate into a direct revenue loss. For the same reason, organizations cannot afford to be compromised as well, and not complying with regulatory standards can result in hefty fines and damage a business just as much as a performance issue.
To ensure apps are available, perform ant and secure at all times, engineers rely on the different types of data generated by their applications and the infrastructure supporting them. This data, whether event logs or metrics, or both, enables monitoring of these systems and the identification and resolution of issues should they occur.
Logs have always existed and so have the different tools available for analyzing them. What has changed, though, is the underlying architecture of the environments generating these logs. Architecture has evolved into microservices, containers and orchestration infrastructure deployed on the cloud, across clouds or in hybrid environments. Not only that, the sheer volume of data generated by these environments is constantly growing and constitutes a challenge in itself. Long gone are the days when an engineer could simply SSH into a machine and grep a log file. This cannot be done in environments consisting of hundreds of containers generating TBs of log data a day.
This is where centralized log management and analytics solutions such as the ELK Stack come into the picture, allowing engineers, whether DevOps, IT Operations or SREs, to gain the visibility they need and ensure apps are available and perform ant at all times.
Modern log management and analysis solutions include the following key capabilities:
- Aggregation : the ability to collect and ship logs from multiple data sources.
- Processing : the ability to transform log messages into meaningful data for easier analysis.
- Storage : the ability to store data for extended time periods to allow for monitoring, trend analysis, and security use cases.
- Analysis the ability to dissect the data by querying it and creating visualizations and dashboards on top of it.
How to Use the ELK Stack for Log Analysis?
As I mentioned above, taken together, the different components of the ELK Stack provide a simple yet powerful solution for log management and analytics.
The various components in the ELK Stack were designed to interact and play nicely with each other without too much extra configuration. However, how you end up designing the stack greatly differs depending on your environment and use case.
For a small-sized development environment, the classic architecture will look as follows:
However, for handling more complex pipelines built for handling large amounts of data in production, additional components are likely to be added into your logging architecture, for resiliency (Kafka, RabbitMQ, Redis) and security (nginx):
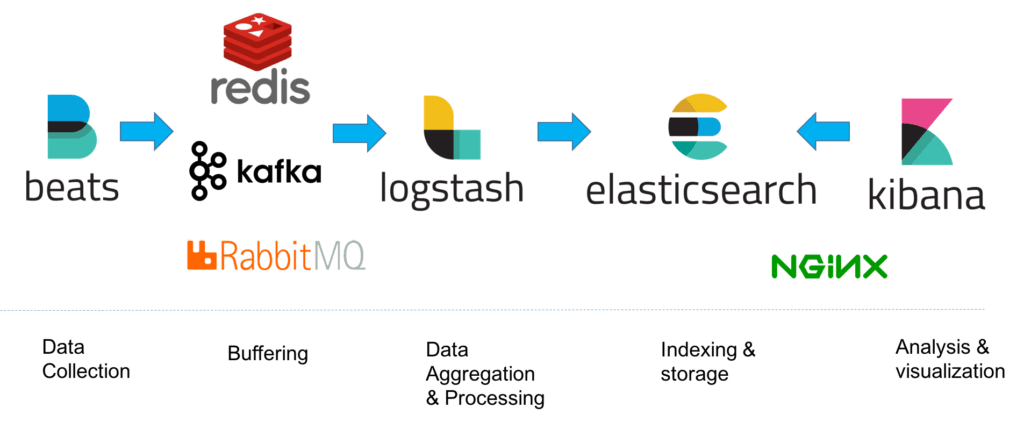
This is of course a simplified diagram for the sake of illustration. A full production-grade architecture will consist of multiple Elasticsearch nodes, perhaps multiple Logstash instances, an archiving mechanism, an alerting plugin and a full replication across regions or segments of your data center for high availability. You can read a full description of what it takes to deploy ELK as a production-grade log management and analytics solution in the relevant section below.
What’s New?
As one might expect from an extremely popular open source project, the ELK Stack is constantly and frequently updated with new features. Keeping abreast of these changes is challenging, so in this section we’ll provide a highlight of the new features introduced in major releases.
Elasticsearch
Elasticsearch 7.x is much easier to setup since it now ships with Java bundled. Performance improvements include a real memory circuit breaker, improved search performance and a 1-shard policy. In addition, a new cluster coordination layer makes Elasticsearch more salable and resilient.
Logstash
Logstash’s Java execution engine (announced as experimental in version 6.3) is enabled by default in version 7.x. Replacing the old Ruby execution engine, it boasts better performance, reduced memory usage and overall — an entirely faster experience.
Kibana
Kibana is undergoing some major face lifting with new pages and usability improvements. The latest release includes a dark mode, improved querying and filtering and improvements to Canvas.
Beats
Beats 7.x conform with the new Elastic Common Schema (ECS) — a new standard for field formatting. Metric beat supports a new AWS module for pulling data from Amazon Cloud Watch, Kinesis and SQS. New modules were introduced in File beat and Audit beat as well.
ELASTICSEARCH
What is Elasticsearch?
Elasticsearch is the living heart of what is today the world’s most popular log analytics platform — the ELK Stack (Elasticsearch, Logstash, and Kibana). The role played by Elasticsearch is so central that it has become synonymous with the name of the stack itself. Used primarily for search and log analysis, Elasticsearch is today one of the most popular database systems available today.
Initially released in 2010, Elasticsearch is a modern search and analytics engine which is based on Apache Lucene. Completely open source and built with Java, Elasticsearch is categorized as a NoSQL database. Elasticsearch stores data in an unstructured way, and up until recently you could not query the data using SQL. The new Elasticsearch SQL project will allow using SQL statements to interact with the data. You can read more on that in this article.
Unlike most No SQL databases, though, Elasticsearch has a strong focus on search capabilities and features so much so, in fact, that the easiest way to get data from Elasticsearch is to search for it using its extensive REST API.
In the context of data analysis, Elasticsearch is used together with the other components in the ELK Stack, Logstash and Kibana, and plays the role of data indexing and storage.
Read more about installing and using Elasticsearch in our Elasticsearch tutorial.
Basic Elasticsearch Concepts
Elasticsearch is a feature-rich and complex system. Detailing and drilling down into each of its nuts and bolts is impossible. However, there are some basic concepts and terms that all Elasticsearch users should learn and become familiar with. Below are the six “must-know” concepts to start with.
Index
Elasticsearch Indices are logical partitions of documents and can be compared to a database in the world of relational databases. Continuing our e-commerce app example, you could have one index containing all of the data related to the products and another with all of the data related to the customers.

Enroll in ELK Stack Training to Build Your Skills to Next Level
- Instructor-led Sessions
- Real-life Case Studies
- Assignments
You can have as many indices defined in Elasticsearch as you want but this can affect performance. These, in turn, will hold documents that are unique to each index.Indices are identified by lowercase names that are used when performing various actions (such as searching and deleting) against the documents that are inside each index.
Documents
Documents are JSON objects that are stored within an Elasticsearch index and are considered the base unit of storage. In the world of relational databases, documents can be compared to a row in a table.In the example of our e-commerce app, ou could have one document per product or one document per order. There is no limit to how many documents you can store in a particular index.
Data in documents is defined with fields comprised of keys and values. A key is the name of the field, and a value can be an item of many different types such as a string, a number, a boolean expression, another object, or an array of values.
Types
Elasticsearch types are used within documents to subdivide similar types of data wherein each type represents a unique class of documents. Types consist of a name and a mapping (see below) and are used by adding the _type field. This field can then be used for filtering when querying a specific type.
Types are gradually being removed from Elasticsearch. Starting with Elasticsearch 6, indices can have only one mapping type. Starting in version 7.x, specifying types in requests is deprecated. Starting in version 8.x, specifying types in requests will no longer be supported.
Mapping
Like a schema in the world of relational databases, mapping defines the different types that reside within an index. It defines the fields for documents of a specific type — the data type (such as string and integer) and how the fields should be indexed and stored in Elasticsearch.
A mapping can be defined explicitly or generated automatically when a document is indexed using templates. (Templates include settings and mappings that can be applied automatically to a new index.)
Shards
Index size is a common cause of Elasticsearch crashes. Since there is no limit to how many documents you can store on each index, an index may take up an amount of disk space that exceeds the limits of the hosting server. As soon as an index approaches this limit, indexing will begin to fail.
One way to counter this problem is to split up indices horizontally into pieces called shards. This allows you to distribute operations across shards and nodes to improve performance. You can control the amount of shards per index and host these “index-like” shards on any node in your Elasticsearch cluster.
Replicas
To allow you to easily recover from system failures such as unexpected downtime or network issues, Elasticsearch allows users to make copies of shards called replicas. Because replicas were designed to ensure high availability, they are not allocated on the same node as the shard they are copied from. Similar to shards, the number of replicas can be defined when creating the index but also altered at a later stage.
Elasticsearch Queries
Elasticsearch is built on top of Apache Lucene and exposes Lucene’s query syntax. Getting acquainted with the syntax and its various operators will go a long way in helping you query Elasticsearch.
Boolean Operators
As with most computer languages, Elasticsearch supports the AND, OR, and NOT operators:
jack AND jill
Will return events that contain both jack and jill
ahab NOT moby
Will return events that contain ahab but not moby
tom OR jerry
Will return events that contain tom or jerry, or both
Fields
You might be looking for events where a specific field contains certain terms. You specify that as follows:
Ranges
You can search for fields within a specific range, using square brackets for inclusive range searches and curly braces for exclusive range searches:
age:[3 TO 10]
Will return events with age between 3 and 10
price:{100 TO 400}
Will return events with prices between 101 and 399
name:[Adam TO Ziggy]
Will return names between and including Adam and Ziggy
Wildcards, Regexes and Fuzzy Searching
A search would not be a search without the wildcards. You can use the * character for multiple character wildcards or the ? character for single character wildcards.
URI Search
The easiest way to search your Elasticsearch cluster is through URI search. You can pass a simple query to Elasticsearch using the q query parameter. The following query will search your whole cluster for documents with a name field equal to “Travis”:
Combined with the Luce syntax, you can build quite impressive searches. Usually, you’ll have to URL-encode characters such as spaces (it’s been omitted in these examples for clarity):
A number of options are available that allow you to customize the URI search, specifically in terms of which analyzer to use (analyzer), whether the query should be fault-tolerant (lenient), and whether an explanation of the scoring should be provided (explain).
Although the URI search is a simple and efficient way to query your cluster, you’ll quickly find that it doesn’t support all of the features offered to you by Elasticsearch. The full power of Elasticsearch is exposed through Request Body Search. Using Request Body Search allows you to build a complex search request using various elements and query clauses that will match, filter, and order as well as manipulate documents based on multiple criteria.
More information on Request Body Search in Elasticsearch, Query DSLand examples can be found in our: Elasticsearch Queries: A Thorough Guide.
Elasticsearch REST API
One of the great things about Elasticsearch is its extensive REST API which allows you to integrate, manage and query the indexed data in countless different ways. Examples of using this API to integrate with Elasticsearch data are abundant, spanning different companies and use cases.
Interacting with the API is easy — you can use any HTTP client but Kibana comes with a built-in tool called Console which can be used for this purpose.
Some of its important features are:
- Stores data centrally for looking for it quickly
- Offers advanced queries for better data analysis
- You can use it to index heterogeneous data
- Offers Near Real-Time search, which means that you can find the documents right after they are indexed. So, you can update and add more data to the documents in real-time.
- Offers Geolocation support and Multilanguage support
- Use Multi-document APIs for handling individual records
Some of the important components of Elasticsearch are:
- Index – They are logical partitions of documents that have similar characteristics
- Node –This is an Elasticsearch instance
- Shard – Indices can be split into horizontal shards or pieces
- Document – JSON objects that are storage units and are stored in an Elasticsearch index
- Cluster – A collection of nodes
KIBANA
No centralized logging solution is complete without an analysis and visualization tool. Without being able to efficiently query and monitor data, there is little use to only aggregating and storing it. Kibana plays that role in the ELK Stack — a powerful analysis and visualization layer on top of Elasticsearch and Logstash.
What is Kibana?
Completely open source, Kibana is a browser-based user interface that can be used to search, analyze and visualize the data stored in Elasticsearch indices (Kibana cannot be used in conjunction with other databases). Kibana is especially renowned and popular due to its rich graphical and visualization capabilities that allow users to explore large volumes of data.
Kibana can be installed on Linux, Windows and Mac using .zip or tar.gz, repositories or on Docker. Kibana runs on node.js, and the installation packages come built-in with the required binaries. Read more about setting up Kibana in our Kibana tutorial.
Please note that changes have been made in more recent versions to the licensing model, including the inclusion of basic X-Pack features into the default installation packages.
Kibana searches
Searching Elasticsearch for specific log message or strings within these messages is the bread and butter of Kibana. In recent versions of Kibana, improvements and changes to the way searching is done have been applied.
By default, users now use a new querying language called KQL (Kibana Querying Language) to search their data. Users accustomed to the previous method — using Lucene — can opt to do so as well.
Kibana querying is an art unto itself, and there are various methods you can use to perform searches on your data. Here are some of the most common search types:
- Free text searches – used for quickly searching for a specific string.
- Field-level searches – used for searching for a string within a specific field.
- Logical statements – used to combine searches into a logical statement.
- Proximity searches – used for searching terms within a specific character proximity.
Kibana visualizations
As mentioned above, Kibana is renowned for visualization capabilities. Using a wide variety of different charts and graphs, you can slice and dice your data any way you want. You can create your own custom visualizations with the help of vega and vega-lite. You will find that you can do almost whatever you want with you data.
Creating visualizations, however, is now always straightforward and can take time. Key to making this process painless is knowing your data. The more you are acquainted with the different nooks and crannies in your data, the easier it is.
Kibana visualizations are built on top of Elasticsearch queries. Using Elasticsearch aggregations (e.g. sum, average, min, mac, etc.), you can perform various processing actions to make your visualizations depict trends in the data.
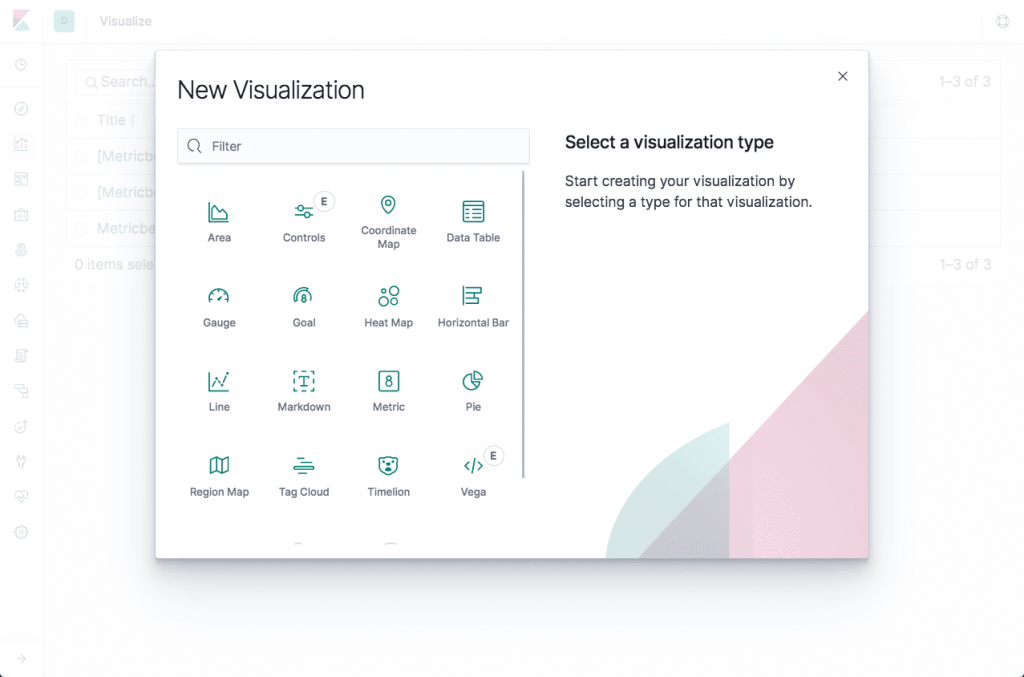
Visualization types
Visualizations in Kibana are categorized into five different types of visualizations:
- Basic Charts (Area, Heat Map, Horizontal Bar, Line, Pie, Vertical bar)
- Data (Date Table, Gauge, Goal, Metric)
- Maps (Coordinate Map, Region Map)
- Time series (Timelion, Visual Builder)
- Other (Controls, Markdown, Tag Cloud)
Conclusion
The ELK Stack is used by famous corporations all over the world such as Netflix, Medium and LinkedIn for handling their log data. This is because the tool works great while collecting data from different applications and converge it into a single instance. It is also very useful in vertical and horizontal scaling. Moreover, it supports multiple languages such as Python, Java, Perl and Ruby.
So, if you are a business owner struggling to handle your log data, ELK is the solution. For understanding the basics, keep this ELK Stack tutorial handy.