Last updated on 19th Jul 2025| 11851
- Introduction to ER Diagrams
- What is an Entity?
- Types of Entities
- What is a Relationship in ER Diagrams?
- Attributes in ER Models
- Types of Attributes in ER Diagrams
- Cardinality in ER Diagrams
- Keys in ER Models
- Generalization, Specialization, and Aggregation
- How to Create an ER Diagram
- Best Practices for ER Modeling
- Conclusion
Introduction
An Entity Relationship Diagram (ER Diagram in DBMS) is a graphical representation that illustrates how entities such as people, objects, or concepts relate to each other within a database. Proposed by Peter Chen in 1976, the ER Diagram in DBMS is a foundational tool in relational database design, helping define the structure of a database even before it is built. These diagrams assist developers, database administrators, and analysts in visualizing the flow and organization of data, making it easier to understand relationships among various components of a system. Strengthen your technical foundation and upskill with targeted resources through DataBase Developer Training. They play a key role in conceptual database modeling and often serve as the first step in designing a robust and coherent database schema.
Do You Want to Learn More About Database? Get Info From Our Database Online Training Today!
What is an Entity?
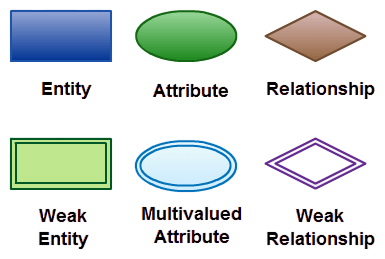
An entity is any real-world object or concept that has its own independent existence in the area being studied. In data modeling, entities include a wide variety of representations, covering both physical and abstract areas. They can be concrete items like employees, students, cars, and books, as well as ideas like courses, departments, and accounts. Each entity has specific attributes that give detailed descriptions and unique identifiers. For example, an employee entity could be defined by attributes such as Employee_ID, Name, and Designation, which together capture important details about the person. Visually, these entities are often shown as rectangles in an Entity Diagram in DBMS, helping designers organize and structure database components. The Entity Diagram in DBMS plays a central role in understanding complex data relationships and supports the development of logical and efficient database systems. For insights into how different NoSQL databases handle data modeling and relationships, explore the Cassandra Vs MongoDB. It is a powerful visual tool that simplifies the design process and improves communication among developers, database administrators, and analysts.
Types of Entities
Entities in ER diagrams are broadly classified into the following categories:
Strong Entities:
- Exist independently.
- Have a primary key.
- Example: Student, Employee.
Weak Entities:
- Depend on a strong entity for identification.
- Do not have a primary key of their own.
- Example: Dependent, OrderItem.
Associative Entities:
- Used to associate two entities that share a many-to-many relationship.
- Sometimes have attributes of their own.
- Example: Enrollment between Student and Course.
Understanding the type of entity is essential in identifying the correct relationship cardinality and keys.
Would You Like to Know More About Database? Sign Up For Our Database Online Training Now!
What is a Relationship in ER Diagrams?
In an ER diagram, a relationship defines how two or more entities are related to each other. To enhance query performance and better understand database structure, explore Types Of SQL Indexes.
- One-to-One (1:1): Example: A person has one passport.
- One-to-Many (1:N): Example: One customer can place many orders.
- Many-to-Many (M:N): Example: Students can enroll in many courses, and courses can have many students.
Relationships are shown using diamonds in ER diagrams. The participating entities are linked to the relationship diamond using straight lines.

Attributes in ER Models
Attributes are data fields that describe the properties of entities or relationships. Every attribute adds context or meaning to the entity. In data modeling, entities like a Book have distinctive attributes that serve as essential descriptors. These attributes, including Title, ISBN, Author, and Publisher, are usually shown through ellipses connected to their corresponding entity, illustrating their relationship in an Entity Diagram in DBMS. For in-depth learning on data modeling and diagram interpretation, check out Database Online Training. The design stresses that each attribute must have a meaningful name, which helps in clear and precise data identification.
Additionally, the attribute structure allows for complexity through composite attributes that can be broken down into sub-attributes, adding more detail. Another notable feature is derived attributes, which are calculated from other existing attributes, providing flexibility to the data model. This method ensures a detailed and flexible framework for representing complex informational entities clearly and accurately. A well-structured Entity Diagram in DBMS incorporates all these elements to visualize relationships and ensure consistency in database design.
To Earn Your Database Certification, Gain Insights From Leading Blockchain Experts And Advance Your Career With ACTE’s Database Online Training Today!
Types of Attributes in ER Diagrams
In data modeling, attributes are vital for defining and describing entities. They come in different forms, each serving a specific purpose in representing information. Simple or atomic attributes show basic, indivisible traits like age or salary. Composite attributes can be broken down further, such as a name separating into first and last name. Derived attributes provide insights by being calculated from existing data points, like finding age from a date of birth. If you’re looking to master these concepts and build a career around data modeling, explore How To Become a Data Modeler. Multivalued attributes offer flexibility by allowing several values for one trait, such as multiple phone numbers for one person. Key attributes are essential for uniquely identifying specific entities, like a student ID number. In an ER model diagram in DBMS, these different attribute types are visually linked to their entities, helping designers clarify relationships and data characteristics. A well-structured ER model diagram in DBMS serves as a powerful tool for capturing the complexity of real-world information systems. It ensures attributes are logically organized and supports clear, scalable database designs that meet analytical and business needs.
Cardinality in ER Diagrams
Cardinality defines the number of instances of one entity that can be associated with instances of another entity:
- One-to-One (1:1): A person has one driving license.
- One-to-Many (1:N): A teacher can teach many classes.
- Many-to-Many (M:N): Authors can write many books, and books can have multiple authors.
Cardinality constraints guide the relational schema design, ensuring referential integrity and optimizing performance.
Preparing for a Database Job? Have a Look at Our Blog on Database Interview Questions and Answers To Ace Your Interview!
Keys in ER Models
Keys are crucial in database modeling as they ensure that each record or entity instance can be uniquely identified within an ER model diagram in DBMS. To explore how indexing, query structure, and join strategies impact performance, check out A Complete Guide on SQL Optimization Techniques.
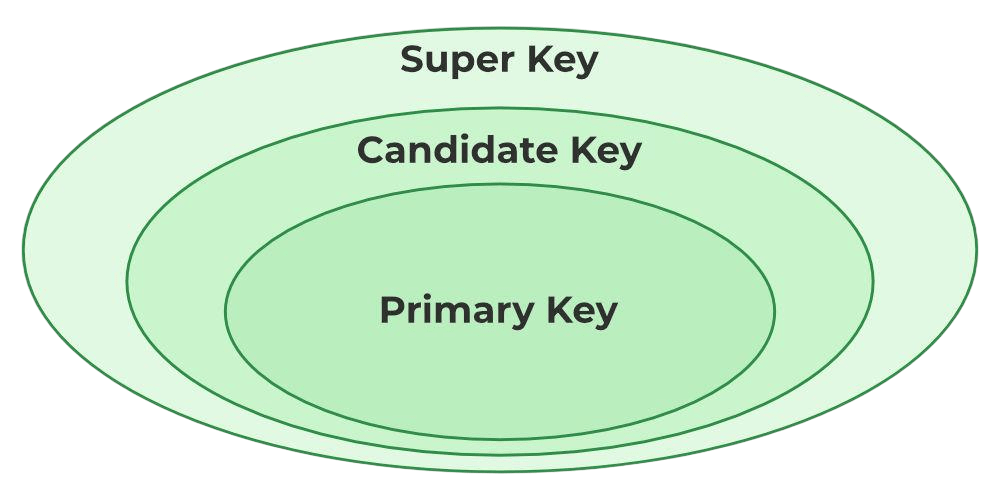
- Primary Key: Unique identifier for an entity. Example: Employee_ID.
- Candidate Key: All possible keys that can act as a primary key.
- Foreign Key: An attribute that refers to the primary key of another entity.
- Composite Key: Formed by combining two or more attributes.
Keys are marked as underlined in ER diagrams.
Generalization, Specialization, and Aggregation
In Entity Relationship (ER) diagram modeling, techniques like generalization, specialization, and aggregation are essential for simplifying complex data representations. Generalization lets designers group multiple entities into a broader concept. For example, Car and Truck can be combined into a larger Vehicle entity. Specialization, on the other hand, breaks down a general entity into specific sub-entities, like turning an Employee into distinct roles like Manager and Clerk. Aggregation adds complexity by allowing relationships to have attributes or connect with other entities. For instance, a Project assignment to an Employee may include a specific date. These modeling approaches are fundamental when constructing an Entity Diagram in DBMS, as they improve the clarity of database designs and support better planning. For strategies that enhance learning and understanding of database concepts, explore Discovering Smart Ways to Learning. A well-designed Entity Diagram in DBMS leverages these techniques to create more detailed and flexible representations of organizational data relationships. This ultimately enhances the efficiency of database architecture and information management strategies.
How to Create an ER Diagram
Creating an ER diagram involves multiple steps:
- Requirement Analysis: Understand the business process.
- Identify Entities: List all the real-world objects.
- Determine Relationships: Connect entities based on interactions.
- Add Attributes: Assign attributes to each entity.
- Define Keys: Choose primary and foreign keys.
- Draw the Diagram: Use rectangles, diamonds, ellipses, and lines.
- Review and Normalize: Ensure logical accuracy and eliminate redundancies.
Popular tools like Lucidchart, Draw.io, Microsoft Visio, and ERDPlus make this process easier.
Best Practices for ER Modeling
Best practices for designing ER diagrams:
- Start with high-level entities: Work downward.
- Avoid redundant entities or attributes: Keep the model clean and efficient.
- Clearly define and document all keys: Include primary and foreign keys.
- Use consistent naming conventions: Enhance readability and maintenance.
- Normalize attributes: Avoid data duplication through proper design.
- Review diagrams with stakeholders regularly: Validate business accuracy and completeness.
- Don’t overcomplicate: Keep the diagram readable.
Following best practices ensures that your ER model diagram in DBMS remains scalable and easy to understand, even as projects grow in complexity.
Conclusion
ER Diagram in DBMS is an indispensable tool in database design. It offers a conceptual blueprint of how data is structured and how entities interact within a system. Whether you’re creating a small-scale app or a large enterprise database, understanding how to design and interpret an ER Diagram in DBMS is a foundational skill for any database developer, software engineer, or data analyst. By mastering ER diagrams, you’re not just learning a modeling technique, you’re gaining the ability to build data systems that are efficient, scalable, and aligned with real-world logic. Expand your expertise further through Database Online Training. It’s more than just using a diagramming tool; it’s about developing a skill that ensures your database can grow and adapt to evolving needs. A well-crafted ER diagram bridges the gap between raw data structures and practical application, making data management more reliable and easier to maintain over time. That’s why ER diagrams are a key part of any database development process.