 LMS
LMS
Last updated on 16th Jul 2026| 4563
 (5.0) | 23746 Ratings
E-mail this post
(5.0) | 23746 Ratings
E-mail this post
- Introduction to Python, SQL, and Power BI in Data Science
- Setting Up Python, SQL, and Power BI Environment
- Python Basics for Data Science Beginners
- SQL Fundamentals for Data Analysis
- Data Cleaning and Analysis Using Python
- Querying and Managing Data with SQL
- Creating Interactive Dashboards in Power BI
- Integrating Python, SQL, and Power BI in Data Science Projects
- Best Practices for Learning Data Science Tools
- Conclusion: Building Strong Data Science Skills with Python, SQL, and Power BI
Introduction to Python, SQL, and Power BI in Data Science
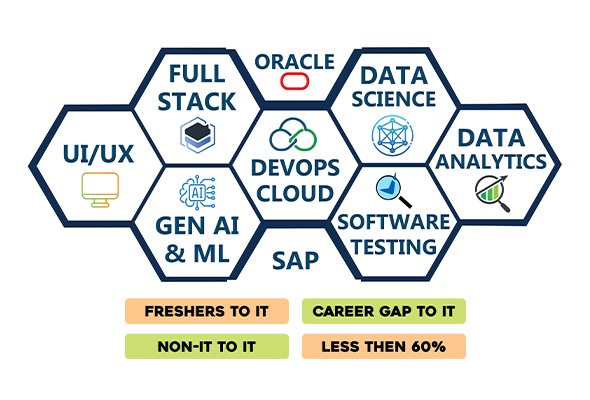
Python, SQL, and Power BI are three of the most essential tools used by data science professionals to collect, process, analyze, and visualize data. Each tool serves a unique purpose within the data science workflow. Python is widely used for programming, data manipulation, machine learning, automation, and statistical analysis due to its simplicity and extensive library ecosystem. SQL is the standard language for managing and querying relational databases, enabling professionals to retrieve, filter, update, and organize large volumes of structured data efficiently. Power BI is a powerful business intelligence tool that transforms complex datasets into interactive dashboards and visual reports, helping organizations make informed business decisions. Together, these tools enable data scientists to perform end-to-end analytics, from extracting raw data and cleaning it to building predictive models and presenting actionable insights. Professionals can master these technologies through Data Science Training, gaining practical skills and hands-on experience with real-world projects. Mastering Python, SQL, and Power BI provides a strong technical foundation for aspiring data scientists and significantly improves employability across industries such as finance, healthcare, retail, manufacturing, and information technology.
Setting Up Python, SQL, and Power BI Environment
Before beginning data science projects, it is important to set up a reliable development environment for Python, SQL, and Power BI. Python can be installed using the official Python distribution or through platforms like Anaconda, which includes essential libraries and development tools such as Jupyter Notebook and Spyder. Beginners should also install popular Python libraries including NumPy, Pandas, Matplotlib, Seaborn, and Scikit-learn for data analysis and machine learning tasks. For SQL, learners can use database systems such as MySQL, PostgreSQL, or SQLite along with database management tools like MySQL Workbench or pgAdmin. Beginners can also follow this Spark SQL Tutorial to strengthen their SQL knowledge. Power BI Desktop can be installed to build interactive dashboards and connect to various data sources. Proper configuration of these tools ensures a smooth workflow for importing, cleaning, analyzing, and visualizing data. A well-prepared environment enables learners to practice efficiently, complete projects successfully, and gain practical experience with industry-standard technologies.
Get Your Data Science Certification by Learning from Industry-Leading Experts and Advancing Your Career with ACTE’s Data Science Course.
Python Basics for Data Science Beginners
Python is one of the most beginner-friendly programming languages and serves as the foundation for many data science tasks. New learners should start by understanding variables, data types, operators, conditional statements, loops, functions, and object-oriented programming concepts. Once these fundamentals are mastered, beginners can explore data structures such as lists, tuples, dictionaries, and sets, which are commonly used for storing and manipulating data. Python libraries like NumPy simplify numerical computations, while Pandas enables efficient data manipulation using DataFrames. Visualization libraries such as Matplotlib and Seaborn help create charts and graphs for data exploration. Beginners should also learn file handling, exception handling, and basic data preprocessing techniques to prepare datasets for analysis. Practicing coding exercises, solving real-world problems, and working on small projects help strengthen programming skills. A solid understanding of Python fundamentals forms the basis for advanced topics such as machine learning, artificial intelligence, and predictive analytics.
SQL Fundamentals for Data Analysis
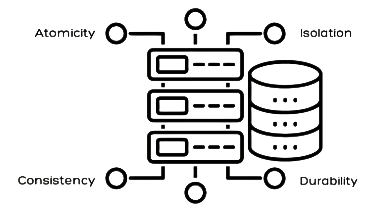
SQL, or Structured Query Language, is the standard language used to store, retrieve, update, and manage data within relational databases. Data analysts and data scientists use SQL to access structured datasets efficiently before performing further analysis using programming languages like Python. Beginners should learn how to create databases and tables, insert records, retrieve data using SELECT statements, filter results with WHERE clauses, sort data using ORDER BY, and aggregate information with functions such as COUNT, SUM, AVG, MIN, and MAX. Understanding JOIN operations is particularly important because they combine data from multiple tables to generate meaningful insights. Additional concepts such as GROUP BY, HAVING, subqueries, views, and indexes improve query performance and analytical capabilities. These skills form the foundation of Data Analytics Concepts and Importance. SQL is widely used across industries because it enables professionals to work with large datasets efficiently. Strong SQL skills are essential for building reliable data pipelines and supporting business intelligence and machine learning workflows.

Data Cleaning and Analysis Using Python
Data cleaning is one of the most important stages in any data science project because the quality of analysis depends on the quality of the data. Python provides powerful libraries such as Pandas and NumPy that simplify the process of cleaning, transforming, and preparing datasets for analysis. These practical skills are covered in Data Science Training, including handling missing values, removing duplicate records, correcting inconsistent formats, managing outliers, converting data types, and standardizing values. After cleaning the data, analysts perform exploratory data analysis (EDA) to identify trends, relationships, and patterns using statistical summaries and visualizations created with Matplotlib and Seaborn. Python also enables feature engineering, data aggregation, and correlation analysis to improve predictive modeling performance. Developing strong data cleaning and analysis skills allows professionals to create accurate datasets, generate meaningful business insights, and build reliable machine learning models that support data-driven decision-making across various industries.

Get JOB Oriented Data Science Training for Beginners By MNC Experts
- Instructor-led Sessions
- Real-life Case Studies
- Assignments
Querying and Managing Data with SQL
- Writing Basic SQL Queries: Learn to use the SELECT statement to retrieve data from database tables. Basic SQL queries help users access, filter, and organize information efficiently, forming the foundation for data analysis and reporting.
- Filtering Data Using WHERE Clause: The WHERE clause filters records based on specific conditions. It allows users to retrieve only relevant data, making queries more accurate and useful for business analysis and decision-making.
- Sorting Results with ORDER BY: The ORDER BY clause arranges query results in ascending or descending order. Sorting data helps users analyze trends, compare values, and improve the readability of database reports.
- Using Aggregate Functions for Analysis: Aggregate functions such as COUNT, SUM, AVG, MIN, and MAX summarize data and generate valuable business insights from large datasets quickly and efficiently.
- Joining Multiple Tables with JOIN: The JOIN operation combines related data from multiple database tables. It helps create meaningful reports used by Data Scientist vs Analyst vs Engineer professionals to analyze customer, product, sales, and transaction data.
- Managing Databases with SQL Commands: SQL commands like CREATE, INSERT, UPDATE, DELETE, and DROP allow users to create, modify, maintain, and manage databases while ensuring organized and accurate data storage.
Want to Master Data Science? Explore the Data Science Master Program Offered at ACTE Today!
Creating Interactive Dashboards in Power BI
- Importing Data from Multiple Sources: Power BI connects to Excel files, SQL databases, cloud services, and APIs. Importing data from different sources enables users to create comprehensive business reports and dashboards.
- Cleaning and Transforming Data with Power Query: Power Query helps remove duplicates, handle missing values, rename columns, and transform datasets before visualization, ensuring clean and reliable data for analysis.
- Creating Charts and Visualizations: Power BI provides bar charts, line graphs, pie charts, maps, and other visual elements that help users understand patterns, trends, and business performance effectively.
- Building Interactive Dashboards: Interactive dashboards allow users to explore data using filters, slicers, and drill-down features. These skills support data analysis and improve decision-making by presenting business insights in an engaging and interactive visual format.
- Using DAX for Calculated Measures: Data Analysis Expressions (DAX) enables users to create calculated columns, custom measures, and advanced business metrics that enhance dashboard functionality and analytical capabilities.
- Publishing and Sharing Power BI Reports: Power BI allows users to publish dashboards to the cloud and securely share reports with team members, managers, and stakeholders. These practical skills also support Data Science Interview Preparation.
Want to Learn About DevOps? Explore Our Data Science Interview Questions and Answers Featuring the Most Frequently Asked Questions in Job Interviews.
Integrating Python, SQL, and Power BI in Data Science Projects
- Extracting Data Using SQL: SQL retrieves structured data from relational databases efficiently. It provides the raw information required for analysis, reporting, and machine learning workflows.
- Cleaning and Processing Data with Python: Python libraries like Pandas and NumPy clean, transform, and prepare datasets by handling missing values, removing duplicates, and converting data into analysis-ready formats.
- Performing Exploratory Data Analysis: Exploratory Data Analysis (EDA) uses Python to identify trends, correlations, outliers, and patterns through statistical summaries and visualizations before model development.
- Connecting Python Output to Power BI: Processed data from Python can be imported into Power BI for visualization. This integration helps convert analytical results into interactive dashboards and business reports.
- Creating End-to-End Data Science Workflows: Combining SQL, Python, and Power BI creates a complete workflow from data extraction and preprocessing to analysis, visualization, and ML Basics Tutorial for Data Science Interns.
- Automating Reporting and Business Insights: Automation reduces manual work by scheduling data updates, report generation, and dashboard refreshes, ensuring organizations always have access to current business insights.
Best Practices for Learning Data Science Tools
- Build a Strong Foundation in Python and SQL: Mastering Python programming and SQL querying creates a strong technical foundation that supports advanced topics such as machine learning, analytics, and business intelligence.
- Practice with Real-World Datasets: Working with real datasets helps learners understand practical business challenges while improving data cleaning, analysis, visualization, and problem-solving skills.
- Create Hands-on Data Science Projects: Building projects allows learners to apply theoretical knowledge, strengthen technical expertise, and Data Science Internship Portfolio for internships and job opportunities.
- Learn Data Visualization Techniques: Understanding visualization principles helps communicate analytical findings effectively through charts, dashboards, and interactive reports using Power BI and Python libraries.
- Use GitHub to Showcase Your Projects: Publishing projects on GitHub demonstrates coding ability, project management skills, and practical experience, making candidates more attractive to recruiters and employers.
- Continuously Upgrade Your Technical Skills: Data science technologies evolve rapidly. Learning new tools, cloud platforms, AI frameworks, and analytical techniques helps professionals remain competitive throughout their careers.
Conclusion: Building Strong Data Science Skills with Python, SQL, and Power BI
Mastering Python, SQL, and Power BI provides a strong foundation for building a successful career in data science. These three tools complement one another throughout the data science lifecycle, from extracting and managing data with SQL to cleaning, analyzing, and developing machine learning models with Python, and finally presenting meaningful insights through interactive Power BI dashboards. Developing proficiency in these technologies through Data Science Training enables aspiring professionals to solve real-world business problems, automate data workflows, and support data-driven decision-making across industries. Consistent practice through hands-on projects, real-world datasets, internships, and professional certifications helps strengthen both technical knowledge and practical experience. Maintaining a portfolio of projects on platforms such as GitHub further demonstrates expertise to potential employers. As technology continues to evolve, continuously learning new frameworks, cloud platforms, and advanced analytics techniques will enhance career opportunities and professional growth. By building strong skills in Python, SQL, and Power BI while staying committed to continuous improvement, aspiring data scientists can prepare themselves for rewarding careers in analytics, artificial intelligence, machine learning, and business intelligence across a wide range of industries.