
Last updated on 17th Jul 2025| 11267
- Introduction
- What is Firebug
- History and Evolution of Firebug
- Key Features of Firebug
- How to Use Firebug for Web Development
- Firebug for Testing and Debugging
- Firebug Extensions and Add-ons
- Conclusion
Introduction
In the early stages of web development, debugging and troubleshooting were often challenging tasks. Developers had to rely on basic tools, manually comb through lines of code, use alert popups for testing JavaScript, and follow a trial-and-error approach to identify and fix issues. This process was time-consuming and inefficient, creating a major hurdle in building responsive and functional web applications. The lack of integrated and user-friendly debugging solutions made even simple tasks unnecessarily complex. The landscape of web development changed significantly with the introduction of Firebug, a groundbreaking extension for the Firefox browser. Firebug brought a suite of powerful tools directly into the browser, giving developers unprecedented control and visibility over their web pages. For the first time, developers could inspect and modify HTML elements in real time, edit CSS rules on the fly, and debug JavaScript without relying on external tools or guesswork. This level of interactivity and precision marked a turning point in the way websites were built and maintained. One of Firebug’s standout features was its ability to monitor network activity, allowing developers to track loading times, API calls, and resource usage. This helped identify performance bottlenecks and optimize web applications more effectively. Firebug also supported console logging, error tracking, and script debugging, making it a comprehensive tool for front-end development. Although Firebug has since been discontinued and its features absorbed into modern browser developer tools, its legacy lives on. It set the standard for in-browser development tools and played a crucial role in shaping the tools and practices that developers use today. Understanding the history and impact of Firebug offers valuable insight into the evolution of web development and the importance of accessible debugging solutions.
Do You Want to Learn More About Software Testing? Get Info From Our Software Testing Training Course Today!
What is Firebug
Firebug was a powerful add-on developed for the Mozilla Firefox browser, created to give web developers a more efficient way to inspect, debug, and modify the front-end components of a website. It allowed real-time access to HTML, CSS, and JavaScript, making it possible to view and change code directly within the browser environment. Before Firebug, developers had limited options and often had to rely on slow, manual processes to test and fix front-end issues. Firebug changed that by offering a responsive and intuitive interface that made debugging both faster and more accurate. One of Firebug’s most valuable features was its ability to inspect the Document Object Model, or DOM, in a structured and readable format. Developers could explore every element on a page, view the applied styles, and make adjustments on the fly.
Live editing of HTML and CSS meant that developers could instantly see the results of their changes without needing to reload the page, which significantly sped up the development process. Firebug also brought advanced JavaScript debugging capabilities, such as setting breakpoints, stepping through code, and evaluating variables in real time. This made it easier to trace logic errors and understand how scripts were executing in the browser. Another major strength of Firebug was its network monitoring panel, which tracked HTTP requests, AJAX responses, and resource load times. This helped developers identify slow-loading elements and optimize performance. In addition to all this, Firebug included a console for logging errors, warnings, and custom messages. It became an all-in-one toolkit that gave developers deep insight into browser behavior and front-end code execution. Firebug played a key role in shaping the modern approach to web development by making debugging more accessible, visual, and efficient.
History and Evolution of Firebug
- Origins and Creator: Firebug was first released in 2006 by Joe Hewitt, a developer who also played a key role in creating Firefox. At that time, web development was evolving rapidly, but debugging tools were minimal and often limited to basic JavaScript alerts.
- Context of Release: The mid-2000s saw the rise of dynamic, JavaScript-heavy web applications. Developers needed more sophisticated tools to inspect, debug, and edit web pages in real-time. Firebug emerged as a response to this growing demand.
- Rich User Interface: Firebug provided a rich, user-friendly interface that made debugging easier. It displayed HTML, CSS, and JavaScript in an organized, interactive way, helping developers understand and fix issues quickly.
- Modular Design: Its modular design featured multiple tabs, each dedicated to a specific function like HTML inspection, CSS editing, and script debugging. This structure allowed users to focus on particular aspects of their web pages with ease.
- Real-time Editing: One of Firebug’s standout features was its ability to edit HTML, CSS, and JavaScript inline and see the changes instantly in the browser. This dramatically sped up the development and debugging process.
- Community and Extensions: By 2008, Firebug had become essential for front-end developers worldwide. It fostered a large, active community that created numerous extensions, enhancing its capabilities and adapting it to new development needs.
- Retirement and Legacy: In 2017, Mozilla retired Firebug, integrating its core features into Firefox’s built-in Developer Tools. This move aimed to modernize browser debugging using native technologies like HTML5 and JavaScript, overcoming Firebug’s legacy limitations.
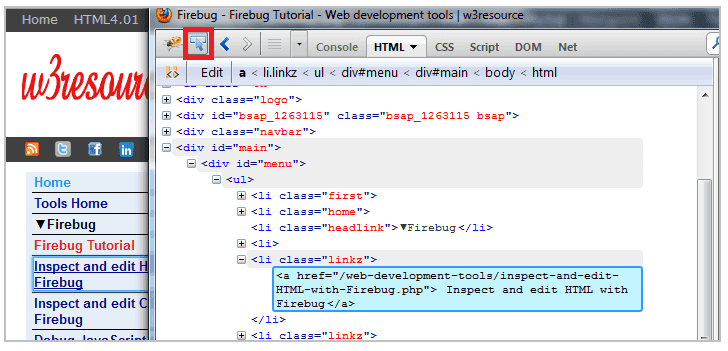
- HTML Inspector: This feature allows developers to hover over elements on a webpage to highlight them visually and reveal their underlying HTML structure. It supported direct editing of the DOM, providing instant feedback on any changes made, which helped speed up debugging and page design.
- CSS Editor: The CSS editor enabled inspecting and modifying CSS rules in real time. Firebug displayed how styles cascaded and which rules were inherited or overridden. It also provided warnings about conflicting styles, helping developers maintain clean and effective styling.
- JavaScript Console: An interactive console offers a place to run JavaScript code snippets, view error messages, and track variable states during execution. This made debugging scripts more straightforward by allowing immediate feedback and testing of code directly within the browser.
- Debugger: The debugger allowed developers to set breakpoints in their JavaScript code, step through the execution line by line, and inspect the execution context. This feature was crucial for identifying logic errors and understanding script behavior during runtime.
- Network Monitor: This tool displayed all HTTP requests made by the browser, including GET and POST requests, along with response headers, payloads, and timing details. It was especially valuable for debugging AJAX-heavy websites by monitoring data exchange between client and server.
- DOM Viewer: The DOM viewer presented a hierarchical tree view of the webpage’s DOM. Developers could expand nodes to explore element properties and dynamically modify values, which helped in understanding and manipulating page structure.
- Storage Inspector: This feature allows users to view browser storage such as cookies, local storage, and session storage. It was essential for testing and debugging applications that relied on client-side storage for maintaining state or preferences.
- UI Verification: Firebug allows developers and testers to quickly inspect visual aspects of a webpage such as alignment, colors, fonts, and spacing. By editing CSS styles in real time, they could instantly see the effects, making it easier to identify and fix UI inconsistencies.
- Functional Debugging: This feature helped observe how user interactions triggered JavaScript functions or caused changes in the DOM. It provided insight into how the front-end responded to events, assisting in identifying issues in functionality or behavior.
- XPath Selection: Firebug enabled copying or generating XPath and CSS selectors for any element on the page. These selectors are essential for automation testing frameworks like Selenium, where precise element identification is crucial for scripting and test execution.
- AJAX Troubleshooting: The Network panel allowed testers to monitor API calls, especially AJAX requests, ensuring that dynamic content was correctly loaded and updated.
- Error Tracking: JavaScript errors were captured and displayed directly within Firebug’s console. This made it easier for developers and testers to quickly spot and diagnose script issues without needing separate debugging tools.
- Improved Collaboration: By providing a common platform for both developers and testers to inspect, debug, and verify web applications, Firebug bridged the gap between development and testing teams.
- Enhanced Testing Efficiency: The combination of these features made Firebug an indispensable tool, boosting testing efficiency and accuracy. It streamlined workflows by integrating UI inspection, debugging, and network analysis into a single environment.
Would You Like to Know More About Software Testing? Sign Up For Our Software Testing Training Course Now!
Key Features of Firebug


How to Use Firebug for Web Development
Although Firebug is no longer in use today, understanding how it was once integrated into the daily workflow of developers offers valuable insight into the evolution of modern browser tools. For many, Firebug was their first real introduction to live front-end debugging. It provided an interactive, feedback-driven environment that made web development faster, more efficient, and more intuitive. By exploring how developers used Firebug during a typical development cycle, beginners can better appreciate the features now built directly into today’s browsers. In a standard workflow, developers often began by inspecting HTML and CSS. Using Firebug’s HTML panel, they could click on any element on a webpage and immediately see its code highlighted in the DOM. Inline editing made it easy to test layout changes, experiment with fonts, and tweak styles without refreshing the page. The CSS panel showed all active style rules applied to the selected element. Developers could quickly modify values, enable or disable properties, and observe real-time visual changes. This helped with troubleshooting layout issues and testing design ideas on the spot. JavaScript debugging was another powerful feature. The Script tab allowed users to set breakpoints, step through code, and inspect variables at different execution points. This made identifying and fixing logical errors far more manageable than using basic alert statements. Firebug also made network monitoring straightforward. The Net panel displayed all HTTP requests, including AJAX calls. Developers could view request details, response data, and loading times, making it easier to debug asynchronous operations and performance issues. Finally, the console acted as an experimental space where developers typed JavaScript directly to test interactions, explore the DOM, or check output. This flexibility helped users understand page behavior more deeply. Firebug offered a complete, hands-on workflow that laid the foundation for the sophisticated developer tools used today.
Are You Considering Pursuing a Master’s Degree in Software Testing? Enroll in the Software Testing Master Program Training Course Today!
Firebug for Testing and Debugging
Firebug Extensions and Add-ons
One of Firebug’s greatest strengths was its extensibility, which allowed developers to customize and expand its capabilities through a wide range of community-created plug-ins. This made Firebug not just a debugging tool, but a highly adaptable development environment that catered to both front-end and back-end workflows. Whether you were testing web performance, validating layout precision, or inspecting server-side activity, Firebug’s extensions offered targeted solutions to meet those needs. Among the most popular extensions was FirePath, a tool that allowed users to generate XPath and CSS selectors for any element on a web page. This was especially useful for writing automated test scripts in Selenium, where accurate element targeting is essential. FirePath simplified the process by visually highlighting elements and displaying the corresponding selector, making test creation faster and more accurate. FirePHP was another powerful extension, particularly for backend developers. It enabled PHP applications to send debugging information directly to the Firebug console. This allowed developers to log variables, errors, and performance data from the server side without disrupting the user interface or relying on traditional log files. YSlow, developed by Yahoo, focused on performance. It analyzed web pages and provided suggestions for optimization based on established best practices. From minimizing HTTP requests to enabling compression, YSlow helped developers build faster, more efficient websites. Pixel Perfect was a favorite among designers. It lets users overlay a web page with a design mockup, allowing for pixel-by-pixel comparison between the final output and the original layout. This was essential for achieving visual accuracy. FireQuery extended Firebug’s jQuery capabilities, making it easier to debug jQuery code by highlighting elements with associated jQuery data and events. Together, these extensions made Firebug a highly flexible and indispensable tool for a wide range of development tasks.
Conclusion
Firebug may no longer be in active use, but its legacy remains a foundational part of modern web development. It was one of the first tools that gave developers easy access to the internal workings of a web page, transforming what was once a rigid and opaque environment into something transparent and editable. Firebug introduced a new way of working by allowing developers to interact with, experiment on, and debug live websites directly within the browser, without needing to refresh the page or rely on external tools. Before browsers came with built-in developer tools, Firebug filled a critical gap. It provided essential features like HTML and CSS inspection, real-time editing, JavaScript debugging, and network monitoring all in one interface. These capabilities allowed developers to identify problems quickly and test solutions on the spot, making their workflows more efficient. Firebug set the standard for what modern browser developer tools would later adopt and refine. In addition to its technical contributions, Firebug also changed how teams collaborated. Developers, testers, and designers could work more closely together by visually exploring issues and trying out changes in real time. This made communication easier and reduced the back-and-forth often involved in troubleshooting and fine-tuning web pages. Today, tools like Chrome DevTools and Firefox Developer Edition carry forward the features and workflows that Firebug helped establish. Although more powerful and refined, these tools still reflect the same principles of interactivity and instant feedback. Understanding Firebug is not just about remembering an old tool; it is about recognizing a major shift in how web development evolved. The skills and concepts it introduced remain relevant and form the backbone of the tools developers rely on today.