
Tableau is a Business Intelligence tool for visually analyzing the data. Users can create and distribute an interactive and shareable dashboard, which depict the trends, variations, and density of the data in the form of graphs and charts. Tableau can connect to files, relational and Big Data sources to acquire and process data. The software allows data blending and real-time collaboration, which makes it very unique. It is used by businesses, academic researchers, and many government organizations for visual data analysis. It is also positioned as a leader Business Intelligence and Analytics Platform in Gartner Magic Quadrant.
Tableau Server is the most secure way to distribute Tableau workbooks. It helps you to embed live interactive dashboards and provide high security to your data. This Tableau Server Tutorial, allows you to have an overview regarding the basics of Tableau Server. Following are the topics covered in this tutorial,
- Tableau Server Components
- Tableau Server Installation
- Activating the Product
- Configuring the Server
- Setting Up Distributed Server
- Adding Users
Tableau Server Components
The following are the various server components of Tableau:
- Application Server: This process handles browsing and permissions for Tableau Server Web and mobile interfaces.
- VizQL Server: It sends queries to the data source upon request from clients and returns a result set that is rendered as images. Ultimately, it presents them to the users.
- Data Server: It lets users manage and store Tableau data sources, while also maintaining the metadata from Tableau Desktop.
Tableau Architecture
- Tableau Server is designed to connect many data tiers. It can connect clients from Mobile, Web, and Desktop. Tableau Desktop is a powerful data visualization tool. It is very secure and highly available.
- It can run on both the physical machines and virtual machines. It is a multi-process, multi-user, and multi-threaded system.
- Providing such powerful features requires unique architecture.
- The different layers used in Tableau server are given in the following architecture diagram:-

Let’s study about the different component of the Tableau architecture:
1. Data server:- The primary component of Tableau Architecture is the Data sources which can connect to it.
Tableau can connect with multiple data sources. It can blend the data from various data sources. It can connect to an excel file, database, and a web application at the same time. It can also make the relationship between different types of data sources.
2. Data connector:- The Data Connectors provide an interface to connect external data sources with the Tableau Data Server.
Tableau has in-built SQL/ODBC connector. This ODBC Connector can be connected with any databases without using their native connector. Tableau desktop has an option to select both extract and live data. On the uses basis, one can be easily switched between live and extracted data.
- Real-time data or live connection: Tableau can be connected with real data by linking to the external database directly. It uses the infrastructure existing database by sending dynamic multidimensional expressions (MDX) and SQL statements. This feature can be used as a linking between the live data and Tableau rather than importing the data. It makes optimized and a fast database system. Mostly in other enterprises, the size of the database is large, and it is updated periodically. In these cases, Tableau works as a front-end visualization tool by connecting with the live data.
- Extracted or in-memory data: Tableau is an option to extract the data from external data sources. We make a local copy in the form of Tableau extract file. It can remove millions of records in the Tableau data engine with a single click. Tableau’s data engine uses storage such as ROM, RAM, and cache memory to process and store data. Using filters, Tableau can extract a few records from a large dataset. This improves performance, especially when we are working on massive datasets. Extracted data allows the users to visualize the data offline, without connecting to the data source.
3. Components of Tableau server: Different types of component of the Tableau server are:
- Application server
- VizQL server
- Data server
A. Application server: The application server is used to provide the authorizations and authentications. It handles the permission and administration for mobile and web interfaces. It gives a guarantee of security by recording each session id on Tableau Server. The administrator is configuring the default timeout of the session in the server.
B. VizQL server: VizQL server is used to convert the queries from the data source into visualizations. Once the client request is forwarded to the VizQL process, it sends the query directly to the data source retrieves information in the form of images. This visualization or image is presented for the users. Tableau server creates a cache of visualization to reduce the load time. The cache can be shared between many users who have permission to view the visualization.
C. Data server: Data server is used to store and manage the data from external data sources. It is a central data management system. It provides data security, metadata management, data connection, driver requirements, and data storage. It stores the related details of data set like calculated fields, metadata, groups, sets, and parameters. The data source can extract the data as well as make live connections with external data sources.
4. Gateway: The gateway directed the requests from users to Tableau components. When the client sends a request, it is forwarded to the external load balancer for processing. The gateway works as a distributor of processes to different components. In case of absence of external load balancer, the gateway also works as a load balancer. For single server configuration, one gateway or primary server manages all the processes. For multiple server configurations, one physical system works as a primary server, and others are used as worker servers. Only one machine is used as a primary server in Tableau Server environment.
5. Clients: The visualizations and dashboards in Tableau server can be edited and viewed using different clients. Clients are a web browser, mobile applications, and Tableau Desktop.
- Web Browser: Web browsers like Google Chrome, Safari, and Firefox support the Tableau server. The visualization and contents in the dashboard can be edited by using these web browser.
- Mobile Application: The dashboard from the server can be interactively visualized using mobile application and browser. It is used to edit and view the contents in the workbook.
- Tableau Desktop: Tableau desktop is a business analytics tool. It is used to view, create, and publish the dashboard in Tableau server. Users can access the various data source and build visualization in Tableau desktop.
Tableau Features:
1. Apt visualizations:
- Tableau connects to many different data sources and can visualize larger data sets than Power BI can. Once in Tableau, a dashboard shows the basics of the users’ data. The user can then drill down into data sets by downloading a worksheet. From there, they can apply various visualizations to the data.
- In Tableau, you select the data and switch between visualizations on the fly. It’s easier to jump between visualizations in Tableau.
- Tableau visualizes data from the start, allowing you to see the significance right away. Tableau differentiates correlations using color, size, labels and shapes, giving you context as you drill down and explore on a granular level.
2. Depth of discovery:
The features of Tableau gives users ways to answer questions as they investigate data visualizations. The solution can show basic trends as predictions, use “what if” queries to adjust data hypothetically, and visualize components of data dynamically for comparisons.
3. Implementation:
Tableau provides a variety of implementation and consulting services. For enterprise-level deployment, there’s a four-step process spanning weeks, and for smaller-scale deployments, there are quick-start options that can complete setup in a matter of hours.
Tableau provides a variety of implementation and consulting services. For enterprise-level deployment, there’s a four-step process:
- Phase 1 – This phase involves IT planning, architecture consulting, pre-install checkup, server installation and verification, and validation of security configuration.
- Phase 2 – Phase 2 involves working with data and data migration, including data modeling, data mining, data extraction, data sources and business workflow.
- Phase 3 – In Phase 3, there’s a two-day classroom training covering Tableau Fundamentals, hands-on advanced coaching, and building and formatting visualizations.
- Phase 4 – This final phase helps companies expand Tableau usage across their business. It includes implementation workshops where topics such as evaluating action plans and defining measurable outcomes are discussed.
4. Automation functionality:
Tableau is a little more intuitive with creating processes and calculations. For example, when creating calculations in a tabular format, the formula can be typed once, stored as a field and applied to all rows referencing that source. This makes it easier to create and apply recurring processes. Tableau’s flexibility also allows users to create custom formulas that aren’t available in most of the tools.
5. Data source connectors:
- Tableau offers hundreds of native connectors to easily pull, cleanse and correlate data from practically any source without having to create custom code.
- Tableau extracts large data sets from sources for quick, ad-hoc analysis using two different methods: Live Connection and In-memory. Both adapt to your local database and, based on the size and capacity, sync data quickly by extracting the relevant data to a query. It also has a general Open Database Connectivity (ODBC) connection for any connections that don’t have a native connector provided. This is the reason, you can see an increasing demand graph for Tableau certification training.
STEPS TO INSTALL TABLEAU
Step-1: Time to download & install Tableau
Tableau offers five main products catering to diverse visualization needs for professionals and organizations. They are:
- Tableau Desktop: Made for individual use
- Tableau Server: Collaboration for any organization
- Tableau Online: Business Intelligence in the Cloud
- Tableau Reader: Let you read files saved in Tableau Desktop.
- Tableau Public: For journalists or anyone to publish interactive data online.
Quick Features
- Tableau Public and Tableau Reader are free to use, while both Tableau Server and Tableau Desktop come with a 14 days fully functional free trial period, after which the user must pay for the software.
- Tableau Desktop comes in both a Professional and a lower cost Personal edition. Tableau Online is available with an annual subscription for a single user, and scales to support thousands of users. Tableau have gone through different versions, here we will discuss the learning curve of Tableau Desktop 9.0.
- You can download trial version of Tableau Desktop from Tableau website but it is available for 14 days only. Install it in on your machine by following steps and start for your data visualization journey.
- After 14 days, you can continue your data visualization journey using Tableau public but it comes with its limitations and you have to share your data publicly.
Step-2: Getting Started with Tableau
Tableau provides Free Online, Live and Classroom (paid) training programs. This is the best place to start your journey. I would recommend you to follow the path below. Here is Free Online training (“On demand”) with additional resources. All these videos contain the data set to explore at your end.
To watch these training videos, first you need to register yourself. Expand the “Getting Started” section and watch available three videos. These videos will talk about connecting with data, data preparation, building views, filters, dashboards, story points and ways to distribute.
- Getting Started
- The Tableau Interface
- Distribution and Publishing
Step-3: Connecting With Data
Tableau can connect with various data sources such as text, excel file, databases to big data queries also. In this section, we will look at the basics and advance feature of data connectivity with different sources. Here we will also look at Join types, Data Blending, connection with cubes, custom sql and Google Analytics.
This section has 12 videos and average length of videos are 5 minutes.
- Connecting with Data
- Tableau 9.0 brings more connections
- Connect Tableau to Any Big Data Source (MongoDB and Salesforce)
- Connectivity using Custom SQL (Resource1, Resource2)
Step-4: Creating Views and Analysis
- Tableau has multiple options to represent data in different views, applying filters /drill downs /formatting, creating sets, groups, generating trend lines and performing forecasting. Start exploring !
- You have now looked at various objects to visualize data. One big dilemma that you will face while creating data visualization is which object should you choose to represent data.
- The snapshot below will help you to choose and decide the type of visualization. However, the feature of automatic selection of views available in tableau takes care of this issue largely. This feature automatically activates best views for selected dimension(s) and measure(s). Hence, you need no worry. You are in safe hands !
- Creating Views in Tableau
- Visual Analytics
- Mapping
Step-5: Exercise
- Till now, we have looked at data connectivity, various objects and views creation in Tableau. Its time to get your hands dirty with data and generate inferences using different visualization methods:
- Kaggle has hosted a data science competition to predict category of crime in San Francisco based on 12 years (From 1934 to 1963) of crime reports from across all of San Francisco’s neighborhoods (time, location and other features are given).
- I would encourage you to explore the dataset (train.csv) visually using Tableau (to download data set, you need to register on Kaggle) and unhide hidden trends like:
- Is there specific clusters with higher crime rate
- Is there yearly/ Monthly/ Daily/ Hourly trend
- Crime distribution is even across all geographical areas or different
Please share your visualization on our social media channels and tag us, best visualizations will be rewarded exciting gift vouchers.
Step-6: Time to socialize – Join Community and Groups
Now that you have good understanding of Tableau, it’s time to become a part of Tableau communities. This will help you a lot to enhance your learning, get answers to questions and simplified description for complex topics by bloggers. I am listing some of the most useful resources below:
- Tableau Community: It works on a principle of Learn, Connect and Enjoy. It has forums, groups, ideas, Viz talk and workbook library. Here you can get your questions answered quickly. By using ‘ideas’ section, you can Vote on the Tableau Community’s best product ideas and add your own to the mix.
- Analytics Vidhya Discuss: We are niche in this domain but have tableau experts on board. These experts will answer your questions in detail and in simplistic approach. Our discussion portal already has few questions related to Tableau and a lot of other topics. You should jump in, if you have not already.
- Blogs: Blogs are always helpful to understand detailed content covering basic and advance concept of any complex topic in a more structured and simplistic way.
- Tableau Linkedin/ Facebook Groups: LinkedIn and Facebook has some excellent groups to ask questions and connect with peers or experts, some groups of special interest are:
- Tableau Software: The biggest Tableau group on Facebook, with over ~75k likes.
- Tableau Software Fans & Friends and Tableau Enthusiasts : These two are biggest and active group on LinkedIn having 20 and 6 thousands members respectively.
Step-7: Dashboards & Stories
Tableau ‘Dashboard and Stories’ creation is USP (Unique selling proposition) of the product. The dashboards so created turn out to be amazing and it certainly takes this product to next level. Tableau online training program has a separate section for Dashboards and Stories. This section covers the topic as listed below:
- Dashboard and Story Creation
- Adding views and objects to dashboards
- Applying Filters to dashboard
- Various Layouts and Formatting options
- Interactive Dashboard
- Story Points
Step-8: Advance Expressions
Besides the available measures and dimensions, you can create a calculated expression to develop a new visualization. It may be based on date, mathematical logic, text expressions, input parameters and others. For Data scientists, they can connect tableau with R to enhance the power for analytical inferences.
- Calculations
- Creating Calculated Fields
- Using the TOTAL function to summarize dimensions
- Tableau Essentials: Calculated Fields – Aggregate Functions
- Integrating Tableau and R for data analytics in four simple steps
Step-9: Advance Visualization Methods
Tableau has awesome features to create advanced visualizations. We can generate advance charts in Tableau by playing with some of the properties of objects. Below is the list of advance visualization methods which helps to represent the data in more effective way:
- Waterfall Charts
- Bump Charts
- Funnel Charts
- Box Plot
- Pareto Charts
- Histograms and Others
You can refer How To section of “On Demand” tableau training to explore these visualization methods.
Step-10: Introduction of Tableau Server and Online
Using Tableau server and Online, you can schedule the tasks and provide authorization to enable data security. It is a job of Tableau administrator but having understanding about these concepts always help you in dashboard development. Below are the resources to understand these two concepts more effectively.
- Tableau Server
- Tableau Online
Step-11: Practice makes everyone perfect
By now, I have almost covered most of the concepts you need to create a good dashboard / visualization. Now it’s time to practice more and more such that you get a firm hold of this tool and you feel comfortable with any aspect of Tableau.
Tools of Tableau
A list of Tableau tools:
- Tableau Desktop
- Tableau Public
- Tableau Online
- Tableau Server
- Tableau Reader
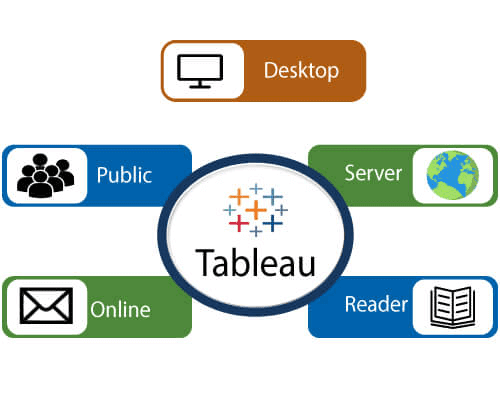
Data analytics in Tableau is classified into two parts:-
- Developer Tools:- The Tableau tools which are used for development such as the creation of charts, dashboards, report generation and visualization are known as developer’s tools. Tableau Desktop and the Tableau Public, are the example of this type.
- Sharing Tools:- The role of these tools are sharing the reports, visualizations, and dashboards that were created using the developer tools. The Tableau tools that fall into this category are Tableau Server, Tableau Online, and Tableau Reader.
Let’s see all the Tools one by one:
Tableau Desktop
- Tableau Desktop has a rich feature set and allows us to code and customize reports. Right from creating the reports, charts to blending them all to form a dashboard, all the necessary work is created in Tableau Desktop.
- For live data analysis, Tableau Desktop establish connectivity between the Data Warehouse and other various types of files. The dashboards and the workbooks created here can be either shared locally or publicly.
Based on the connectivity to the publishing option and data sources, Tableau Desktop is also classified into two parts-
- Tableau Desktop Personal:- The personal version of the Tableau desktop keeps the workbook private, and the access is limited. The workbooks can’t be published online. So, it should be distributed either offline or in Tableau public.
- Tableau Desktop Professional:- It is similar to Tableau desktop. The main difference is that the workbooks created in the Tableau desktop can be published online or in Tableau server. In the professional version, there is full access to all sorts datatypes. It is best for those who want to publish their workbook in Tableau server.
Tableau Public
- This Tableau version is specially built for cost-effective users. The word ‘Public‘ means that the created workbooks cannot be saved locally. They should be kept on the Tableau’s public cloud, which can be accessed and viewed by anyone.
- There is no privacy of the files saved on the cloud, so anyone can access and download the same data. This version is the best for them who want to share their data with the general public and for the individuals who want to learn Tableau.
Tableau Online
- Its functionality is similar to the tableau server, but data is stored on the servers that hosted on the cloud, which is maintained by the Tableau group.
- There is no storage limit on the data which is published in the Tableau Online. Tableau Online creates a direct link over 40 data sources who are hosted in the cloud such as the Hive, MySQL, Spark SQL, Amazon Aurora, and many more.
- To be published, both Tableau Server and Tableau online require the workbooks that are created by Tableau Desktop. Data that flow from the web applications say Tableau Server and Tableau Online also support Google Analytics and Salesforce.com.
Tableau Server
- The software is correctly used to share the workbooks, visualizations, which is created in the Tableau Desktop application over the organization. To share dashboards in the Tableau Server, you should first publish your workbook in the Tableau Desktop. Once the workbook has been uploaded to the server, it will be accessible only to the authorized users.
- It’s not necessary that the authorized users have the Tableau Server installed on their machine. They only require the login credentials by which they can check reports by the web browser. The security is very high in Tableau server, and it is beneficial for quick and effective sharing of data.
- The admin of the organization has full control over the server. The organization maintains the hardware and the software.
Tableau Reader
- Tableau Reader is a free tool which allows us to view the visualizations and workbooks, which is created using Tableau Desktop or Tableau Public. The data can be filtered, but modifications and editing are restricted. There is no security in Tableau Reader as anyone can view workbook using Tableau Reader.
- If you want to share the dashboards which are created by you, the receiver should have Tableau Reader to view the document.
Tableau Career Opportunities and Jobs
- This area unit the key points for to settle on the careers in Tableau.
- Fast analytics to everybody.
- Can produce visualizations for an outsized quantity of information.
- No programming full-fledged needed.32
- Leverage the facility of info
- Extremely straightforward to integrate
Tableau provides solutions for all types of industries, departments and knowledge environments. As a number one knowledge visual image tool, Tableau has several fascinating and distinctive options.
- By 2020, the globe is ready to get fifty times the number of information as in 2011, in line with a study by International knowledge Corporation (IDC). With this large quantity of information and real business implications at play, business organizations across the globe have the necessity for a simple to use tool to research knowledge and derive unjust insights from it.
- Tableau helps organizations do precisely this! Therefore, the recognition of Tableau – the four-time leader in Gartner’s magic quadrant – is predicted to travel through the roof.
Here are a unit some trends that show however the demand for tableau consultants is peaking.
a. Tableau Jobs Trends
- As the demand for Tableau professionals is increasing, additional and additional individual’s area unit moving into for Tableau coaching and certification. The rising trend for Tableau coaching in Google trends could be a testimony to the expansion in demand for Tableau Professionals.
b. Tableau Earnings
- Not solely there’s a good demand for Tableau consultants, there is a unit Brobdingnagian rewards on supply additionally. Tableau professionals are becoming paid the simplest salaries within the trade, with a mean of $106,000. The common salaries too, area unit on associate degree upward trend with the recent average salaries growing to as high as $158,000.
- Let’s Explore Tableau Design Flow in Tableau Dashboard & Worksheet
c. Prime Corporations Yearning for Tableau Talent
- A number of these corporations include Facebook, Dell, Applied Systems, Booz Allen Hamilton, NetJets, University of California, Groupon, General Motors, Sony natural philosophy, Sunguard, Bank of America, KPMG, Verizon among others. Therefore if you aim to figure for the massive names within the trade, a career in Tableau is that the manner towards it.
d. Kind of Tableau Jobs Role on Supply
The best issue a few Tableau careers is you’ve got a spread of job roles to settle on from and at various levels in your Tableau career. Following area unit a number of the hottest job titles for Tableau professionals.
- Tableau advisor
- Data Analyst
- Business Analyst
- Business Intelligence Developer & Manager
e. Bright Future for Tableau
- In 2015, Tableau was named as a “Leader” within the knowledge visual image and business intelligence marketplace for the fourth consecutive time by Gartner analysis. Tableau is far and away the market leader with reference to its competitors if we have a tendency to compare its “Ability to execute”. Tableau is additionally a robust rival if you concentrate on the “Completeness of Vision”. It simply goes to point out that the long run of Tableau is extremely bright and secure.
4. Tableau Career Chance
- In the field of Business Intelligence, Tableau is rising collectively of the most popular trends. The demand for professionals with Tableau expertise is on the increase because the knowledge visual image tool is gaining a lot of quality in corporations of all stature, massive or little. Even Google trends indicate a high demand for Tableau career, particularly if you propose to create your career in knowledge visual image.
- Obtaining yourself certified throughout the high demand can assist you a profit of Tableau career opportunity and progress within the field of business intelligence.
5. Tableau Scope in an Asian Country
- The soaring demand for Tableau isn’t fast, there’s a logic behind it. We have a tendency to area unit presently generating nice amounts of information, nearly fifty times quite what was being generated, say 8-9 years alone. With the stupendous amounts of information, besides real business implications. Business organizations across the globe would wish a tool that’s straightforward on the user finish and might analyze knowledge by account unjust insights from it. Currently, the wonder is that there are a unit different visual image tools out there.
- However, Tableau will precisely that, straightforward to use, with a glorious visual image. Therefore the large quality. In line with a search by Gartner, the recognition of tableau goes to hit the roof, conjointly Google trends area unit testimony to the expansion in demand for tableau professionals, particularly over the past 5 years.
Advance Concepts in Tableau
Live vs Extract
- Remember the Live vs Extract I talked about earlier in this post? Let’s break it down,
- Live is when you use data directly from your data source such as Excel. In Extract, your data is imported into Tableau and stored in its own format to speed up report generation and visualization. In addition, you have the option of selecting specific data that you need for a particular task in Extract mode.
Hierarchy
- Hierarchy is the same as its original meaning. This feature comes in handy when you are working with geographical data. For instance, you have to add Country, Region, and Sub-region, which is a hierarchy. So, what you do is, you add all 3 to one single parent sheet and whenever you want to use all three of that, just drag single parent sheet and all three will be imported to your work-space.
Calculations
- Calculation is a simple way of combining two data sheets into one. For example, you have two sheets, First Name and Last Name, and you want to join both, that’s where you use calculations. However, it is much more than that and can perform more complex calculations.
Tableau Server
- If you work in an organization and you work in a team, and say, your teammate starts working from where you stop. So, he/she doesn’t have to perform all the tasks from the beginning, you upload this on Tableau server of your organization and provide a link to your colleague so that he/she can start working from where you left.
CONCLUSION
- We have tried to cover all the basic and some advanced elements to get you started with Tableau.
- While understanding Tableau, you should also be aware of Data Blending. Over the years, Data Blending in Tableau has gained immense popularity amongst the Data Analysts & has the potential of blending and joining data sources.
- Now as they all say, Practice makes a man perfect, you need to practice this thing on your own to master the skills. If you are done with the beginner’s part, there are some excellent Tableau tutorial YouTube and if you are a visual learner you may find Tableau tutorials PPTs on platforms such as Slideshare.
- If you are looking forward to building a career in Tableau, you should be aware of all the latest trends happening in the Tableau domain along with knowing how to create a perfect Tableau Resume and also have a clear idea of Tableau Certifications.


