
Last updated on 26th Sep 2025| 9901
- Introduction to MATLAB
- History and Evolution
- MATLAB Environment and Interface
- MATLAB Variables and Data Types
- Script and Function Files (.m)
- Vectorization Techniques
- Plotting and Data Visualization
- Simulink Overview
- Applications in Engineering and Research
- Conclusion
What is MATLAB?
MATLAB, short for MATrix LABoratory, is a high-level programming language and interactive environment widely used for numerical computation, data analysis, algorithm development, and visualization. Initially designed for matrix operations, MATLAB has evolved into a powerful tool used across engineering, science, and research domains. It offers both a programming language and an integrated development environment (IDE) that enables users to perform complex calculations, create sophisticated visualizations, and design algorithms efficiently. To apply these capabilities in real-world analytics, exploring Data Science Training reveals how statistical modeling, machine learning, and data visualization techniques empower professionals to extract insights and drive decisions across industries. MATLAB’s strength lies in its ability to handle large datasets, execute complex mathematical operations quickly, and integrate with other programming languages such as C, C++, Java, and Python.
Do You Want to Learn More About Data Scientists? Get Info From Our Data Science Course Training Today!
Introduction to MATLAB
MATLAB is not just a programming language, it is an ecosystem that combines computation, visualization, and programming in an easy-to-use environment. Unlike traditional programming languages that require extensive syntax for mathematical operations, MATLAB allows concise, readable commands that are mathematically intuitive. For example, matrix operations can be executed with a single line of code, which is a significant advantage for engineers and scientists. To explore a similarly expressive yet versatile language, What is Python Programming reveals how Python’s clean syntax, vast libraries, and cross-domain applicability make it a favorite for data analysis, automation, and scientific computing. Additionally, MATLAB provides built-in toolboxes for specialized applications, making it a versatile solution for multidisciplinary projects. Its scripting capabilities allow automation of repetitive tasks, while its graphical interface supports interactive exploration of data and models.
History and Evolution
MATLAB is not just a programming language, it is an ecosystem that combines computation, visualization, and programming in an easy-to-use environment. Unlike traditional programming languages that require extensive syntax for mathematical operations, MATLAB allows concise, readable commands that are mathematically intuitive. For example, matrix operations can be executed with a single line of code, which is a significant advantage for engineers and scientists. To explore similar simplicity in data handling, Need To Know About Python List reveals how Python lists offer flexible, dynamic structures for storing, accessing, and manipulating data making them ideal for both beginners and advanced programmers. Additionally, MATLAB provides built-in toolboxes for specialized applications, making it a versatile solution for multidisciplinary projects. Its scripting capabilities allow automation of repetitive tasks, while its graphical interface supports interactive exploration of data and models.
MATLAB Environment and Interface
When you open MATLAB, you are greeted with a user-friendly environment designed to enhance productivity. The primary components of the MATLAB interface include: To understand how such tools fit into broader development workflows, exploring What Is a Software Developer reveals how professionals use IDEs, version control, and debugging environments to build, test, and deploy scalable applications across industries.
- Command Window: Where you type and execute commands interactively.
- Workspace: Displays all active variables and their values during a session.
- Command History: Keeps a record of executed commands for easy reuse.
- Editor: Used for writing and debugging scripts (.m files) and functions.
- Current Folder: Shows files in the working directory, making file navigation simple.
- Figure Window: Displays graphical outputs such as plots and charts.
The MATLAB environment also provides docking options, customized layouts, and integration with version control systems. This design ensures that both beginners and advanced users can work efficiently without being overwhelmed by unnecessary complexity.
Would You Like to Know More About Data Science? Sign Up For Our Data Science Course Training Now!
MATLAB Variables and Data Types
MATLAB Variables are dynamically typed, meaning you don’t need to declare a variable’s type explicitly, it is determined by the assigned value. MATLAB supports various data types, including: To compare how modern programming languages handle type systems and data flexibility, exploring Kotlin vs Java reveals how Kotlin’s type inference and null safety contrast with Java’s explicit declarations offering insights into productivity, readability, and runtime reliability.
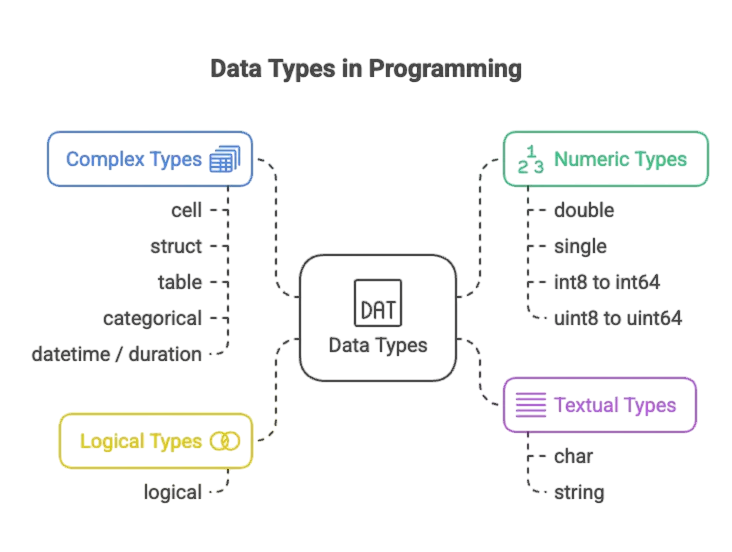
- Numeric Types (double, single, integer types): Doubles are the default numeric type.
- Character and String Arrays: Used for text manipulation.
- Logical Values: Represented as true or false.
- Cell Arrays: Containers for heterogeneous data types.
- Structures: For grouping related data under field names.
- Tables and Timetables: Useful for organizing and processing tabular data.
MATLAB Variables ability to handle matrices and arrays as first-class objects makes it ideal for linear algebra and numerical analysis. Indexing in MATLAB starts at 1, unlike many languages where it starts at 0.

Script and Function Files (.m)
MATLAB programs are stored in M-files with the .m extension. There are two main types: To understand how modular design principles apply across languages, exploring What is Abstraction in Java reveals how hiding implementation details and exposing only essential features helps developers build scalable, maintainable, and reusable code structures in object-oriented systems.
- Scripts: These are sequences of MATLAB commands saved in a file. They operate on variables in the base workspace and are often used for automating tasks.
- Functions: These are self-contained programs with their own workspace. They accept input arguments and return outputs, making them reusable and modular.
A script might simply process a dataset and generate a plot, while a function might implement a specific algorithm like numerical integration or filtering. Functions in MATLAB can be local (within a script) or stored in separate files for broader use.
Vectorization Techniques
One of MATLAB’s core strengths is vectorization, the practice of replacing loops with array operations. This approach improves performance because MATLAB is optimized for operations on arrays and matrices. For example, instead of using a for loop to add two arrays element-wise, you can simply write: C = A + B; Vectorization not only speeds up execution but also leads to cleaner and more readable code. To apply such performance-enhancing techniques in real-world analytics, exploring Data Science Training reveals how tools like NumPy and Pandas leverage vectorized operations to process large datasets efficiently empowering professionals to build scalable, high-impact solutions. Many built-in functions such as sum, mean, max, and dot are vectorized, making MATLAB ideal for handling large datasets efficiently.
Plotting and Data Visualization
MATLAB excels in data visualization, offering a wide range of functions for plotting and customizing graphs. Some common plotting functions include: To understand how visual data connects to underlying logic, exploring Important Data Structures and Algorithms reveals how stacks, queues, trees, and sorting techniques form the backbone of efficient data handling enabling developers to build responsive, scalable, and visually insightful applications.
- plot(): For 2D line plots.
- scatter(): For scatter plots.
- bar(): For bar charts.
- surf() and mesh(): For 3D surface plots.
- imshow(): For displaying images.
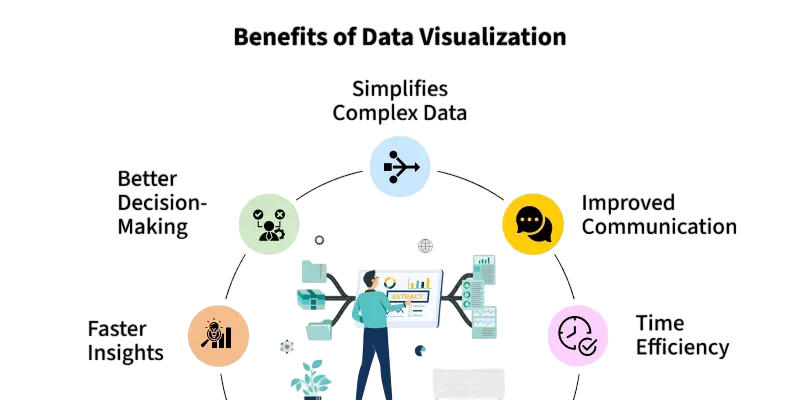
Advanced customization options allow you to modify titles, axis labels, legends, colors, and line styles. MATLAB also supports interactive plotting, enabling you to zoom, rotate, and inspect data visually. Visualization is crucial for understanding trends, validating models, and communicating results effectively.
Preparing for Data Science Job? Have a Look at Our Blog on Data Science Interview Questions & Answer To Ace Your Interview!
Simulink Overview
Simulink is an add-on product for MATLAB that provides a graphical environment for modeling, simulating, and analyzing dynamic systems. Instead of writing code, you create models by connecting blocks that represent mathematical operations, system components, or control elements. Simulink is widely used in control systems, signal processing, communications, and embedded systems. Its features include:
- Multi-domain modeling (electrical, mechanical, thermal, etc.).
- Real-time simulation and testing.
- Automatic code generation for embedded systems.
Simulink’s drag-and-drop interface makes it accessible even to those with limited programming experience, while still being powerful enough for complex system design. To compare how different languages support such visual and modular workflows, exploring Go vs Python reveals how Python’s simplicity and vast ecosystem contrast with Go’s concurrency model and performance helping developers choose the right tool for scalable, maintainable system development.
Applications in Engineering and Research
MATLAB’s versatility has made it indispensable in numerous fields: To understand how such powerful tools integrate with external systems, exploring Soap vs Rest reveals how these two web service protocols differ in structure, flexibility, and performance helping developers choose the right approach for connecting MATLAB with cloud platforms, APIs, and enterprise applications.
- Engineering: Circuit design, mechanical simulations, robotics, and control systems.
- Data Science: Data preprocessing, statistical analysis, and machine learning.
- Finance: Risk analysis, portfolio optimization, and time-series forecasting.
- Image and Signal Processing: Medical imaging, speech recognition, and pattern analysis.
- Academic Research: Rapid prototyping of algorithms and simulation models.
Its ability to integrate with hardware like Arduino, Raspberry Pi, and data acquisition systems further expands its practical applications.
Conclusion
MATLAB has stood the test of time as a reliable and efficient tool for numerical computation, data analysis, and visualization. Its combination of ease of use, powerful built-in functions, and specialized toolboxes makes it a go-to solution for engineers, researchers, and scientists worldwide. To apply these capabilities in real-world analytics and decision-making, exploring Data Science Training reveals how statistical techniques, machine learning models, and visualization tools empower professionals to extract insights and solve complex problems across industries. Whether you are modeling a dynamic system in Simulink, processing large datasets, or developing complex algorithms, MATLAB provides the tools and flexibility to turn ideas into reality.