What is Process Capability Analysis? – Learning Guide
Last updated on 15th Jul 2020, Blog, General
What is Process Capability?
Process capability measures how well the process performs to meet a given specified outcome. It indicates the conformance of a process to meet given requirements or specifications. Capability analysis helps to better understand the performance of the process with respect to meeting customer’s specifications and identify the process improvement opportunities.
Process Capability Analysis Steps
- Determine the metric or parameter to measure and analyze.
- Collect the historical data for the parameter of interest.
- Prove the process is statistically stable (i.e. in control).
- Calculate the process capability indices.
- Monitor the process and ensure it remains in control over time. Update the process capability indices if needed.
Process Capability Indices
Process capability can be presented using various indices depending on the nature of the process and the goal of the analysis. Popular process capability indices are:
- Cp
- Pp
- Cpk
- Ppk
- Cpm
The Cp index is process capability. It assumes the process mean is centered between the specification limits and essentially is the ratio of the distance between the specification limits to six process standard deviations. Obviously, the higher this value the better, because it means you can fit the process variation between the spec limits more easily. Cp measures the process’ potential capability to meet the two-sided specifications. It does not take the process average into consideration.
High Cp indicates the small spread of the process with respect to the spread of the customer specifications. Cp is recommended when the process is centered between the specification limits. Cp works when there are both upper and lower specification limits. The higher Cp the better, meaning the spread of the process is smaller relative to the spread of the specifications.
Note: Cpm can work only if there is a target value specified.
Use Minitab to Run a Process Capability Analysis
Steps in Minitab to run a process capability analysis:
- Click Stat → Basic Statistics → Normality Test.
- A new window named “Normality Test” pops up.
- Select “HtBk” as the variable.
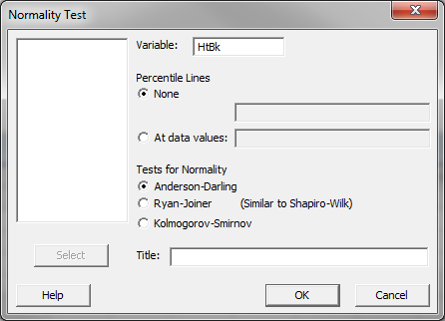
- Click “OK.”
- The histogram and the normality test results appear in the new window.
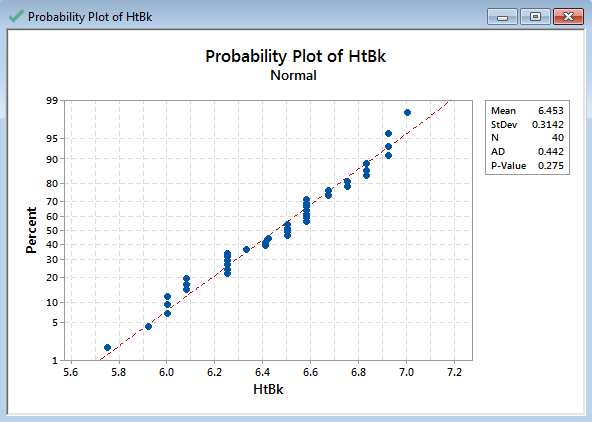
In this example, the p-value is 0.275, greater than the alpha level (0.05). We fail to reject the hypothesis and conclude that the data are normally distributed.
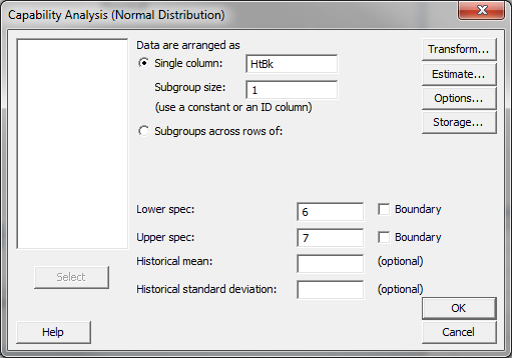
- Click Stat → Quality Tools → Capability Analysis→ Normal.
- A new window named “Capability Analysis(Normal Distribution)” pops up.
- Select “HtBk” as the single column and enter “1” as the subgroup size.
- Enter “6” as the “Lower spec” and “7” as the “Upper spec”

Best Business Analyst Training with UPDATED Syllabus By Industry Experts
- Instructor-led Sessions
- Real-life Case Studies
- Assignments
- Click the “Options” button and another new window named “Capability Analysis(Normal Distribution) – Options” pops up.
- Enter “6.5” as the target and click “OK.”
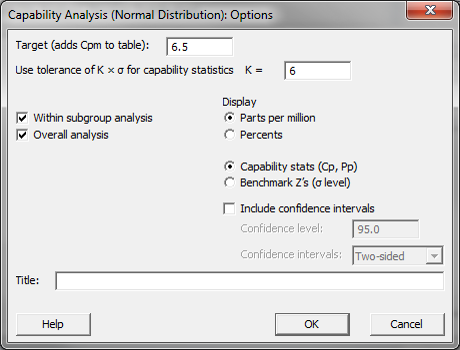
- Click “OK” in the “Capability Analysis(Normal Distribution)” window.
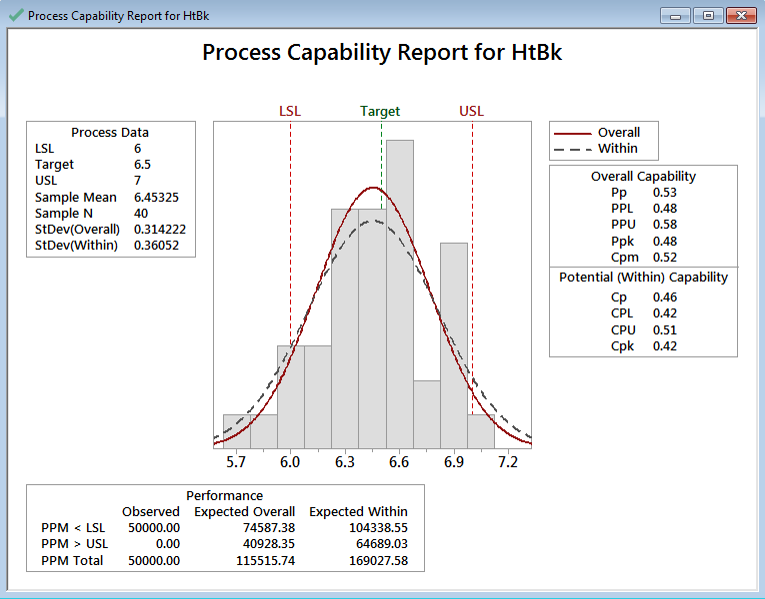
- The capability analysis results appear in the new window.
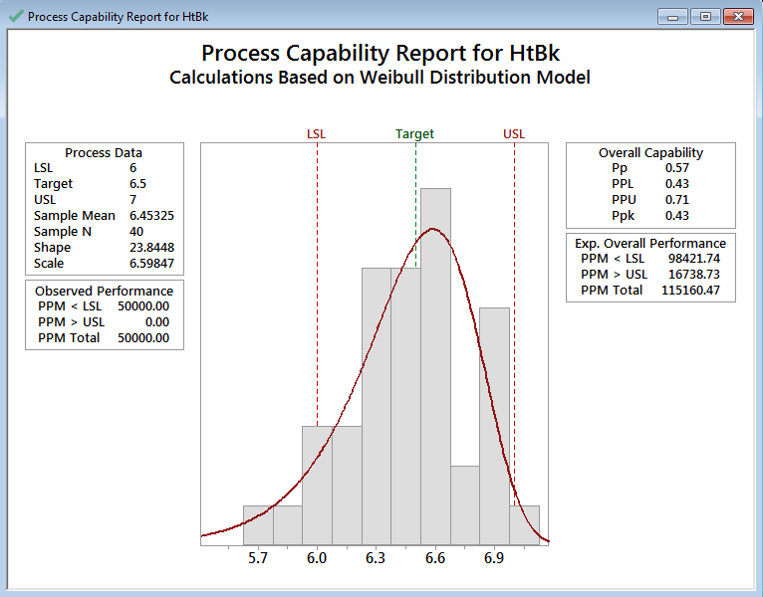
If the p-value of the previous normality test is smaller than the alpha level (0.05), we would reject the null hypothesis and conclude that the data are not normally distributed. Thus, we would perform a Non-Normal Capability analysis as follows:
- Click Stat → Quality Tools → Capability Analysis→ Non-Normal
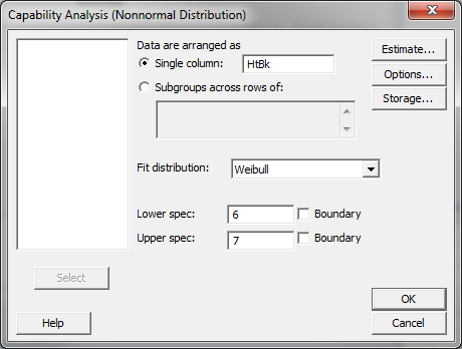
- A new window named “Capability Analysis(Non-Normal Distribution)” pops up.
- Select “HtBk” as the single column.
- Enter “6” as the “Lower spec” and “7” as the “Upper spec.”
- Click the “Options” button and another new window named “Capability Analysis(Non-Normal Distribution) – Options” pops up.
- Enter “6.5” as the target and click “OK.”
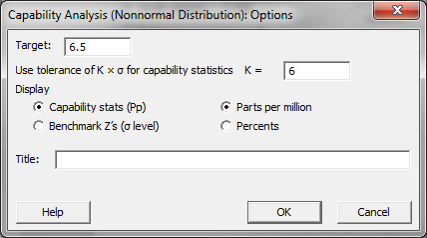
- Click “OK” in the “Capability Analysis(Non-Normal Distribution)” window.
- The capability analysis results appear in the new window.