Last updated on 20th Aug 2025| 13285
- Definition of Metric in Google Analytics
- Difference Between Metrics and Dimensions
- Types of Metric in Google Analytics
- Key Performance Indicators
- Real-Time vs Historical Metrics
- Custom Metrics
- How to Interpret Metrics
- Using Metrics in Reports
- Common Metric Examples
- Setting Goals with Metrics
- Conclusion
Definition of Metric in Google Analytics
In the world of digital analytics, a metric is a quantifiable measure used to track and assess the performance of a website or online marketing campaign. In Google Analytics, metrics are numerical data points that indicate how users interact with a website insights that are central to Digital Marketing Training. These metrics, such as sessions, bounce rate, and average session duration, help marketers evaluate performance, optimize strategies, and make data-driven decisions to enhance user experience and campaign effectiveness. They are essential for evaluating everything from traffic patterns and user behavior to conversion rates and marketing effectiveness. For instance, metrics such as “Sessions,” “Pageviews,” and “Bounce Rate” offer insights into how often people visit a site, how many pages they view, and how engaged they are with the content. Metrics in Google Analytics are the backbone of data analysis, enabling marketers, analysts, and business owners to make informed decisions. By examining various metrics, users can assess the health of their digital presence, identify areas for improvement, and optimize their strategies to enhance user experience and business outcomes. In analytics, a metric is a quantitative measurement that reflects user behavior on a website or application. It is always expressed in numbers, such as counts, percentages, or averages. Metrics help quantify performance, enabling data-driven decisions.
For example:
- Sessions: Number of times users visit a website.
- Users: Unique visitors during a given time period.
- Bounce Rate: Percentage of single-page sessions.
- Average Session Duration: The average length of time users spend on a website.
These metrics are collected automatically by Google Analytics using tracking codes embedded on a website. They form the foundation for most reports and dashboards in the platform.
Ready to Get Certified in Digital Marketing? Explore the Program Now Digital Marketing Online Training Offered By ACTE Right Now!
Difference Between Metrics and Dimensions
In Google Analytics, metrics and dimensions work together but represent different types of data. Metrics are quantitative, whereas dimensions are qualitative an essential distinction covered in Guide to On-Page SEO, where marketers learn to interpret numerical performance indicators like sessions and bounce rate (metrics) alongside contextual attributes such as device type, traffic source, and geographic location (dimensions). Understanding this relationship enables deeper analysis of user behavior and more precise SEO optimization.
- Metrics: Numbers (e.g., Sessions, Pageviews, Bounce Rate)
- Dimensions: Attributes of users or sessions (e.g., City, Browser, Device Type)
Example:
- Example:
- If you’re analyzing bounce rate by country:
- Dimension: Country
- Metric: Bounce Rate
Understanding the distinction between metrics and dimensions is crucial for effective reporting and analysis. Metrics answer the question “how many” or “how much,” while dimensions describe “who,” “what,” or “where.”
Types of Metric in Google Analytics
Metrics in Google Analytics can be categorized into several types analytical foundations explored in Career Paths for SEO Specialist, where professionals learn to interpret user behavior, acquisition channels, and conversion data while aligning analytics expertise with SEO roles such as Technical Analyst, Content Strategist, and Digital Marketing Manager.
Behavioral Metrics:
- Pageviews: Total number of pages viewed.
- Bounce Rate: % of sessions with only one pageview.
- Avg. Time on Page: Average time users spend on a page.
Acquisition Metrics:
- New Users: First-time visitors during the date range.
- Sessions: Visits to the website.
- Traffic Source: Breakdown of traffic origins (organic, paid, referral, etc.)
Engagement Metrics:
- Pages/Session: Number of pages viewed per session.
- Session Duration: How long users stay on the site.
Conversion Metrics:
- Goal Completions: Total number of times a goal is completed.
- Conversion Rate: % of sessions resulting in a goal.
- Transactions: Number of completed purchases (for e-commerce).
E-commerce Metrics:
- Revenue: Total income from purchases.
- Avg. Order Value: Average revenue per transaction.
- Product Performance: Sales by product or category.
- Conversion Rate for an e-commerce site.
- Average Time on Site for a content platform.
- Cost per Acquisition (CPA) for a paid ad campaign.
- Active Users
- Top Active Pages
- Top Referrals
- Top Keywords
- Monthly Sessions
- Year-over-Year Conversion Rates
- Bounce Rate trends
- Audience: (e.g., Users, Sessions)
- Acquisition: (e.g., Traffic Sources, Channels)
- Behavior: (e.g., Pageviews, Bounce Rate)
- Conversions: (e.g., Goals, Transactions)
- Traffic Sources
- Cost per Conversion
- Campaign Click-Through Rates (CTR)
- Users: Number of individual users.
- Sessions: Total number of visits.
- Pageviews: How many pages were viewed.
- Bounce Rate: % of sessions with one page only.
- Session Duration: How long users stay on site.
- Goal Completion: Total number of goal completions.
- Revenue: Total amount of sales.
- Transactions: Number of purchases.
- Cost per Acquisition (CPA): Amount spent to gain a customer.
- Click-Through Rate (CTR): % of users who clicked an ad.
To Explore Digital Marketing in Depth, Check Out Our Comprehensive Digital Marketing Online Training To Gain Insights From Our Experts!
Key Performance Indicators
KPIs are specific metrics tied to business objectives. Not all metrics are KPIs, but all KPIs are metrics. A good KPI aligns with the goals of the organization, such as increasing sales, improving user engagement, or reducing bounce rates.
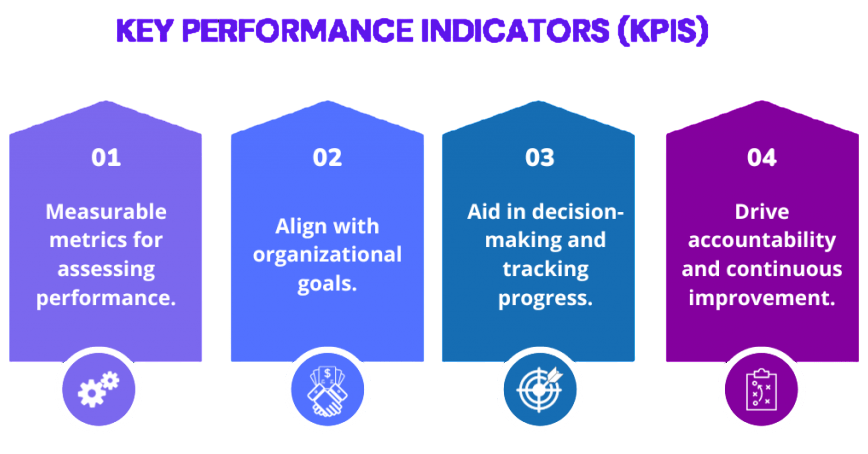
Examples of KPIs:
Selecting the right KPIs is critical for effective strategy tracking. Businesses should identify a few core KPIs that align directly with their objectives and focus on improving those over time.

Real-Time vs Historical Metrics
Google Analytics provides both real-time and historical metrics tracking capabilities that have evolved alongside the History & Evolution of Digital Marketing, where marketers explore the transformation from basic hit counters to advanced platforms like GA4, enabling deep analysis of user behavior, campaign performance, and long-term trends across digital ecosystems.
Real-Time Metrics: Show current user activity on your website. Examples include:
Historical Metrics: Based on data collected over time, used for trend analysis. Examples include:
Real-time metrics are helpful for monitoring campaigns, launches, or live events. Historical metrics are better for strategic planning and performance evaluations.
Looking to Digital Marketing Training? Discover the Digital Marketing Expert Masters Program Training Course Available at ACTE Now!
Custom Metrics
Custom metrics in Google Analytics provide businesses with a strong way to track data tailored to their operational needs. These user-defined metrics go beyond standard analytics and let organizations monitor key interactions that matter most to their goals an advanced capability emphasized in Digital Marketing Training, where professionals learn to configure custom tracking, align metrics with strategic objectives, and extract actionable insights that drive performance. For instance, companies can track the number of social shares on a page, count how often features are used, or measure internal interactions like form field completions. By changing the tracking code or using Google Tag Manager, businesses can set up these custom metrics to capture detailed user actions that standard analytics might miss. This flexibility helps organizations gain deeper insights into user behavior, which supports better decision-making and clearer digital strategies.
How to Interpret Metrics
Effectively interpret metrics requires a deep understanding of context and strategic analysis. What might first look like a negative sign, such as a high bounce rate on a blog, could actually mean that users quickly found the information they needed. Likewise, a long average session duration isn’t always good if it indicates user confusion or poor navigation an insight explored in Digital Transformation, where teams learn to interpret engagement metrics contextually, distinguish between meaningful interaction and friction, and refine UX design to ensure time spent reflects value, not frustration. To gain valuable insights, professionals should compare metrics to industry standards and past performance, observe trends over time, and use segmentation techniques like device or geographic breakdowns. Adding qualitative data from sources such as heatmaps and user feedback can further improve the analysis. Ultimately, metrics are most useful when they tell a clear story about user behavior and organizational performance, turning raw data into actionable insights.
Preparing for Digital Marketing Job Interviews? Have a Look at Our Blog on Digital Marketing Interview Questions and Answers To Ace Your Interview!
Using Metrics in Reports
Metrics are the core of most Google Analytics reports. Reports can be accessed in various sections—such as Acquisition, Behavior, and Conversions all of which support Understanding SERP in Digital Marketing, where marketers learn to correlate SERP visibility with traffic sources, user engagement, and goal completions. By aligning keyword performance with analytics insights, professionals can refine content strategy, improve rankings, and demonstrate ROI across digital channels.

Dashboards and custom reports allow users to tailor views based on their most relevant metrics. For example, a marketing dashboard might display:
Automated reports can be scheduled to share insights with stakeholders regularly.
Common Metric Examples
Setting Goals with Metrics
Technical SEO is an essential strategy for improving website performance and search engine visibility. By concentrating on key technical aspects, businesses can greatly improve their online presence and user experience. Site speed is vital, faster-loading pages enhance user engagement and improve search rankings technical priorities emphasized in Learn Digital Marketing, where learners explore how performance optimization, responsive design, and mobile-first strategies contribute to better SEO outcomes and improved user experience across devices. Mobile optimization is also important, ensuring smooth functionality across all devices. An XML sitemap helps search engines index your content efficiently, while a properly set up robots.txt file directs crawler access. Using structured data through schema markup can significantly improve search result listings, making your content more appealing and informative. Furthermore, implementing a secure HTTPS protocol builds user trust and indicates website credibility. These technical SEO practices work together to improve site health, ultimately supporting higher domain authority and creating a stronger online presence that both users and search engines value.
Conclusion
Metric in Google Analytics are vital for understanding website performance, user behavior, and business outcomes. Whether you’re tracking visitor counts, engagement levels, or conversion success, each metric provides a piece of the puzzle insights that come together through Digital Marketing Training, where professionals learn to interpret data holistically, optimize performance, and drive strategic outcomes across digital channels. By differentiating between metrics and dimensions, using standard and custom metrics wisely, and interpreting data in the right context, businesses can optimize their digital strategy effectively. Choosing the right KPIs, leveraging both real-time and historical data, and being wary of misleading metrics ensures that analytics efforts are both meaningful and actionable. As the digital landscape evolves, so too must our approach to analyzing the metrics that drive success.