Last updated on 11th Jun 2024| 7386
Leading software analytics provider New Relic offers in-the-moment information into the functionality of applications. Their platform facilitates the monitoring and optimization of software, infrastructure, and digital consumer experiences for developers, IT operations, and business executives. Through the provision of comprehensive metrics, diagnostics, and actionable insights, New Relic enables enterprises to improve user satisfaction, dependability, and performance throughout their digital environments.
1. What are the core components of New Relic?
Ans:
The core components of New Relic are New Relic APM (Application Performance Monitoring), New Relic Infrastructure, New Relic Synthetics, New Relic Browser, New Relic Mobile, New Relic Insights, New Relic Logs, and Distributed Tracing. New Relic APM provides insights into the performance and health of applications, while New Relic Infrastructure monitors servers, virtual machines, containers, and cloud services.
2. Explain what New Relic is and its primary functionality?
Ans:
New Relic is a comprehensive observability platform designed to help developers, IT operations, and business leaders monitor and enhance the performance of their applications and infrastructure. It offers real-time monitoring, troubleshooting, and analytics across various parts of the tech stack, including applications, infrastructure, logs, and user experiences.
3. How does New Relic APM assist in monitoring application performance?
Ans:
- New Relic APM assists in monitoring application performance by offering detailed, real-time insights into various performance metrics such as response times, throughput, error rates, and transaction traces.
- Error analytics provides detailed information on errors and exceptions, enabling quick diagnosis and resolution of issues.
- Database monitoring tracks the performance of database queries to identify slow queries and potential bottlenecks.
4. How does New Relic differ from other application performance monitoring tools?
Ans:
| Feature | New Relic | Other APM Tools |
|---|---|---|
| Comprehensive Observability | Integrates APM, infrastructure monitoring, log management, and RUM | Often focus on specific areas; may require multiple tools for full coverage |
| Real-Time Monitoring and Analytics | Provides real-time insights and powerful analytics engine | May have delays in data processing or less advanced analytics |
| Ease of Use and Deployment | User-friendly interface with quick setup and intuitive dashboards | Varies; some tools may have steeper learning curves or complex setups |
| AI and Machine Learning | Utilizes AI and ML for predictive insights and anomaly detection | AI and ML capabilities vary widely among different tools |
5. What steps are involved in installing New Relic on a server?
Ans:
- Sign up for or log in to New Relic account.
- Choose the New Relic agent that matches application environment and download it from the New Relic website.
- Follow the specific installation instructions for the agent, which usually involves adding the agent to application’s dependencies.
- Update application’s configuration with the New Relic license key and any necessary settings.
- Restart or redeploy application to activate the New Relic agent.
- Check the New Relic dashboard to ensure that data is being collected and reported correctly.
6. What are New Relic Agents and their role?
Ans:
New Relic Agents are software components that install within application environment to collect performance data and send it to the New Relic platform. Their role is to monitor application performance by gathering data on various metrics such as response times, error rates, and throughput. They automatically instrument application code to track the performance of transactions, database queries, and external calls.
7. How to set up monitoring for a Java application with New Relic?
Ans:
- Start by signing up for or logging into New Relic account.
- Download the New Relic Java agent from the New Relic website and place the Java agent JAR file in application’s classpath.
- Create or update the `newrelic.yml` configuration file with New Relic license key and any desired settings.
- Modify Java application’s startup script to include the Java agent by adding `-javaagent:/path/to/newrelic.jar` to the JVM options.
- Restart the Java application to start collecting performance data.
8. What types of metrics does New Relic APM collect?
Ans:
New Relic APM collects a variety of metrics, including response times, which measure the time taken for transactions to complete, and throughput, which tracks the number of transactions processed over time. It monitors error rates, shows the rate of errors occurring in the application, and evaluates user satisfaction with Apdex scores based on response times. It provides insights into resource utilization, helping teams identify performance bottlenecks and optimize application efficiency.
9. How can New Relic be utilized to monitor database performance?
Ans:
New Relic can monitor database performance by tracking query execution times and highlighting slow queries that may cause performance bottlenecks. It reports the number of database queries processed over time and provides insights into the types and frequency of database operations, such as SELECT, INSERT, UPDATE, and DELETE commands.
10. What are custom metrics in New Relic, and how to create them?
Ans:
- Custom metrics in New Relic are user-defined that track specific performance relevant to application.
- To create custom metrics, first determine the particular data point want to track.
- Use New Relic’s API or language-specific SDKs to create and send custom metrics from application code.
- Instrument the code to collect the desired data and send it to New Relic using the provided methods.
- Once collected, access and visualize custom metrics in New Relic Insights or through custom dashboards.
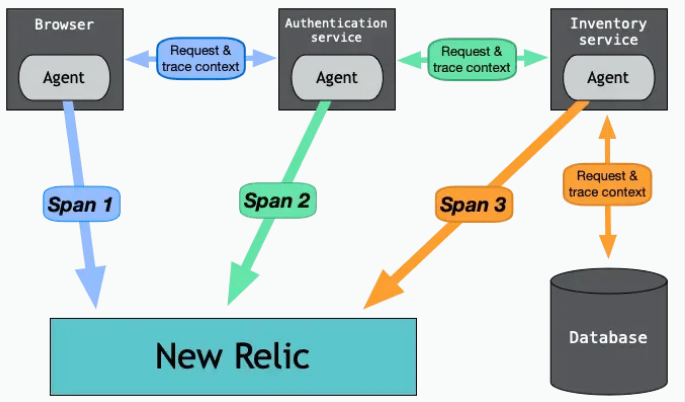
11. How does New Relic implement distributed tracing?
Ans:
- New Relic implements distributed tracing by capturing and linking trace data across different services in a microservices architecture.
- This provides a detailed view of the entire transaction flow, including the duration, errors, and timing of each segment.
- By tracking requests through each service, New Relic helps identify bottlenecks, latency issues, and service dependencies, enabling troubleshooting and performance optimization.
12. What is the New Relic One platform?
Ans:
New Relic One is an all-encompassing observability platform that integrates monitoring and management tools for applications, infrastructure, and digital experiences into a single interface. It combines various New Relic products, such as APM, Infrastructure, Logs, and more, offering advanced features like AI-driven insights, customizable dashboards, and powerful analytics. This unified platform allows users to gain a comprehensive view of their tech stack, improve collaboration, and make informed, data-driven decisions.
13. How can New Relic help identify memory leaks in an application?
Ans:
New Relic assists in identifying memory leaks by monitoring memory usage patterns over time, providing insights into memory allocation, garbage collection, and object creation rates. By analyzing trends and detecting anomalies in memory consumption, New Relic can alert users to potential memory leaks. Its transaction tracing and profiling features help pinpoint specific methods or operations responsible for excessive memory use, aiding in the diagnosis and resolution of memory leaks.
14. Describe New Relic’s alerting system?
Ans:
New Relic’s alerting system allows users to set and manage alerts based on specific performance thresholds or conditions. It supports various types of alerts, including those for error rates, response times, throughput, and custom metrics. Users can create alert policies that define the conditions for triggering alerts, specify notification channels (such as email, SMS, Slack), and configure escalation policies.
15. How to configure alert policies in New Relic?
Ans:
- Go to the Alerts & AI section of the New Relic dashboard.
- Create a new alert policy or choose an existing one.
- Define the alert conditions by selecting the metric type and setting threshold values.
- Specify notification channels for alert delivery, such as email, SMS, or integrations like Slack.
- Optionally, set up incident preferences and escalation policies.
- Save the alert policy and monitor it to ensure it triggers based on the defined conditions.
16. What is the process for creating a dashboard in New Relic Insights?
Ans:
- Log in and navigate to the Dashboards section.
- Click “Create a dashboard” and name it.
- Can add widgets by clicking “Add a new widget” and choosing from charts, tables, or other visualizations.
- Define data queries for each widget using NRQL to specify the metrics and conditions to visualize.
- Arrange the widgets on the dashboard layout as desired.
- Save the dashboard and share it with team members to facilitate collaborative monitoring and analysis.
17. How can New Relic Logs be used to troubleshoot application issues?
Ans:
New Relic Logs helps troubleshoot application issues by aggregating and analyzing log data from various sources. Users can search and filter logs in real time to identify specific errors, patterns, or anomalies. The integration with New Relic’s APM and other services provides context and correlation between logs and performance metrics. By visualizing log data, setting alerts for specific log events, and using log analytics, users can quickly diagnose and resolve issues, understand root causes, and improve application reliability.
18. What does New Relic Infrastructure monitor?
Ans:
New Relic Infrastructure monitors the health and performance of servers, virtual machines, containers, and cloud services. It provides real-time data on CPU usage, memory usage, disk I/O, network traffic, and more. It offers insights into infrastructure dependencies, configuration changes, and events. This monitoring helps detect and resolve infrastructure-related issues, optimize resource usage, and ensure the environment supports the performance and availability needs of applications.
19. How does New Relic integrate with Kubernetes for monitoring?
Ans:
- New Relic integrates with Kubernetes using its Kubernetes integration, which collects metrics, events, and metadata from Kubernetes clusters.
- This provides insights into the performance and health of Kubernetes nodes, pods, containers, and services.
- The integration offers visualizations and dashboards to monitor resource utilization, pod status, and cluster performance.
- New Relic’s distributed tracing and log management features help troubleshoot and optimize applications running in Kubernetes environments.
20. How does New Relic monitor frontend performance?
Ans:
New Relic monitors frontend performance through its Browser product, which tracks real-user interactions and provides insights into the user experience of web applications. It measures key performance indicators such as page load times, JavaScript errors, and user interaction timings. New Relic Browser also offers session traces, detailing users’ journeys through the application and highlighting performance bottlenecks and errors.
21. How to set up synthetic monitoring in New Relic?
Ans:
- Log in to account and navigate to the Synthetics section.
- Click “Create a monitor” and choose the type of monitor need, such as ping, simple browser, scripted browser, or API test.
- Can configure the monitor by entering the URL or endpoint to be tested, setting the check frequency, and selecting the locations for testing.
- Customize settings like validation scripts or alert conditions as needed.
- Save the monitor to start proactive testing, ensuring web applications’ availability and performance.
22. What is the significance of Apdex scores in New Relic?
Ans:
Apdex scores in New Relic provide a standardized measure of user satisfaction with application performance. Apdex, or Application Performance Index, categorizes response times into three groups: satisfactory, tolerating, and frustrating, based on predefined thresholds. The score ranges from 0 to 1, with higher scores indicating better user satisfaction. Monitoring Apdex scores helps developers and IT teams prioritize performance improvements to enhance user experience.
23. How can New Relic be used to monitor serverless applications?
Ans:
New Relic can monitor serverless applications by integrating with platforms like AWS Lambda, Azure Functions, and Google Cloud Functions. Using the New Relic Lambda layer or other integration methods, performance data such as invocation counts, durations, error rates, and cold start times are collected. New Relic provides detailed insights into the execution of serverless functions, helping to identify performance bottlenecks, troubleshoot errors, and optimize performance.
24. What is NRQL, and how is it utilized?
Ans:
NRQL, or New Relic Query Language, is a SQL-like language used to query data within New Relic. It allows users to create custom queries to analyze and visualize application and infrastructure data. NRQL is used to extract specific metrics, generate custom charts, and create dynamic dashboards in New Relic Insights. By writing NRQL queries, users can filter, aggregate, and perform calculations on their data, providing powerful insights and enabling data-driven decisions.
25. What does the “Deployments” feature in New Relic do?
Ans:
- The “Deployments” feature in New Relic tracks and visualizes application deployments, showing how code changes affect performance.
- New Relic correlates these deployments with performance data, allowing users to see if issues or improvements are related to specific implementations.
- This helps quickly identify problematic releases and understand the impact of code changes on application performance.
26. How does New Relic handle the monitoring of microservices?
Ans:
- New Relic monitors microservices using tools for distributed tracing, service maps, and detailed performance metrics.
- Distributed tracing follows requests across microservices, identifying latency and performance issues.
- Service maps visualize interactions and dependencies between microservices, helping to understand the architecture and pinpoint failures.
- New Relic APM provides granular metrics for each microservice, including response times, error rates, and throughput, enabling efficient monitoring and optimization of microservices-based applications.
27. What does the New Relic Browser track?
Ans:
New Relic Browser tracks frontend performance metrics and user interactions for web applications. It monitors key performance indicators like page load times, JavaScript errors, AJAX requests, and user session traces. New Relic Browser provides insights into individual page element performance, the impact of third-party resources, and the geographic distribution of users.
28. How can New Relic identify slow database queries?
Ans:
New Relic identifies slow database queries by monitoring metrics such as response times, throughput, and error rates. It provides detailed transaction traces highlighting slow database operations, showing exact SQL queries and their execution times. New Relic APM offers insights into query frequency and duration, allowing users to pinpoint and optimize slow queries. Database monitoring dashboards visualize performance trends and enable alerts for performance issues.
29. What are the advantages of using New Relic’s mobile monitoring?
Ans:
- New Relic’s mobile monitoring offers detailed insights into mobile application performance and stability.
- It tracks metrics such as app launch times, network request performance, crash rates, and user interactions.
- Mobile monitoring helps identify and troubleshoot performance issues, optimize network usage, and improve app stability.
- It also provides user experience metrics like Apdex scores and session traces, enabling developers to enhance user satisfaction and overall app performance.
30. How does New Relic integrate with third-party tools?
Ans:
- New Relic integrates with a wide range of third-party tools, enhancing its monitoring capabilities and workflow automation.
- It supports integrations with popular DevOps, incident management, and collaboration tools like Slack, PagerDuty, Jenkins, and Jira, facilitating seamless alerting, incident response, and data sharing.
- New Relic also integrates with cloud providers, container orchestration platforms, and logging tools, providing a unified view of the tech stack.
- Additionally, the New Relic REST API allows for custom integrations and automation, tailoring the platform to specific needs.
31. How to use New Relic to troubleshoot a performance degradation issue?
Ans:
To troubleshoot performance degradation with New Relic, I’d start by analyzing relevant metrics in the APM dashboard. This includes examining response times, error rates, throughput, and other key performance indicators. Using transaction traces, I’d pinpoint slow transactions and delve into their components to identify bottlenecks. Additionally, I’d utilize New Relic Infrastructure to monitor server health and resource utilization.
32. Describe a time when New Relic helped identify a critical issue?
Ans:
Indeed, New Relic has been crucial in pinpointing critical issues in our application infrastructure. For example, during a sudden spike in error rates and degraded performance in peak traffic hours, New Relic APM quickly pointed us to a specific microservice with high response times and elevated error rates. Transaction traces revealed an inefficient SQL query as the bottleneck. Armed with this insight, optimized the query, leading to a significant improvement in application performance and averting potential downtime.
33. How to set up New Relic to monitor a multi-cloud environment?
Ans:
- To monitor a multi-cloud environment with New Relic, I’d first deploy the New Relic Infrastructure agent to all servers, VMs, and containers across different cloud providers.
- Additionally, I’d integrate New Relic with cloud-native monitoring services provided by each cloud provider, such as AWS CloudWatch or Azure Monitor.
- This comprehensive integration would provide visibility into the entire infrastructure stack, allowing seamless monitoring and optimization across multiple clouds.
34. How can New Relic be used to optimize application performance?
Ans:
New Relic optimizes application performance by providing insights into various aspects of the application stack. Using New Relic APM, developers can pinpoint performance bottlenecks in code, database queries, and external service calls. Transaction traces and distributed tracing help uncover latency issues across microservices architectures. New Relic Browser tracks frontend performance and user interactions, facilitating optimization of page load times and user experience.
35. Describe the steps taken to set up monitoring for a new application with New Relic.
Ans:
- Sign up or log in to New Relic.
- Choose the appropriate New Relic agent based on the application’s technology stack.
- Install the agent on the application server or container.
- Configure the agent with the New Relic license key and other necessary settings.
- Restart the application server to start collecting performance data.
36. How to handle false positives in New Relic alerts?
Ans:
To handle false positives in New Relic alerts, I’d review alert conditions and thresholds to ensure accuracy. If false positives occur, will investigate the root cause by analyzing relevant metrics and logs. Adjusting alert conditions, such as increasing thresholds or adding criteria, could help reduce false positives. Additionally, collaboration with development and operations teams to understand recent changes or deployments is vital.
37. How New Relic’s monitoring helped prevent a major outage?
Ans:
Absolutely. New Relic’s monitoring capabilities have prevented major outages in our environment. Once, detected a sudden increase in error rates and latency in production. Using New Relic APM, swiftly identified a memory leak in a critical microservice. Prompt action was taken, preventing the service from becoming unresponsive and avoiding potential downtime.
38. How can New Relic assist with capacity planning?
Ans:
- New Relic assists with capacity planning by providing insights into resource utilization, performance trends, and application demand.
- Monitoring metrics like CPU usage and throughput helps identify usage patterns and forecast future resource requirements.
- Historical data analysis and predictive analytics forecast potential performance bottlenecks, optimizing resource allocation for optimal application performance and cost efficiency.
39. How would one integrate New Relic with a CI/CD pipeline?
Ans:
- To integrate New Relic with a CI/CD pipeline, I’d use New Relic’s APIs and integrations with CI/CD tools like Jenkins or GitLab.
- The CI/CD pipeline would trigger deployment notifications to New Relic’s “Deployments” feature, tagging each deployment.
- This correlation with performance data helps identify performance impacts caused by code changes.
- Additionally, I’d leverage New Relic’s Insights API to query performance data and create custom dashboards within the CI/CD pipeline, providing visibility into application performance throughout the development lifecycle.
40. How to use New Relic to monitor the performance of APIs?
Ans:
To monitor API performance with New Relic, I’d instrument API code with New Relic agents or use its API monitoring capabilities. Configuring agents to collect metrics like response times and error rates helps identify slow or failing API calls. Transaction traces help pinpoint the root cause of performance issues. Additionally, New Relic Synthetics proactively monitors API endpoints by creating scripted API tests that simulate fundamental user interactions. Continuous monitoring and analysis ensure optimal API performance and reliability.

Get JOB New Relic Training for Beginners By MNC Experts
- Instructor-led Sessions
- Real-life Case Studies
- Assignments
41. How can New Relic help ensure adherence to service level agreements (SLAs)?
Ans:
New Relic aids in maintaining SLA compliance by continuously monitoring application performance and alerting teams when metrics deviate from agreed-upon thresholds. Custom alerts, based on SLA criteria like response times or uptime, proactively identify issues before they impact users. Detailed reporting and analytics provided by New Relic enable teams to track performance against SLA targets over time, effectively demonstrating compliance to stakeholders.
42. How to configure New Relic to monitor a legacy system?
Ans:
- To monitor a legacy system with New Relic, the monitoring approach depends on the system’s architecture and technology stack.
- Alternatively, would use New Relic’s Infrastructure agent to monitor system-level metrics such as CPU usage and memory utilization.
- Additionally, New Relic Synthetics can perform scripted tests simulating user interactions with the legacy system.
43. Describe where a complex issue was resolved using New Relic?
Ans:
- In a complex microservices architecture, encountered intermittent performance issues across multiple services.
- Using New Relic’s distributed tracing, traced request flows and identified a service with high latency and error rates.
- Transaction traces revealed excessive database queries as the bottleneck.
- Optimized the queries and scaled the database resources based on New Relic APM insights, successfully resolving the performance issues and restoring system stability.
44. How could New Relic be leveraged to elevate the user experience on a website?
Ans:
To enhance a website’s user experience, New Relic can focus on monitoring and optimizing key performance metrics that influence user satisfaction. By tracking metrics like page load times and JavaScript errors with the New Relic Browser, performance bottlenecks and areas for improvement can be identified. Additionally, New Relic Synthetics can continuously monitor website availability and functionality worldwide, ensuring a consistent and reliable user experience.
45. How can New Relic’s data assist in root cause analysis?
Ans:
New Relic’s data facilitates root cause analysis by providing comprehensive insights into application and infrastructure performance. By correlating metrics from New Relic APM, Infrastructure, and Browser, patterns, anomalies, and dependencies contributing to issues can be identified. Transaction traces and distributed tracing trace request flows, pinpointing where performance degradations occur.
46. How could New Relic be employed for monitoring IoT devices?
Ans:
- New Relic can monitor IoT devices by utilizing its Infrastructure agent to collect metrics from device gateways or edge servers.
- Metrics like device status and connectivity are collected, providing insights into device health and performance.
- By deploying the Infrastructure agent to these endpoints and setting up custom dashboards and alerts, key IoT device metrics can be monitored, and anomalies or performance issues can be detected in real time.
47. In what ways could New Relic be used to oversee network performance?
Ans:
New Relic’s Infrastructure agent can monitor network performance by collecting metrics related to network traffic, latency, and packet loss from network devices such as routers and switches. Correlating these metrics with application and infrastructure data can yield insights into network health and performance. Custom queries and visualizations in New Relic Insights enable monitoring of network performance trends, facilitating the identification of potential bottlenecks or issues affecting application performance.
48. What are the steps involved in transitioning monitoring solutions to New Relic?
Ans:
- Assessing the existing monitoring solution and identifying metrics, alerts, and dashboards for migration.
- Planning the migration scope, timeline, and required resources.
- Configuring New Relic agents or integrations to collect performance data.
- Migrating historical data to New Relic, if applicable.
- Testing monitoring configurations, alerts, and dashboards.
49. How does New Relic contribute to monitoring security incidents?
Ans:
New Relic aids in monitoring security incidents by providing visibility into application and infrastructure metrics that may indicate security vulnerabilities or breaches. Anomalies in application performance or unexpected changes in user behaviour may signal potential security incidents. Additionally, New Relic Logs can monitor suspicious activities or unauthorized access attempts in real time.
50. How to optimize New Relic’s data retention settings for cost efficiency?
Ans:
- Identify critical data.
- Set retention policies based on importance.
- Use data sampling.
- Aggregate data.
- Purge redundant data.
51. What is the interest in working for New Relic?
Ans:
The interest in working for New Relic stems from its reputation as a leader in application performance monitoring and observability solutions. The opportunity to work with cutting-edge technology and contribute to innovative projects is highly appealing. New Relic’s commitment to fostering a collaborative and inclusive work environment aligns with personal values. Being part of a team that helps businesses optimize their digital performance and enhance user experiences is both exciting and rewarding.
52. What to know about New Relic’s company culture?
Ans:
Through research and interactions with individuals familiar with New Relic, I’ve come to understand that the company cultivates a vibrant culture marked by collaboration, transparency, and continuous learning. New Relic values diversity of thought, encourages experimentation and fosters an environment where feedback is openly shared and ideas are respected regardless of hierarchy.
53. How does New Relic stand out in the APM market?
Ans:
- New Relic distinguishes itself in the APM market through its comprehensive suite of monitoring tools, real-time analytics, and AI-driven insights.
- Unlike conventional monitoring solutions, New Relic offers end-to-end visibility across the entire application stack, empowering organizations to identify and address performance issues swiftly.
- Its ability to correlate data from multiple sources and provide actionable insights sets it apart from competitors.
54. Describe a situation where users had to learn a new tool quickly.
Ans:
- In a previous role, encountered a scenario where had to rapidly acquire proficiency in a new debugging tool to resolve a critical issue in our application.
- Despite the initial unfamiliarity with the tool, embraced the challenge with determination and resourcefulness.
- Through online tutorials, documentation, and hands-on experimentation, swiftly gained competence in the tool.
- Collaborating with team members and leveraging available resources, identified the root cause of the issue and implemented an effective solution in a timely manner.
55. How to stay current with developments in application performance monitoring?
Ans:
To remain abreast of developments in application performance monitoring, employ a multifaceted approach that includes attending industry conferences, participating in webinars, and staying updated with relevant blogs and articles. Additionally, actively engage with professional communities on platforms such as LinkedIn and Stack Overflow to exchange ideas and insights with industry peers.
56. How to prioritize tasks when managing multiple projects?
Ans:
When managing multiple projects, prioritize tasks based on their impact, urgency, and dependencies. Begin by breaking down complex projects into smaller, manageable tasks and then assess their relative importance and deadlines. By identifying critical path tasks and allocating resources accordingly, ensure that key milestones are met and project timelines are adhered to.
57. Describe a challenging technical problem faced and resolved it.
Ans:
- In a challenging technical scenario, collaborated with team members to analyze the root cause, conducted thorough research, and experimented with various solutions.
- Despite encountering obstacles, remained resilient and resourceful, leveraging problem-solving skills to overcome challenges.
- Through persistence and creative thinking, ultimately identified a workaround and implemented a sustainable solution that effectively addressed the underlying issue.
58. How to learning new technologies?
Ans:
- Approach to learning new technologies involves self-study, hands-on experimentation, and seeking guidance from peers and mentors.
- Immerse in documentation, tutorials, and online courses to gain a solid understanding of fundamental concepts and principles.
- Subsequently, apply knowledge in real-world scenarios through hands-on projects, allowing me to reinforce learning and develop practical skills.
- Additionally, actively seek feedback and guidance from experienced professionals in the field, leveraging their expertise to accelerate learning and navigate challenges effectively.
59. Give an example of how users contributed to a team project.
Ans:
In a recent team project, made significant contributions by assuming responsibility for a critical component, conducting comprehensive testing, and optimizing performance. Collaborated closely with team members to define requirements, develop solutions, and address challenges collaboratively. Furthermore, facilitated communication and coordination among team members, ensuring alignment with project objectives and deadlines.
60. How to handle feedback and criticism?
Ans:
Regard feedback and criticism as invaluable opportunities for growth and improvement. Actively seek feedback from colleagues and stakeholders, attentively listening and reflecting on areas for development. By embracing a growth mindset and welcoming constructive criticism, leverage feedback as a catalyst for personal and professional advancement.

Develop Your Skills with New Relic Certification Training
Weekday / Weekend BatchesSee Batch Details61. Describe a time when had to troubleshoot a complex issue under pressure.
Ans:
- In a high-pressure scenario during a crucial project deployment, led a troubleshooting effort to resolve an unexpected error that threatened to disrupt operations.
- Collaborating with cross-functional teams, swiftly identified the root cause a compatibility issue between a newly deployed component and existing infrastructure.
- Under tight time constraints, devised and implemented a workaround, restoring system functionality just before the deadline.
- Despite the intensity of the situation, our collaborative approach and problem-solving skills ensured a successful outcome.
62. How to ensure the quality of work?
Ans:
- Adhere to established best practices, conduct thorough testing at every development stage, and actively seek feedback from peers and stakeholders.
- Additionally, continually strive for self-improvement by staying updated on industry standards and seeking opportunities to enhance skills.
- By upholding meticulous standards and a dedication to excellence, ensure that work consistently meets or exceeds expectations.
63. What motivates to excel in role?
Ans:
Motivation to excel in role stems from the opportunity to make a meaningful impact and contribute to the success of team and organization. Thrive on challenges that push me beyond comfort zone, providing opportunities for learning and growth. Additionally, the satisfaction of overcoming obstacles, delivering high-quality results, and witnessing tangible outcomes serves as a driving force for me to strive for excellence in all aspects of role.
64. How to manage time effectively?
Ans:
To effectively manage time, prioritize tasks based on their importance and urgency, utilizing techniques such as time blocking and prioritization matrices. Break down larger projects into smaller, manageable tasks and allocate dedicated time slots for each. Additionally, leverage productivity tools like calendars and task management apps to organize workflow and track progress.
65. Describe a situation where had to explain a technical concept to a non-technical audience.
Ans:
- In a previous role, was tasked with explaining a complex technical concept—encryption—to a non-technical audience during a client presentation.
- To ensure clarity, employed analogies and real-world examples to simplify the idea, emphasizing its significance in safeguarding sensitive data.
- Avoided technical jargon and terminology, focusing instead on conveying the core principles and benefits of encryption in a manner that resonated with the audience.
- By tailoring communication to their level of understanding, successfully conveyed the technical concept in a clear and accessible manner.
66. How to approach debugging and troubleshooting?
Ans:
- Approach to debugging and troubleshooting involves a systematic process of analysis, experimentation, and collaboration.
- Begin by gathering pertinent information and identifying potential root causes, then formulate hypotheses and conduct experiments to test each one systematically.
- Throughout this process, collaborate closely with team members, leveraging their expertise and insights to validate assumptions and explore alternative solutions.
- By adopting a systematic and collaborative approach to debugging and troubleshooting, effectively resolve complex issues and ensure system stability.
67. What is experience with Agile methodologies?
Ans:
Possess extensive experience working with Agile methodologies, including Scrum and Kanban. In Agile environments, embrace iterative development, frequent collaboration, and adaptability to changing requirements. Actively participate in Scrum ceremonies such as sprint planning, daily stand-ups, and sprint retrospectives, fostering transparency and accountability within the team.
68. How to handle conflicts within a team?
Ans:
When conflicts arise within a team, address them openly and constructively. Encourage transparent communication and active listening to understand the underlying issues and perspectives of all parties involved. Strive to find common ground and facilitate compromise, focusing on solutions rather than dwelling on differences. Additionally, foster a culture of mutual respect and empathy, ensuring that team members feel valued and supported in resolving conflicts collaboratively and maintaining a positive working environment.
69. Describe a time when went above and beyond for a project.
Ans:
- In a project with tight deadlines, volunteered to take on additional responsibilities beyond role to ensure its success.
- Proactively assisting team members with their tasks, conducting thorough testing, and providing guidance and support whenever needed were part of contributions.
- Furthermore, proposed innovative solutions to optimize workflow efficiency and meet project objectives within the given constraints.
- By going above and beyond assigned responsibilities, significantly contributed to the project’s success and earned recognition from both team members and stakeholders.
70. How to keep skills up-to-date with evolving technologies?
Ans:
- To keep skills up-to-date with evolving technologies, adopt a proactive approach to learning and professional development.
- Regularly attending industry conferences, participating in online courses and workshops, and engaging with relevant communities and forums allow me to stay informed about emerging trends and best practices.
- Additionally, actively seek opportunities to apply new technologies and methodologies in real-world projects, enabling me to gain practical experience and deepen expertise.
71. What are long-term career goals, and how does New Relic fit into them?
Ans:
The long-term career aspirations involve advancing within the technology sector, with a focus on leadership and innovation. Aim to leverage skills to drive positive change and contribute meaningfully to the industry. New Relic fits into career trajectory by providing an environment conducive to growth and innovation. Joining New Relic would afford me opportunities to develop skills further, expand knowledge base, and progress towards long-term career objectives.
72. How to handle tight deadlines and high-pressure situations?
Ans:
Managing tight deadlines and high-pressure situations requires effective time management, prioritization, and resilience. Approach these challenges by maintaining composure and identifying key priorities. Breaking down complex tasks into manageable steps and communicating openly with stakeholders help me stay organized and focused. Through proactive planning and collaboration, navigate tight deadlines and high-pressure scenarios efficiently.
73. Describe a project where used data to drive decision-making.
Ans:
- In a prior project, employed a data-driven approach to decision-making to enhance website performance and user experience.
- By analyzing user engagement metrics such as page load times and conversion rates, identified areas for improvement.
- Based on these insights, implemented targeted optimizations, such as caching strategies and code enhancements.
- Utilizing data to guide our decisions led to measurable improvements in website performance and user satisfaction.
74. How to ensure effective communication in a remote work environment?
Ans:
- Effective communication in a remote work setting requires leveraging technology and fostering a culture of transparency and collaboration.
- Ensure clear communication by utilizing various tools such as video conferencing and project management platforms.
- Establishing regular check-ins with team members facilitates updates and progress tracking.
- By promoting open dialogue and proactive communication, maintain effective collaboration and cohesion within remote teams.
75. What to think is the biggest challenge in application performance monitoring today?
Ans:
The primary challenge in application performance monitoring today lies in the complexity of modern application environments. With the adoption of microservices and cloud-native technologies, monitoring performance across distributed infrastructures has become increasingly complex. Additionally, the volume and velocity of data generated by these environments pose challenges for analysis and interpretation.
76. Explain the architecture of New Relic’s data collection and processing?
Ans:
New Relic’s data collection and processing architecture involves deploying lightweight agents within the application stack to collect performance data. This data is transmitted to New Relic’s cloud platform for processing and analysis. Leveraging distributed data processing and storage technologies, New Relic extracts insights from the data to optimize application performance. Machine learning algorithms play a crucial role in identifying patterns and anomalies, enabling proactive performance management.
77. How does New Relic handle large-scale data ingestion?
Ans:
New Relic manages large-scale data ingestion through its cloud platform, utilizing distributed processing and storage technologies. Techniques such as data sharding and replication ensure scalability and reliability. By leveraging cloud infrastructure and advanced data processing capabilities, New Relic efficiently handles the challenges associated with ingesting large volumes of performance data.
78. What security measures does New Relic use to protect data?
Ans:
- New Relic implements robust security measures to safeguard data, including encryption, access controls, and regular security audits.
- Compliance with industry standards such as GDPR and SOC 2 further ensures data protection and privacy.
- By prioritizing security and adhering to best practices, New Relic maintains the trust and confidence of its customers.
79. How to design a custom monitoring solution using New Relic’s APIs?
Ans:
- Designing a custom monitoring solution using New Relic’s APIs involves leveraging the platform’s rich set of APIs to access and manipulate performance data.
- Developers can programmatically retrieve data, configure alerts, and create custom dashboards tailored to specific requirements.
- By harnessing New Relic’s APIs, developers can design flexible and customizable monitoring solutions aligned with their unique use cases.
80. What role does machine learning play in New Relic’s analytics?
Ans:
Machine learning plays a pivotal role in New Relic’s analytics by enabling advanced insights and anomaly detection in performance data. New Relic utilizes machine learning algorithms to analyze data patterns and trends, providing predictive analytics and intelligent recommendations. Continuously learning and adapting, these algorithms enhance the effectiveness and accuracy of New Relic’s analytics capabilities, empowering organizations to manage and optimize their applications proactively.
81. How does New Relic’s pricing model work?
Ans:
New Relic operates on a subscription-based pricing model, offering various tiers and plans tailored to organizations’ needs. The pricing structure considers factors like the number of monitored hosts or instances, included features, and support levels. Additionally, New Relic offers flexibility with pay-as-you-go and annual subscription options, allowing organizations to scale monitoring according to their requirements.
82. What are the benefits and limitations of New Relic’s distributed tracing?
Ans:
- Distributed tracing offered by New Relic provides end-to-end visibility into complex, distributed systems, aiding in pinpointing performance bottlenecks and enhancing system efficiency.
- By tracing requests across multiple services and components, New Relic facilitates root cause analysis and troubleshooting, resulting in reduced mean time to resolution for performance issues.
- However, distributed tracing may encounter limitations in environments with high network latency or spanning disparate systems with varying instrumentation capabilities.
83. How to implement real-time monitoring using New Relic?
Ans:
- Implementing real-time monitoring with New Relic involves deploying agents or instrumentation libraries within the application stack to collect performance data.
- This data is then utilized to configure alerts and dashboards for monitoring key metrics and receiving real-time notifications of performance issues.
- New Relic also offers features such as anomaly detection and predictive analytics to identify and address potential problems before user impact proactively.
- Leveraging New Relic’s real-time monitoring capabilities ensures optimal application performance and reliability.
84. How can tags and metadata be used in New Relic for better data organization?
Ans:
Tags and metadata within New Relic help organize data effectively by categorizing and labelling performance data based on specific attributes or characteristics. By assigning tags to hosts, applications, or transactions, organizations can classify them according to environment, application type, or business unit. Utilizing tags and metadata streamlines data organization, searchability, and analysis within New Relic, leading to more efficient performance monitoring and troubleshooting.
85. How does New Relic support DevOps practices?
Ans:
New Relic supports DevOps practices by offering tools and features that promote collaboration, automation, and continuous improvement across development and operations teams. These include real-time monitoring, distributed tracing, and integration with CI/CD pipelines. By providing visibility into application performance and infrastructure health, New Relic enables DevOps teams to quickly identify and resolve issues, optimize performance, and deliver high-quality software with increased speed and efficiency.
86. What is the process for creating a custom plugin for New Relic?
Ans:
- Creating a custom plugin for New Relic involves utilizing the New Relic Plugin SDK or compatible programming languages such as Ruby or Python.
- Developers use the SDK to define metrics, collect data from external sources like databases or third-party services, and transmit data to New Relic for visualization and analysis.
- Once developed, the plugin can be deployed and configured within the New Relic platform to monitor specific aspects of application performance or infrastructure health.
87. How to optimize New Relic’s performance on a high-traffic website?
Ans:
To optimize New Relic’s performance for a high-traffic website, organizations can implement strategies like optimizing data collection, reducing instrumentation overhead, and utilizing caching and compression techniques. Additionally, scaling New Relic’s infrastructure horizontally by deploying additional monitoring instances or agents helps distribute the load across multiple servers. These measures ensure New Relic effectively monitors application performance without compromising the website’s performance.
88. What are the best practices for setting up alert thresholds in New Relic?
Ans:
Setting up alert thresholds in New Relic follows best practices, such as defining thresholds based on key performance indicators and business objectives. Organizations establish meaningful alert thresholds to trigger notifications when performance metrics deviate from normal behaviour or exceed predefined limits. Additionally, configuring alert policies with clear escalation paths and notification channels ensures timely response and resolution of performance issues.
89. How does New Relic handle data visualization and reporting?
Ans:
- New Relic offers robust data visualization and reporting capabilities through features like dashboards, charts, and custom reports.
- Organizations create customized dashboards to visualize performance metrics, track key performance indicators, and monitor application and infrastructure health.
- Reporting tools enable the generation of detailed reports, analysis of historical data, and insights into application performance trends.
- Leveraging these features empowers organizations to make informed decisions and optimize application performance.
90. How to use New Relic to ensure application reliability and uptime?
Ans:
Using New Relic to ensure application reliability and uptime involves proactive monitoring, alerting, and troubleshooting practices. Organizations continuously monitor key performance metrics, set up alerts to notify stakeholders of potential issues, and proactively identify and address performance bottlenecks. Additionally, features like distributed tracing and anomaly detection offer insights into application behaviour and optimization opportunities.