Last updated on 06th Jun 2026| 11101
- Introduction to SAP Analytics Cloud
- SAP Analytics Cloud Architecture
- Getting Started with SAC
- Data Connections and Import
- Data Modeling Basics
- Creating Stories and Dashboards
- Data Visualization Techniques
- Planning and Forecasting Features
- Reporting and Analytics
- Conclusion and Best Practices
Introduction to SAP Analytics Cloud
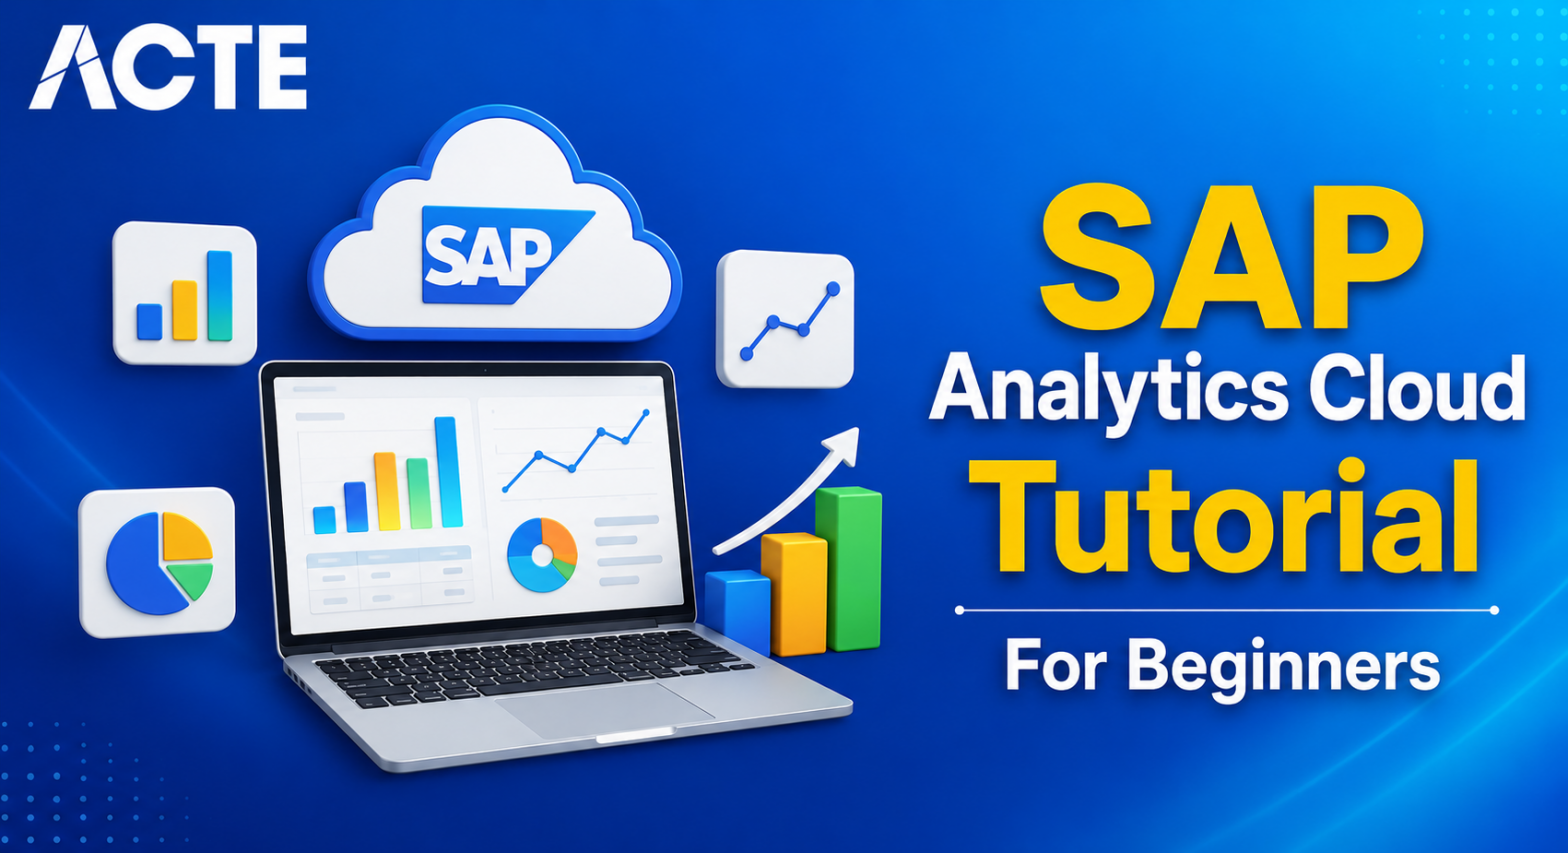
SAP Analytics Cloud (SAC) is a comprehensive cloud-based analytics solution developed by SAP that combines business intelligence, planning, predictive analytics, and data visualization within a single platform. It enables organizations to transform raw business data into meaningful insights that support strategic and operational decision-making. SAC provides users with interactive dashboards, reports, and analytical tools that help monitor performance, identify trends, and uncover business opportunities in SAP Analytics Cloud Training. The platform supports integration with both SAP and non-SAP systems, allowing organizations to analyze data from multiple sources in one centralized environment. As a software-as-a-service (SaaS) solution, SAP Analytics Cloud eliminates the need for extensive on-premise infrastructure while offering scalability, security, and accessibility. Business users, analysts, and executives can collaborate efficiently using real-time data and shared insights. With its intuitive interface and advanced analytical capabilities, SAC helps organizations improve operational efficiency, optimize planning processes, and drive data-driven business growth.
SAP Analytics Cloud Architecture
The architecture of SAP Analytics Cloud is designed to provide a secure, scalable, and efficient environment for business analytics and planning. It consists of multiple layers that work together to collect, process, analyze, and visualize data from various sources and lrean more in SAP SuccessFactors Tutorial for HR Freshers. The architecture supports both live connections and imported data models, enabling organizations to choose the most suitable approach based on their business requirements. Data sources may include SAP S/4HANA, SAP BW, SAP HANA, databases, spreadsheets, and third-party applications. The analytical engine processes large volumes of data and delivers real-time insights through interactive dashboards and reports. Built on SAP’s cloud infrastructure, SAC ensures high availability, data security, and system reliability. The architecture also supports collaboration features, predictive analytics, and planning capabilities within a unified environment. Understanding the SAC architecture helps users design efficient analytical solutions and maximize the value of their business data.
Ready to earn your SAP Analytics Cloud Professional Certification? Discover the SAP Analytics Cloud Training now available at ACTE!
Getting Started with SAC
Getting started with SAP Analytics Cloud involves understanding the platform’s interface, navigation structure, and core functionalities and learn more in SAP CRM Tutorial Made Easy . New users typically begin by setting up accounts, configuring roles and permissions, and exploring the various workspaces available within the system.
The SAC home page provides access to stories, dashboards, models, files, calendars, and collaboration tools that support analytics and planning activities. Users can easily navigate between different sections, create new content, and access existing reports through a web browser in SAP Analytics Cloud Training . SAP Analytics Cloud offers a user-friendly experience that requires minimal technical expertise, making it accessible to both business and technical users. Familiarity with key features such as data models, visualizations, filters, and sharing options helps users become productive quickly. Learning the basics of SAC establishes a strong foundation for creating reports, analyzing business performance, and leveraging advanced analytical capabilities effectively.
Get Your SAP Analytics Cloud Certification by Learning from Industry-Leading Experts and Advancing Your Career with ACTE’s SAP Analytics Cloud Training.
Data Connections and Import
Data connections are a critical component of SAP Analytics Cloud because they enable organizations to access and analyze information from various business systems. SAC supports multiple connection types, including live connections and data import connections. Live connections allow users to access data directly from source systems without physically storing it within SAC, ensuring real-time analysis and enhanced data security and learn more in SAP-Business Objects Tutorial. Import connections, on the other hand, copy data into SAC for faster processing and advanced analytical functions. Supported data sources include SAP S/4HANA, SAP BW, SAP HANA, SQL databases, spreadsheets, cloud applications, and third-party systems. Proper configuration of data connections ensures accurate, secure, and reliable access to business information. Organizations can schedule data refreshes, manage connection settings, and monitor data quality to maintain analytical accuracy. Effective data connectivity allows businesses to create comprehensive reports and gain valuable insights from multiple sources within a single analytics platform.

Learn SAP Analytics Cloud Training Course to Build Your Skills
Weekday / Weekend BatchesSee Batch DetailsData Modeling Basics
Data modeling in SAP Analytics Cloud involves organizing, structuring, and preparing data for reporting, visualization, and analytical purposes. A data model serves as the foundation for all analytical activities by defining how business data is stored, related, and presented within the system. Users can create dimensions, measures, hierarchies, attributes, and calculated fields to support specific reporting requirements. SAC provides tools for data transformation, cleansing, enrichment, and validation, helping organizations improve data quality and consistency. Well-designed data models enhance report performance, simplify analysis, and provide accurate business insights in SAP Analytics Cloud Training . Data modeling also enables users to establish relationships between datasets and create meaningful structures that reflect real-world business processes. Whether using imported data or live connections, effective data modeling ensures that analytical outputs are reliable and aligned with organizational objectives. Understanding data modeling concepts is essential for building scalable, efficient, and high-performing analytics solutions within SAP Analytics Cloud.
Creating Stories and Dashboards
- Story Creation: Stories are interactive reports that combine charts, tables, filters, and visual elements to present business data effectively and SAP HANA Administration Tutorial. They help users analyze information, identify trends, and share insights across the organization through a centralized and user-friendly interface.
- Dashboard Design: Dashboards provide a consolidated view of key business metrics and performance indicators. Users can monitor critical information in real time, enabling faster decision-making and improved visibility into organizational performance across different departments.
- Data Visualization Integration: Stories and dashboards integrate various visualization components to display data clearly and effectively. Charts, graphs, maps, and tables help users understand complex information and communicate insights more efficiently and learn more in SAP EWM Tutorial.
- Interactive Features: Interactive features such as filters, drill-downs, and dynamic selections allow users to explore data in greater detail. These capabilities enhance analytical flexibility and improve the overall user experience.
- Collaboration and Sharing: SAP Analytics Cloud enables users to share stories and dashboards with colleagues, promoting collaboration and informed decision-making. Teams can access consistent information and work together using shared analytical content.

Get JOB Oriented SAP Analytics Cloud Training for Beginners By MNC Experts
- Instructor-led Sessions
- Real-life Case Studies
- Assignments
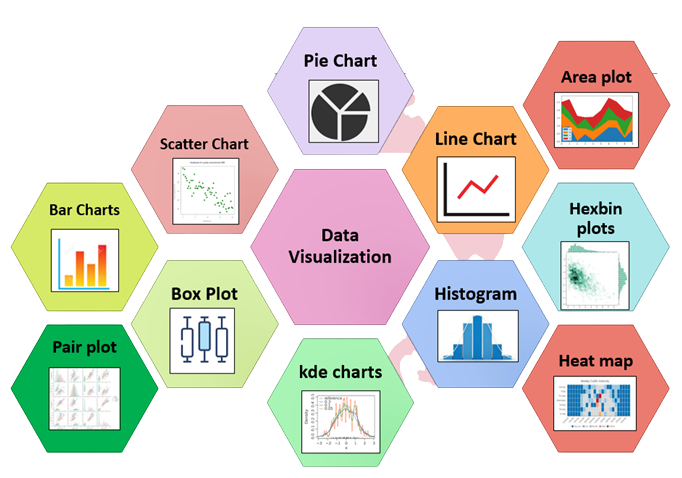
Data Visualization Techniques
- Chart Selection: Choosing the appropriate chart type is essential for effective communication. SAP Analytics Cloud offers bar charts, line charts, pie charts, and other visualizations that help present data in a meaningful and understandable format and Explore in SAP MM Tutorial from Scratch For Freshers.
- Data Representation: Visualization techniques transform raw data into graphical formats that highlight patterns, trends, and relationships. Clear visual representation improves comprehension and supports faster business decisions.
- Interactive Analytics: Interactive visualizations allow users to explore data dynamically through filtering, sorting, and drill-down functionality. This helps uncover deeper insights and supports more detailed analysis.
- Performance Monitoring: Visual dashboards display key performance indicators and business metrics in real time and SAP ERP Tutorial for Beginners. Organizations can monitor performance continuously and respond quickly to emerging opportunities or challenges.
- Insight Communication: Effective visualizations communicate complex business information in a simple and engaging manner. They support collaboration, improve reporting quality, and help stakeholders understand critical insights more easily.
Set to Ace Your AWS Job Interview? Check Out Our Blog on SAP HCM Interview Questions & Answer
Planning and Forecasting Features
- Budget Planning: SAP Analytics Cloud supports budget creation and management through collaborative planning tools. Organizations can allocate resources, monitor spending, and align financial plans with business objectives.
- Forecasting Capabilities: Forecasting features use historical data and business assumptions to predict future outcomes and SAP ABAP Tutorial with Examples For Beginners . These predictions help organizations prepare for changing market conditions and make proactive decisions.
- What-If Analysis: What-if analysis allows users to evaluate different business scenarios by modifying assumptions and variables. This capability supports strategic planning and risk assessment activities.
- Collaborative Planning: Multiple users can contribute to planning processes within a shared environment. Collaboration improves accuracy, transparency, and alignment between departments and stakeholders.
- Performance Tracking: Planning and forecasting tools enable organizations to compare actual results against planned targets. Continuous tracking helps identify variances and supports corrective actions when needed.
Reporting and Analytics
- Report Creation: SAP Analytics Cloud enables users to create detailed reports using data from multiple sources. Reports provide structured information that supports operational monitoring and strategic decision-making.
- Real-Time Analytics: Real-time analytics allow organizations to access current business data and monitor performance as events occur. This capability improves responsiveness and enhances decision quality.
- KPI Monitoring: Key Performance Indicators (KPIs) help organizations measure progress toward business objectives. Interactive dashboards provide visibility into critical metrics and operational performance.
- Advanced Analysis: Advanced analytics features help users identify trends, patterns, and business opportunities and learn more in SAP S/4HANA Tutorial for Beginners. These capabilities support deeper data exploration and more informed strategic planning.
- Business Insights: Reporting and analytics transform data into actionable insights that support growth, efficiency, and continuous improvement. Organizations can make better decisions based on accurate and timely information.
Are You Considering Pursuing a SAP Analytics Cloud Master’s Degree? Enroll For SAP Analytics Cloud Expert Masters Program Training Course Today!
Conclusion and Best Practice
SAP Analytics Cloud is a powerful solution that combines business intelligence, planning, predictive analytics, and reporting capabilities within a single cloud-based platform. It helps organizations transform data into meaningful insights, improve decision-making, and enhance overall business performance. By leveraging features such as data modeling, dashboards, visualizations, planning, forecasting, and real-time analytics, businesses can gain greater visibility into their operations and respond more effectively to changing market conditions in SAP Analytics Cloud Training . To achieve the best results, organizations should focus on maintaining high-quality data, designing efficient data models, creating user-friendly dashboards, and establishing proper governance policies. Regular user training, performance monitoring, and continuous optimization of reports and analytics processes are also essential for long-term success. Additionally, integrating SAP Analytics Cloud with other enterprise systems ensures seamless data flow and comprehensive business analysis. Following these best practices enables organizations to maximize the value of their analytics investments, improve operational efficiency, and support sustainable business growth through data-driven decision-making.