Last updated on 23rd Oct 2024| 7667
Qlik Sense is a powerful data visualization and business intelligence tool that enables users to analyze and interpret data from multiple sources. Qlik Sense allows users to create interactive dashboards, reports, and visualizations, facilitating data exploration and insight generation. It features robust data integration capabilities and supports associative data modeling, enabling users to uncover hidden relationships in their data. Qlik Sense supports collaboration and sharing, making it a valuable tool for organizations seeking to foster data-driven decision-making.
1. What is QlikSense, and how is it different from QlikView?
Ans:
QlikSense is a self-service system based solely on ease of use and interactive dashboards. In contrast, QlikView is primarily developer-driven with the need for scripting complex analytics. The former supports drag-and-drop features, offering a more user-friendly interface but less control over data modelling and scripting through QlikView. However, it comes at a price and a steeper learning curve.
2. Describe the architecture of QlikSense.
Ans:
The architectural design of QlikSense has a few constituent components, including the QlikSense server, repository, and proxy. The server executes the application and the repository deals with configurations and user settings. The proxy controls web traffic between the client and server. Data is loaded into in-memory storage for fast querying and interaction.
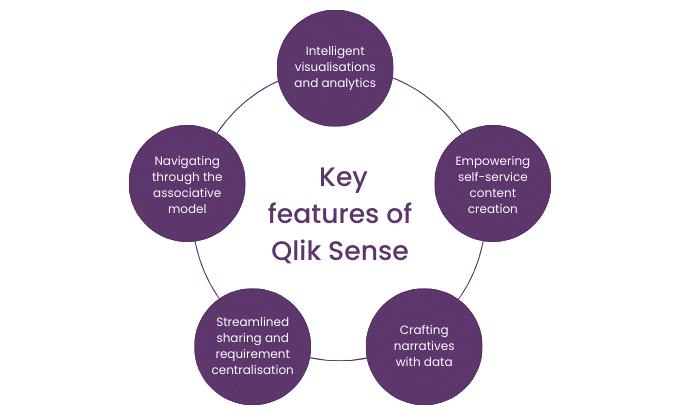
3. What are the key features of QlikSense?
Ans:
Some key features are self-service data visualization, associative data modelling, responsive design for all devices, real-time data collaboration, and powerful data exploration capabilities. It also allows smart visualizations, integrated data preparation tools, and governance for secure sharing and control of data. Enabling users to derive deeper insights through predictive modeling and machine learning integrations.
4. What are the different types of data loading methods in QlikSense?
Ans:
- This method loads data directly from a source, such as a database or a file, using a simple LOAD statement.
- Loads data from an already loaded table in memory, allowing for transformations or filtering without re-reading from the source.
- Allows users to input small datasets directly in the script, creating a table-like structure without needing an external data source.
- Loads data from a relational database using SQL queries, enabling users to fetch specific data sets based on complex criteria.
5. How does QlikSense treat data associations?
Ans:
- QlikSense bases its hyperlinking of data tables on an associative model, matching field values.
- When clicking on a data point, the platform automatically highlights related data across the rest of the dataset.
- That means that users are not confined to any predefined joins and can explore data relationships.
- As an additional resource, they can take advantage of this unique data selection system to show associated, available, and excluded data.
6. What is a QlikSense application, and how is it built?
Ans:
A QlikSense application is a project comprising aggregated data, visualizations, and analytics. Users make applications by uploading data to the platform, creating sheets filled with charts, tables, and graphs, and then organizing those for interactive analysis. Applications are stored in and opened from the QlikSense hub. These applications can be easily shared with team members, facilitating collaboration and collective insights across the organization.
7. What are the different data loading methods and functionality in Qlik Sense?
Ans:
| Data Loading Method | Functionality | Use Cases |
|---|---|---|
| Direct Load | Loads data directly from a source file or database. | When accessing data files or databases without transformation. |
| Resident Load | Loads data from an already loaded table in memory. | For transforming or filtering data without reloading from the source. |
| Inline Load | Inputs small datasets directly in the script. | For quick lookups or small reference tables within the script. |
| SQL Load | Fetches data using SQL queries from relational databases. | When specific data subsets are required from complex database structures. |
| Data Connectors | Accesses data from various external sources and cloud services. | For integrating data from different platforms and applications. |
| Incremental Load | Loads only new or changed data since the last load. | To optimize performance by reducing data processing time for large datasets. |
8. What is the definition of a sheet in QlikSense?
Ans:
Sheets in Qlik Sense are independent canvases in an app that users can use to create and position visualizations such as charts, graphs, and tables. Each sheet is a different view of the data, and users can interact with these visualizations to explore data and discover insights. Sheets can be customized with various layouts and themes to enhance the user experience and align with specific analytical goals.
9. What is the role of the QlikSense hub?
Ans:
A Qlik Sense hub is the user interface via which users log in and manage their apps. It acts as a central point for all the applications that a person creates; users can not only create new applications but also find published ones. This includes collaboration with others who have access to personal, shared, and public spaces. The hub provides tools for managing user permissions, monitoring app performance, and accessing various resources, enhancing the overall user experience.
10. How does QlikSense handle real-time data?
Ans:
- Qlik Sense can connect to real-time data sources, such as streaming data from IoT devices, APIs, and databases, allowing for continuous data updates.
- Qlik Sense can leverage WebSocket connections to receive live updates from data sources, ensuring that visualizations reflect the latest information instantly.
- Users can set up scheduled reloads at frequent intervals to refresh the data in the app, keeping it relatively up-to-date even if real-time streaming isn’t implemented.
- Qlik Sense supports interactive dashboards that can update in real-time, allowing users to monitor changes and respond quickly to new insights.
11. What is the Data Load Editor in QlikSense?
Ans:
- The QlikSense Data Load Editor is a tool that, starting from various sources, loads and transforms data into QlikSense applications.
- The scripting environment is performed to write SQL-like commands to manipulate data, define associations, and set up data models.
- It also enables the scheduling of data loads and incremental and error handling.
12. Describe the difference between the `LOAD` and `SELECT` statements in QlikSense.
Ans:
- The `LOAD` statement is QlikSense-specific, loading data from files, databases, or already loaded tables.
- The SQL-based `SELECT` statement retrieves data directly from a database.
- While `SELECT` pulls the data through SQL, `LOAD` is executed within QlikSense’s internal engine and is typically run with transformations.
- LOAD provides more flexibility for applying data manipulations and aggregations during the loading process, making it well-suited for creating a tailored data model within Qlik Sense.
13. How to load data from an external source into QlikSense?
Ans:
Connectors load data from external source files or cloud services, such as database files and even Excel files. The Data Load Editor can determine the source, formulate an SQL query or LOAD statement, and apply transformations before bringing data into the Qlik Sense data model. This flexibility allows users to tailor their data integration process to meet specific analytical needs and ensure data quality.
14. What is a synthetic key, and how can it be avoided?
Ans:
Whenever two or more tables contain multiple common fields, Qlik Sense creates an automatic synthetic key, which may result in unclear relationships. The developer can opt for JOIN, CONCATENATE, or rename fields to control explicit connections between the tables instead of a synthetic key. This approach enhances the clarity of the data model and helps avoid potential performance issues associated with synthetic keys.
15. Explain how `JOIN`, `KEEP`, and `CONCATENATE` are applied in QlikSense.
Ans:
- JOIN: This method combines two or more tables based on common fields, creating a new dataset. Different types of joins (INNER, LEFT, RIGHT, FULL OUTER) determine which records are included.
- KEEP: This option retains records from both tables without merging them, allowing analysis of overlapping data. Options include INNER KEEP (only matching records) and OUTER KEEP (all records from both).
- CONCATENATE: Appends rows from one table to another when they have similar structures, forming a single table. This can happen automatically or be explicitly enforced.
16. What is the difference between the load methods ‘Resident’ and ‘Inline’?
Ans:
- This method loads data from an existing table already in memory, allowing for the transformation or filtering of previously loaded data.
- This method allows users to enter small datasets directly within the script, creating a table-like structure without needing an external data source.
- It is useful for manipulating and referencing fields from previously loaded tables, making it effective for complex data processing.
- Best suited for quickly adding small datasets or looking up tables directly in the script for immediate use.
17. How does incremental data loading work in QlikSense?
Ans:
Instead of receiving the entire dataset, it loads only new or updated records from a data source. For this, it employs the concept of timestamps or unique identifiers to fetch only the latest changes. It will decrease the time taken to load and the utilization of resources, especially with large datasets. It ensures that data remains current without overwhelming the system with unnecessary data processing.
18. Explain how `WHERE` and `GROUP BY` work in QlikSense scripting.
Ans:
- Filters records during data loading, allowing only rows that meet specified conditions to be included, optimizing performance by reducing the dataset size.
- Can specify conditions based on field values, such as WHERE Field1 = ‘SomeValue’, to load only relevant data.
- Aggregates data based on one or more fields, enabling calculations of summary statistics like sums and averages.
- Typically used with aggregation functions (e.g., SUM, AVG) to create summary tables or reports, enhancing data analysis capabilities.
19. What is section access and data reduction in QlikSense?
Ans:
Data reduction refers to the method in which users will only be provided with the data they can access, ensuring data security and compliance. Data reduction is crucial for maintaining data security and compliance, ensuring users only see the information relevant to their roles and permissions. This approach protects sensitive data and streamlines the user experience by eliminating unnecessary data visibility.
20. How are variables created and applied in QlikSense scripting?
Ans:
Variables in Qlik Sense scripting are created using either the SET or LET keyword. These can hold values, expressions, or scripts to be used later for calculations, dynamic expressions, or within data load processes, which will enhance efficiency and consistency. Additionally, variables facilitate easier updates and maintenance of scripts, as changes to a variable’s value automatically propagate throughout the application where it is referenced.
21. What is a data model in QlikSense?
Ans:
A QlikSense data model is the data structure used in an analysis and comprises the tables and their relationships, making data exploration more efficient. The model further assists in defining how data could be loaded and associated. A good data model is important since it will make accurate insights and visualizations useful. It helps join various sources of data and analyze them together.
22. How Does QlikSense Manage Table Associations?
Ans:
- QlikSense automatically handles table associations based on field names. This associative model promotes dynamic filtering and analysis.
- When two tables have a common field name, QlikSense establishes a relationship between them and gives a relationship or associative data model.
- This implies that one can easily navigate from one related table to another for easier data exploration without manual joins.
23. What is a star schema, and how do we use this in QlikSense?
Ans:
- A star schema is a data modelling technique with a central fact table connected to multiple-dimension tables.
- In QlikSense, this can be done by loading a fact table and corresponding dimension tables.
- The fact table usually contains quantitative information, while the dimensions refer to the context.
- This structure optimizes the retrieval of data for analytical queries, enhancing its performance and making it easier to understand.
24. Describe what `AutoNumber()` does in QlikSense.
Ans:
In QlikSense, `AutoNumber()` creates an identifier unique to varying values. Replaces the strings with a numerical value that it produces, saving memory space. This helps for large amounts of data because comparing strings degrades its performance. There is an association maintained while optimizing the data model. It works to improve the performance and simplify the data management.
25. What are the optimization techniques for a Qlik Sense data model?
Ans:
The techniques for optimizing QlikSense data models should include using the `AutoNumber()` function, which helps generate unique identifiers. The number of fields should be reduced, and concatenation applied when the related tables are joined together. Filters used in the loading process may reduce the data loading. Review and cleanse the data model at regular intervals to eliminate redundant records and improve data efficiency.
26. What is the role of the Data Manager in QlikSense?
Ans:
The QlikSense data manager offers a graphical user interface to prepare and manage data. Users can load, transform, and control data without programming. Associations, edits in the fields, and managing data connections can be made easy. The Data Manager simplifies the process of building and maintaining the data model. Collaboration is allowed while ensuring that data is kept consistent and accurate.
27. How does QlikSense handle null values?
Ans:
- NULL values in QlikSense are counted as different values and are represented as blank spaces.
- NULL values don’t participate in aggregation and have no influence on the analysis’s result.
- In the management of NULL values, several functions like `If()`, `Alt()`, or `IsNull()` are used.
- They can occur during the data loading process when no data is available.
- Null management decides the right interpretation and visualization of data.
28. What is the `QUALIFY` keyword used in QlikSense for?
Ans:
- The `QUALIFY` keyword controls naming fields and removes duplicate field names in the data model.
- When this keyword is applied, it puts a prefix on the name of the field with the name of the table therefore, it gives uniqueness to the names of the fields.
- In this regard, it avoids errors, which could result from confusion in analyzing the data and, more importantly, data integrity issues.
- It simplifies comprehension and enhances the accuracy of the association of the data.
29. How do circular references in a data model get resolved?
Ans:
- A circular reference in the data model occurs when tables are interlinked in such a way that they create a loop.
- This could be addressed by using a bridge table to break the loop, ensuring only one path of association existed.
- One could also redesign the data model by amalgamating the tables or modifying the load script.
- Circular references can be removed by eliminating the redundant fields, for example.
- This helps give a better structure to the model, thereby clarifying the flow and performance.
30. Describe how to make a master calendar in QlikSense.
Ans:
Go to QlikSense and generate a date range using a script. Begin by importing distinct dates only from the data set, then create another table that includes all the desired dates within any range. Add fields for year, month, quarter, and other applicable time dimensions. Use the JOIN command to connect the master calendar with the main data model on date fields. This allows time-based analysis and enhances reporting capabilities.
31. What are the different types of charts that are available in QlikSense?
Ans:
Qlik Sense offers several chart types bar, line, pie, scatter plots, pivot tables, table charts, combo charts, gauge charts, KPI visuals, and map charts. There are many other options based on what the user wants to visualize. This variety allows users to effectively represent their data in a way that best communicates their insights and findings. Users can customize these visualizations with colors, labels, and styles to enhance clarity and impact.
32. How to create a bar chart in Qlik Sense?
Ans:
To design a bar chart in QlikSense, navigate to the app’s sheet, click on the Add new visualization button, choose Bar chart from the list of visualization types, and drag and drop dimensions and measures into fields that define what data to be shown. Customize properties, such as colours and labels, on the chart. Finally, preview the chart to ensure it accurately represents data and meets visualization needs.
33. Discuss the use of filters in QlikSense.
Ans:
- Qlik Sense filters allow users to limit what is displayed about the data based on specific criteria.
- A user filtering a dimension on a sheet will be able to home in on particular subsets of the data.
- Interactive filtering generally illustrates answers to which data points are related to other data points.
- This dynamic interaction enhances the analytical experience, enabling users to explore and uncover insights from their data more effectively.
34. How to make a pivot table in QlikSense?
Ans:
- Launch Qlik Sense and open the app where want to create the pivot table.
- Go to the sheet where want to add the pivot table, or create a new sheet.
- Click on the “Add new visualization” button (usually a “+” icon).
- From the list of available visualizations, choose “Pivot table.”
- Drag and drop the fields want to calculate into the “Values” section.
- Use the properties panel to adjust settings like sorting, formatting, and appearance to suit needs.
- Once created, can interact with the pivot table, applying filters or drilling down into the data for deeper insights.
35. What are set expressions in QlikSense visualizations?
Ans:
These are set expressions. The set expression in QlikSense is utilized to define subsets of data in a visualization for advanced analytics. It allows users to create custom aggregations and comparisons based on specified conditions, such as including or excluding data points that result from the specified dimensions or measures. Set expressions enable users to perform calculations across different contexts, making it easier to analyze trends and variations in data over time or across categories.
36. How to create a KPI visualization?
Ans:
Now, let’s create a KPI visualization in QlikSense. Go to an app’s sheet, add a new visualization, and select KPI. Then, for the measured field, can drag in a measure, such as sales total, and add any other formatting options that might be available, like a threshold or changed colour based on some performance metric. This visual will quickly show the key performance indicators.
37. How to customize chart colors in QlikSense?
Ans:
QlikSense’s chart colours can be customized by choosing the chart and going to the properties panel. That is where it allows changing the colour scheme for measures and dimensions. QlikSense also allows using a custom colour palette and conditional formatting of the data based on values to give a better visual presentation. These customization options help enhance the overall readability and impact of the visualizations, making key insights more accessible to users.
38. What does adding a reference line to a QlikSense chart do?
Ans:
- Reference lines can be added directly from the properties panel in QlikSense.
- Select the desired chart, then look in the “Presentation” section for “Reference Lines.”
- Here, users can specify whether the line type should be fixed or dynamic and define the value or expression that it represents for the reference line.
- This puts the data under analysis into perspective.
39. What is a map chart, and how can it be used in QlikSense?
Ans:
- Geographical Representation: Map charts display data points on a geographical map, enabling analysis of spatial relationships and patterns.
- Data Points: Users can plot data based on geographic fields like latitude, longitude, or location names, allowing for clear visualization of location-based data.
- Custom Layers: Map charts can include custom layers for additional data sources, such as heat maps or regions, enhancing the visualization.
- Interactivity: Users can interact with the map by zooming, clicking on data points for details, and applying filters to focus on specific data subsets.
- Use Cases: Common applications include sales analysis by region, market research for demographic distribution, and logistics optimization for delivery routes.
40. How to create a drill-down dimension in QlikSense?
Ans:
- Launch Qlik Sense and open the desired app.
- Go to the Data Manager and select “Add” to create a new field.
- Choose “Drill-down” as the type of dimension.
- Drag and drop the dimensions want in the hierarchy.
- Arrange the dimensions in the desired order for the hierarchy.
- Add a chart to sheet and select the drill-down dimension to test its functionality.

Get JOB Qlik Sense Training for Beginners By MNC Experts
- Instructor-led Sessions
- Real-life Case Studies
- Assignments
41. What are the different types of expressions in QlikSense?
Ans:
QlikSense supports several expression types, including aggregation functions (like `SUM()`, `COUNT()`, and `AVG()`), conditional functions (such as `IF()` and `CASE`), string functions (like `CONCAT()` and `SUBSTRING()`), and date/time functions (such as `YEAR()` and `MONTH()`). These expressions enable calculations, data manipulation, and dynamic visualizations based on user selections, enhancing analytical capabilities.
42. How does QlikSense handle aggregation in expressions?
Ans:
In QlikSense, aggregation is automatically managed based on the dimensions present in a visualization. When an aggregation function is applied, QlikSense calculates the values over the specified dimensions. If no dimension is selected, the function aggregates across all records. The use of `TOTAL` allows for customized aggregation scopes, providing flexibility in data analysis.
43. Explain the `If()` function in QlikSense.
Ans:
The `If()` function evaluates a condition and returns one true value and another if false, enabling conditional calculations. It is frequently used to categorize data or implement specific logic in measures, allowing for dynamic analysis based on defined criteria. Nested `If()` statements can be employed for more complex conditions, facilitating versatile data manipulation.
44. What is the purpose of the `Aggr()` function in QlikSense?
Ans:
- The `Aggr()` function creates a virtual table for nested aggregations, allowing calculations for specified dimensions.
- This function is beneficial when the aggregation context needs to be controlled, such as calculating averages or percentages within groups.
- By using `Aggr()`, users can enhance the granularity of their analysis, making it easier to derive insights from complex datasets.
45. How are set analysis expressions used in QlikSense?
Ans:
- Set analysis allows to specify a particular set of data to aggregate, using syntax that can filter based on dimensions or measures.
- The basic syntax for set analysis is Sum({<FieldName = {‘Value’}>} Measure), where replace FieldName with the relevant field and Measure with the aggregation want to perform.
- Can define multiple conditions within a single set analysis expression by separating them with commas, as analyzing data for multiple years or products.
- Set analysis expressions can dynamically respond to user selections in the app, allowing for interactive analyses that adjust based on user input.
46. Explain the use of `GetFieldSelections()` in QlikSense.
Ans:
- GetFieldSelections(FieldName) returns the values currently selected in the specified field, allowing to capture user choices dynamically.
- This function is often used in expressions and visualizations to create dynamic titles, labels, or text that reflect the user’s current selections.
- If multiple values are selected, GetFieldSelections() can return them as a comma-separated list, making it easy to present selected values in a user-friendly format.
- Can provide a second parameter to set a default value if no selection has been made, helping maintain clarity in visualizations.
47. What is the difference between `Sum()` and `Count()` functions?
Ans:
The `Sum()` function aggregates numeric values to calculate their total, while `Count()` counts the number of records or non-null entries in a field. `Sum()` is typically applied to financial or quantitative data, providing a total value. Conversely, `Count()` is useful for analyzing categorical or qualitative data, helping to identify frequency or occurrence.
48. How are date and time functions used in QlikSense?
Ans:
QlikSense offers various date and time functions, such as `Date()`, `Time()`, `Month()`, and `Year()`, for manipulating and formatting date/time values. These functions enable users to extract specific components from date/time fields, perform calculations, and format data for visualization display. This functionality is essential for time-based analysis and reporting.
49. What is the `ApplyMap()` function, and how is it used?
Ans:
Using a defined mapping table, the `ApplyMap()` function maps values from one field to another. It requires a mapping name, a key to look up, and an optional default value if no match is found. This function is useful for transforming data, such as replacing codes with descriptive labels and ensuring data consistency and clarity in visualizations.
50. How is conditional formatting applied in QlikSense visualizations?
Ans:
Conditional formatting in QlikSense allows users to adjust the appearance of visual elements based on data values. Users can specify conditions for text colour, background colour, and other style properties in the properties panel of visualizations. This dynamic formatting enhances data’s visual impact and clarity, making insights more accessible to users. It enables users to quickly identify trends, anomalies, and key performance indicators, improving overall decision-making efficiency.
51. What are the constituent parts of the QlikSense Server?
Ans:
- QlikSense Engine which serves to process and calculate data QlikSense Scheduler Service which is responsible for handling tasks and scheduling events.
- QlikSense Repository Service (QRS) which will provide metadata storage in addition to application management.
- Other major components comprise the QlikSense Proxy Service (QPS), which authenticates users and manages sessions.
- With these components, it helps in the processing of data efficiently while handling user access and application management.
52. What is QlikSense Scheduler Service doing for QSS?
Ans:
- The QSS schedules data reloads, generates alerts, and performs numerous other automated tasks.
- It can be stated that QSS allows end-users to gain fresh insights from time to time through applications and models.
- It monitors task performance and has logs available for troubleshooting issues.
- In this manner, the QSS service ensures data remains fresh and relevant to applications.
53. How does QlikSense deploy in an enterprise environment?
Ans:
- QlikSense may be used in numerous ways in an enterprise-from installation on-premises.
- The deployment involves setting the right components, including QlikSense Server, Repository Service, and Proxy Service.
- Commonly, a reprise configure configureironment so that everything meets up with rity and performance requirements.
- A multi-node architecture will also be supported for scalability and load balancing.
54. What is QlikSense Management Console, or QMC?
Ans:
The QlikSense Management Console, or QMC, is the management interface for the QlikSense environment, which hosts configuration tools, user management, task monitoring and management, and data connections. Using the QMC allows administrators to create streams and manage applications. It can also be used to manage security rules or access. The QMC is important for an organized and efficient deployment of QlikSense.
55. What is QlikSense management of task scheduling?
Ans:
QlikSense management console, QMC, schedules the tasks of QlikSense. On this, users can create, edit, and configure the reload tasks for apps specifying a specific schedule that needs to run. It is QSS’s duty to execute these scheduled tasks so that data gets updated as desired. Administrators can also track the status and logs of a task through QMC. This system helps in the effective management of data and timely updating.
56. What is the difference between an application and a stream in QlikSense?
Ans:
In QlikSense, a stream is a container to organize and distribute applications to several users. Streams manage app access using roles and permissions; administrators manage its visibility and security. An app refers to a particular data analysis application with models, visualizations, and dashboards. While streams are on controlling who can access it, apps are the real exploratory and analytical tools for data exploration.
57. How to share QlikSense apps with other users?
Ans:
- In QlikSense, apps can be shared with other users through streams within the QlikSense environment.
- Users can access these apps based on their permissions within the streams.
- Moreover, sharing links with an app or even snapshots of visualizations is possible, encouraging cooperation.
- QlikSense also ensures that such an app is secure and governed once shared.
58. Definition of a multi-node deployment in QlikSense.
Ans:
- A multi-node QlikSense deployment employs multiple QlikSense servers to separate the workload for better scalability and performance.
- It will offer load balancing and redundancy, both on the factors that improve scalability and reliability.
- Each node can take one or multiple services it could be an Engine or Proxy Service, thus utilizing resources better.
- Multi Node configurations are best suited for enterprises with high-demand user requirements and needs for heavy data processing.
59. How to manage user access and security in QlikSense?
Ans:
- User access and security in QlikSense are managed through security rules and user directory services.
- Administrators can define rules that govern user access to apps, streams, and data based on roles or attributes.
- QlikSense supports integration with external user management systems, such as Active Directory.
- This will ensure that permission is uniform for the user and aligned with organizational policies.
- It also provides data integrity and confidentiality through periodic audits and reviews of security settings.
60. What are some best practices for QlikSense server maintenance?
Ans:
Best practices for QlikSense server maintenance include continuous tracking of server activity for resource consumption and performance to see if any issues can occur beforehand. This keeps the software updated with the latest patches and updates, so the system will always be in the safe zone. Regular backup of repository and configuration settings is very important for disaster recovery. Documentation of configurations and changes also helps simplify future maintenance tasks.

Develop Your Skills with Qlik Sense Certification Training
Weekday / Weekend BatchesSee Batch Details61. What is QlikSense Mashup, and how is it used?
Ans:
QlikSense Mashup has the capability of including QlikSense visualizations in web applications. This is mainly achieved by incorporating charts and tables, among other objects, in custom web pages. Developers use HTML, CSS, and JavaScript to develop personalized dashboards incorporating QlikSense data alongside other web content, enhancing the user experience and interactivity.
62. Explain how QlikSense communicates with third-party APIs.
Ans:
QlikSense communicates with third-party APIs through its capabilities as a RESTful API. The application enables developers to pull in data sources, trigger actions, or send data back to other applications. This way, they can exchange data flawlessly with data sources outside QlikSense to share more data with users and incorporate various data sources into the QlikSense applications.
63. What are QlikSense extensions for?
Ans:
- Extensions allow developers to create custom chart types and visualizations that are not available by default in Qlik Sense, providing greater flexibility in data representation.
- They can introduce new interactive elements, enabling users to engage with data in innovative ways, such as custom filters, sliders, or pop-ups.
- Extensions can leverage external JavaScript libraries or frameworks to bring in advanced visualizations and functionalities that enhance the user experience.
- They can be tailored for specific business needs or industry requirements, allowing organizations to implement unique features that align with their analytical goals.
64. How are custom extensions created in QlikSense?
Ans:
- The development of custom extensions in QlikSense is done by creating folder structures that contain a JavaScript file, an HTML file, a JSON file for configuration.
- An extension’s property and behaviour definitions reside within the JSON file, while its functionality is defined within the JavaScript file.
- Developers define how it looks using its HTML/CSS structure. A custom extension can then be loaded into QlikSense.
65. What are QlikSense GeoAnalytics, and how is it used?
Ans:
- Qlik Sense GeoAnalytics enables the creation of advanced geospatial visualizations, such as maps and heat maps, to analyze data by location.
- The extension supports various geographic data sources, including shapefiles and geocoded data, facilitating effective spatial analysis.
- GeoAnalytics offers capabilities for routing and network analysis, optimizing logistics and transportation routes using geographic information.
- Users can interact with maps to drill down into specific areas, and visualize different layers of data for comprehensive insights.
66. What is Direct Discovery, and how does it work in QlikSense?
Ans:
Direct Discovery allows users to connect and query massive data sources without loading all the data into QlikSense’s in-memory engine. This way, real-time data analysis becomes possible by directly accessing external databases without losing the associativity capabilities of QlikSense. This consequently applies well to scenarios where data volumes exceed memory limits.
67. How does QlikSense handle big data?
Ans:
QlikSense offers big data management capabilities, including Direct Discovery, which allows for ad-hoc querying of large datasets at query time without requiring loading all data. It also supports access to big data environments like Hadoop or Spark. It leverages its Associative Engine to handle complex relationships within data very efficiently for the exploration of large points of data in interactive analysis.
68. What is QlikSense Associative Engine, and how does it work?
Ans:
The QlikSense Associative Engine is an in-memory engine that allows fast data processing and interactive querying. It creates a flexible data model that automatically identifies associations between data points. Users may freely explore data because selections in one location affect related data throughout the entire dataset, providing an intuitive data discovery experience.
69. How does NPrinting Automate Reports in QlikSense?
Ans:
- NPrinting reporting and distribution in Qlik. Makes reports automatically through QlikSense.
- Users can create templates of reports, schedule report creation, and distribute lists.
- NPrinting will automatically extract data from QlikSense apps, compile the reports into various formats, and deliver them to the recipients at specified intervals.
70. Describe what an on-demand app is.
Ans:
- On-demand apps in QlikSense are meant to empower the generation of dynamic reports or visualizations based on specific selections or parameters.
- The application can be activated from other applications or web pages, which allows customizing reports while staying within the current context and not having to leave it.
- This also enhances user interaction and report creation simplicity, it empowers users to derive insights more efficiently, fostering a data-driven culture within the organization.
71. Which techniques should be considered for optimizing a QlikSense application?
Ans:
- Optimization techniques for QlikSense apps include data model optimization, reducing the number of dimensions and measures in a visualization.
- Avoiding superfluous complex calculations, including set analysis but not using synthetic keys, and aggregating at source so that the data to load is decreased and, thus, the response time.
- QlikSense uses an in-memory data model that loads data into RAM for fast access and processing allows the users to respond and perform quick aggregations and calculations to interact with large datasets in real time.
73. How will large data volumes affect performance in QlikSense?
Ans:
Huge volumes of data would badly degrade QlikSense’s performance, mainly due to longer data load times, slower visualizations, and increased memory resource utilization. This leads to poor response time during user interactions and overall user experience. The best approach to dealing with such performance issues would be optimizing data models and using techniques that reduce data.
74. What are the best practices for optimizing data load times in QlikSense?
Ans:
Optimizations to allow reduced amounts of data to load include incremental loading and minimizing transformation during load time. Filtering with the WHERE clause can further minimize load time. Other contributing factors to a shorter load time include the use of efficient joins and the avoidance of synthetic keys. Leveraging appropriate data modeling techniques can significantly enhance performance and streamline the overall loading process.
75. Describe how the QlikSense Performance Profiler is used.
Ans:
The QlikSense Performance Profiler analyzes an application’s performance based on bottlenecks in loading data and rendering visualizations. This tool gives insights into load times, memory usage, and expressions or visualizations used. Inspecting the profiler output will enable the developer to identify areas needing optimization, thus improving the app’s overall performance.
76. How to optimize chart rendering in QlikSense?
Ans:
- Chart rendering can be optimized in Qlik Sense by reducing the number of data points and using legible chart types.
- Also, using fewer measures and dimensions in one chart leads to faster render times and an effortless user experience.
- Utilizing efficient chart types tailored to the data can further enhance performance and clarity in visualizations.
77. How does caching impact the performance of QlikSense?
Ans:
- Caching has a very important role in QlikSense it pre-folks those things commonly needed into memory, on the hard drive, or even in RAM.
- In this way, it avoids repeated recalculation and reloading of the data to get it into the user’s view.
- The associative engine actively uses caching to quickly access data pertinent to users’ selections in the application.
78. How would optimizing the data model enhance app performance?
Ans:
An improved data model in QlikSense greatly improves performance because it minimizes data redundancy, thus minimizing associations between the tables. A star schema design provides for easier, more direct relationships between the data, it would be easier for the engine to navigate. Synthetic keys and unwanted fields can also speed up data processing and queries.
79. How do hardware resources affect QlikSense performance?
Ans:
Major hardware resources include CPU, RAM, and disk speed. In QlikSense, all these aspects impact performance. A sufficient amount of RAM is indispensable for holding bigger datasets in memory. A powerful CPU takes less time to process calculations and aggregation. Fast disk storage contributes to rapid data loading and reduces latency, thus creating an overall smoother user experience.
80. How do log files help in troubleshooting QlikSense performance?
Ans:
QlikSense log files are of extreme value in troubleshooting better performance with information over detailed loads, user sessions, and application errors. The analysis helps determine the bottlenecks where their performing system shows slow-loading queries or heavy resource usage. By looking at their log files, developers can decide on optimizations and improvements to enhance app performance.
81. What are some common issues when loading data into QlikSense?
Ans:
- Typical Problems Loading Data with QlikSense include various type mismatches, syntax errors in the load script, and incorrect file paths.
- Missing values or null values can also play a role in data load problems. Large data sets with adequate optimization can improve performance.
- Circular references and synthetic keys can occur, complicating the data model. Solving these problems requires knowing how to troubleshoot.
82. Why troubleshoot for slow performance in a QlikSense application?
Ans:
- The first approach would be troubleshooting the Qlik Sense application, which has data-modelling inefficiencies such as synthetic keys or circular references.
- Review the load script for bottlenecks and unnecessary data transformations in this regard. Monitor usage and server resource utilization, like CPU and memory, as indicator points of sluggishness.
- Optimize visualizations by limiting the number of objects and data load at opening the application. Also, check network latency when accessed remotely.
83. What are synthetic keys, and how does QlikSense handle them?
Ans:
- Synthetic keys are those situations when more than one table has fields with identical names, which may create ambiguous associations can easily make the data model more complicated and affect performance.
- To overcome synthetic keys, discover areas in the load script where fields could be renamed to generate unique field names or reduce synthetic keys by joining or concatenating tables.
- It is also good practice to review the design of the data model to prevent unnecessary associations. Synthetic key handling strengthens the integrity of data together with performance.
84. How does one handle the circular reference problem in QlikSense?
Ans:
QlikSense will ensure that each table has a maximum of a single chain of associations. This may be accomplished by consolidating related tables into one or by using an intermediary or bridge table to link multiple tables together. Please avoid using the same names for fields from different tables, as it creates loops. A clean and proper data model is the key towards keeping things clear and performance-based.
85. What are the script-debugging tools available in Qlik Sense?
Ans:
Several debuggers are available with QlikSense, such as the script editor, which auto-highlights syntax errors during the writing process of a script. The “Debug” option is presented for stepping through script execution and recognizing error and performance issues. The Data Model Viewer helps visualize associations and structures, making debugging easier. Altogether, these improve the troubleshooting process.
86. How does QlikSense handle missing or null values?
Ans:
In QlikSense, missing or null values get loaded as blank fields. The users can manage these nulls by making use of functions like `If()`, `Alt()`, or `IsNull()` and setting the default values or conditions to avoid their occurrences during analysis. If null values occur in any records, they do not participate in any aggregation; hence, it would affect some insights. Null values have to be addressed to give an accurate depiction of the data.
87. What are some common data loading errors, and troubleshoot them?
Ans:
- Some typical errors arising during data loading are syntax errors in the script, incorrect kinds of data, and misplaced file paths.
- Correction of mistakes on these can be done through thorough proofreading of the load script to check for typos or problems in the script format.
- Ensuring the kind of data is correct and valid to match with the formats expected, and ensuring the paths for the data sources are accurate.
- Other ways to do this may be checking error messages found in the log files for specific issues. Testing with smaller subsets of data can well-isolate problems.
88. How does one recover a failed QlikSense app reload?
Ans:
- Open the reload logs to see if error messages point out the cause of failure.
- Fix the error that caused the failure, either in the load script or in the issue with the data source.
- Manually retrigger the reload from QMC.
- If the failure is due to resource constraints, consider optimizing the data model or increasing server resources.
- Monitor reload tasks periodically to avoid future errors.
89. What are the best practices for QlikSense log file analysis?
Ans:
The best practice of QlikSense log file analysis is to review the log files often to gain insights into app performance and error outputs. For instance, log archives can be sorted by date and event type, for example, reload and audit, for easier scanning. Use special log analysis tools or scripts to extract information of interest automatically. Pay attention to error messages and warnings indicative of repeating patterns, which may also indicate deeper problems.
90. How are memory allocation issues handled in QlikSense?
Ans:
Optimizing data models and eliminating unnecessary data loads will also help. The `AutoNumber()` function could reduce the memory required for large data. Monitoring server resource utilization can easily point out areas where memory is the bottleneck, and changes can be accordingly done in resources or hardware upgraded to these. Proper configuration and maintenance lead to efficient memory management.