Last updated on 04th Jul 2020| 3204
These Microsoft Business Intelligence Interview Questions have been designed specially to get you acquainted with the nature of questions you may encounter during your interview for the subject of Microsoft Business Intelligence .
As per my experience good interviewers hardly plan to ask any particular question during your interview, normally questions start with some basic concept of the subject and later they continue based on further discussion and what you answer.we are going to cover top 100 Microsoft Business Intelligence Interview questions along with their detailed answers. We will be covering Microsoft Business Intelligence scenario based interview questions,Microsoft Business Intelligence interview questions for freshers as well as Microsoft Business Intelligence interview questions and answers for experienced.
1. What is SSIS (SQL Server Integration Services)?
Ans:
SQL Server Integration Services (SSIS) is a Microsoft SQL Server component dedicated to data integration and transformation. It facilitates the development of ETL (Extract, Transform, Load) processes, allowing seamless extraction, cleansing, and loading of data across various sources.
2. Explain the purpose of a Data Flow Task in SSIS.
Ans:
The Data Flow Task in SSIS serves as a pivotal element for managing data movement within the ETL process. It enables the design of data transformations, defining how data is extracted from source systems, manipulated, and ultimately loaded into destination repositories. The Data Flow Task empowers developers to craft intricate data transformations, ensuring the integrity and quality of the data being processed.
3. Differentiate between Control Flow and Data Flow in SSIS.
Ans:
Control Flow in SSIS involves the design and management of workflow and tasks within the package. It dictates the sequence and conditions for task execution. On the other hand, Data Flow focuses on the movement and transformation of data within the package. It involves the extraction, transformation, and loading of data from source to destination. While Control Flow handles the logical flow of tasks, Data Flow manages the physical movement and transformation of data within those tasks.
4. What are SSIS Variables, and how are they used?
Ans:
SSIS variables are containers for storing and managing values during the execution of SSIS packages. They provide a way to dynamically control and adjust settings within the package. Variables can store information such as file paths, connection strings, or any other values that may change during the package execution. Integration Services allows the use of system variables, which provide information about the execution environment, as well as user-defined variables for custom requirements.
5. Explain the concept of ETL (Extract, Transform, Load) in SSIS.
Ans:
ETL in SSIS refers to the process of extracting data from source systems, transforming it according to business logic, and loading it into a destination system for analysis and reporting. The Extract phase involves retrieving data from diverse sources such as databases, flat files, or APIs. Transformation includes cleaning, aggregating, and converting data to meet the desired format. Finally, Load involves writing the transformed data into the destination, typically a data warehouse or database, ready for analytical processing.
6. How do you handle errors in SSIS packages?
Ans:
Handling errors in SSIS is crucial for maintaining data integrity and package reliability. Common error-handling techniques include :
Error Output in Transformations : Configuring transformations to redirect error rows to separate outputs for further analysis.
Event Handlers : Utilizing OnError and OnTaskFailed event handlers to perform specific actions when errors occur during package execution.
Logging : Implementing logging at various levels (package, task, or component) to capture detailed information about errors and their context.
Checkpointing : Enabling package checkpointing to restart the package from the point of failure instead of rerunning the entire process.
7. What is a Derived Column Transformation in SSIS?
Ans:
The Derived Column Transformation in SSIS is a data transformation task that allows users to create new column values or modify existing ones based on expressions or computations. It is commonly used for tasks such as concatenating strings, extracting substrings, performing mathematical calculations, or transforming date values. The transformation provides a flexible way to manipulate and derive new data within the data flow pipeline.
8. How can you implement Incremental Load in SSIS?
Ans:
To implement Incremental Load in SSIS, utilize a control table with a timestamp to track the last ETL run. Adjust the source query with a WHERE clause to filter data based on the timestamp. Alternatively, employ techniques like Change Data Capture (CDC) or hash values for identifying modified records. By comparing timestamps or hash values, only new or altered data is processed, reducing resource consumption and enhancing efficiency in handling evolving datasets.
9. Explain the use of the SSIS Lookup Transformation.
Ans:
The SSIS Lookup Transformation is a crucial component that enables the integration of data from multiple sources by matching and retrieving related information. It is employed to query a reference dataset (lookup dataset) to find matching values for a specified column in the input dataset. This transformation is valuable for tasks such as data enrichment, where information from one dataset needs to be augmented with corresponding details from another dataset.
10. What is the role of the SSIS Package Configuration?
Ans:
The SSIS Package Configuration provides a mechanism for externalizing and dynamically configuring SSIS package properties. It allows developers to store configurations, such as connection strings or variable values, outside the package, making it more flexible and adaptable to different environments. Configuration settings can be stored in XML files, SQL Server databases, environment variables, or other external sources. This feature is particularly useful when deploying SSIS packages across multiple servers or environments, as it enables easy modification of package behavior without altering the package itself.
11.Define SQL Server Analysis Services (SSAS):
Ans:
SQL Server Analysis Services (SSAS) is a Microsoft SQL Server component for creating multidimensional data models, facilitating advanced data analysis and reporting in business intelligence. It supports OLAP systems, including MOLAP and HOLAP, and is crucial for building data warehouses.
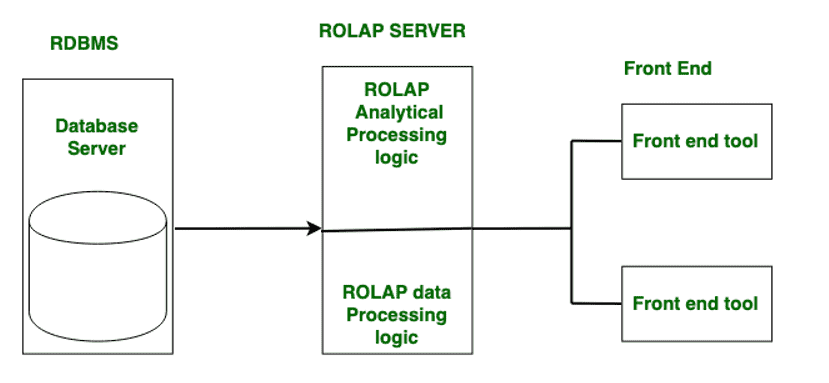
12. Define OLAP (Online Analytical Processing) and its types.
Ans:
OLAP (Online Analytical Processing) is a category of software tools for interactive multidimensional data analysis. It facilitates dynamic exploration and insight generation by allowing users to analyze data from different viewpoints. OLAP systems include types such as ROLAP (Relational OLAP), MOLAP (Multidimensional OLAP), and HOLAP (Hybrid OLAP). ROLAP uses relational databases, MOLAP employs proprietary multidimensional databases, while HOLAP combines elements of both. These systems play a crucial role in business intelligence, offering efficient ways to navigate and analyze complex datasets for informed decision-making.
13. What is a Cube in SSAS, and how is it different from a Data Warehouse?
Ans:
A cube in SSAS is a multidimensional structure that stores and organizes data for efficient analysis. It contains dimensions (attributes) and measures (quantitative values). A data warehouse, on the other hand, is a centralized repository for storing and managing large volumes of structured data, serving as the source for cubes. While a cube is specific to SSAS and represents a subset of data for analysis, a data warehouse is a comprehensive storage solution for various data sources.
14. Explain the difference between a Measure and a Dimension in SSAS.
Ans:
In SSAS, a measure is a quantitative value that represents a business metric, such as sales or revenue. Measures are the numeric data that users analyze. Dimensions, on the other hand, provide context to measures. They categorize and describe data, such as time, geography, or product categories. Measures are the numeric values being analyzed, while dimensions provide the criteria for organizing and filtering these measures.
15. What is a Hierarchical Dimension in SSAS?
Ans:
A hierarchical dimension in SSAS represents a structure where data is organized in a hierarchy, often with parent-child relationships. For example, a time dimension might have a hierarchy like Year > Quarter > Month. This allows for drill-down and roll-up capabilities, enabling users to navigate through data at different levels of granularity. Hierarchical dimensions enhance the organization and analysis of data in a way that mirrors natural business structures.
16. How do you optimize SSAS cube performance?
Ans:
To optimize SSAS cube performance :
- Employ efficient cube design, including proper aggregations.
- Manage partitions strategically for efficient processing.
- Choose suitable storage modes, such as MOLAP, ROLAP, or HOLAP.
- Utilize indexing and aggregations to enhance query performance.
17. Explain the purpose of the SSAS KPI (Key Performance Indicator).
Ans:
The SSAS Key Performance Indicator (KPI) serves to measure and evaluate business performance against predefined goals. It provides a visual representation of critical metrics, aiding in data analysis and decision-making.
18. Differentiate between a Role and a Perspective in SSAS.
Ans:
In SSAS, a Role defines security permissions for users, controlling access to data within a cube. A Perspective, on the other hand, organizes and presents specific cube objects to simplify user interactions. While Roles manage security, Perspectives enhance the user experience by offering a focused view of cube elements.
19. What is the purpose of the SSAS Dimension Usage tab?
Ans:
The SSAS Dimension Usage tab allows users to define relationships between dimensions and measure groups within a cube. It specifies how dimensions are related to one another and how they interact with measure groups. This tab is crucial for ensuring the correct behavior of the cube and enabling accurate multidimensional analysis.
20. How can you create Calculated Members in SSAS?
Ans:
To create calculated members in SSAS :
- Open the cube in SSAS.
- Navigate to the Calculations tab.
- Define the calculation script using MDX (Multidimensional Expressions) syntax.
- Save and process the cube to incorporate the calculated members.
21. Define SQL Server Reporting Services (SSRS):
Ans:
SQL Server Reporting Services (SSRS) is a Microsoft SQL Server component designed for creating, managing, and delivering interactive, tabular, and graphical reports. It provides a comprehensive set of tools for designing, deploying, and distributing reports, making it a powerful solution for business intelligence and data visualization. SSRS supports various report types, including parameterized reports, drill-down reports, and ad-hoc reports, enhancing the presentation and analysis of data in different formats.
22. Explain the role of the Report Designer in SSRS.
Ans:
The Report Designer in SSRS is a graphical tool used for creating and designing reports. It provides a user-friendly interface for adding data sources, designing report layouts, incorporating data visualizations, and defining parameters. The Report Designer plays a crucial role in the report development process, enabling users to create dynamic and informative reports for effective data communication.
23. How do you create drill-down reports in SSRS?
Ans:
To create drill-down reports in SSRS :
- Design a report with a grouping structure using the Report Designer.
- Implement toggles or drill-down actions on report items like text boxes or images.
- Set the visibility property to hide or show details based on user interaction.
- Use expressions or parameters to control the visibility of grouped data, allowing users to drill down into specific details as needed.
24. Design a report with a grouping structure using the Report Designer.
Ans:
Parameters in SSRS reports are user-defined input values that enhance report interactivity and flexibility. They allow users to customize report outputs by selecting values such as date ranges or categories. Parameters are defined in the Report Designer, and users can input values or choose from predefined options when running the report.
25. What are parameters in SSRS reports, and how are they used?
Ans:
Parameters in SSRS reports are user-defined input values that enhance report interactivity and flexibility. They allow users to customize report outputs by selecting values such as date ranges or categories. Parameters are defined in the Report Designer, and users can input values or choose from predefined options when running the report.
26. Explain the purpose of the SSRS Tablix control.
Ans:
The SSRS Tablix (Table Matrix) control is a versatile reporting tool that combines elements of tables and matrices. It allows dynamic handling of row and column groups, making it suitable for diverse data structures. The Tablix control is instrumental in creating complex reports with features like nested row and column groups, providing flexibility in presenting structured data.
27. How can you deploy SSRS reports?
Ans:
To deploy SSRS reports :
- Design the report using the Report Designer in SQL Server Data Tools.
- Save and build the report project.
- Deploy the report to a target SSRS server using the “Deploy” option in SQL Server Data Tools or by uploading the RDL file to the Report Manager.
- Configure data source connections on the server to ensure accurate report execution.
- Access the deployed report through a web browser or other SSRS viewing tools, depending on the server configuration.
28. Design the report using the Report Designer in SQL Server Data Tools.
Ans:
- Save and build the report project.
- Deploy the report to a target SSRS server using the “Deploy” option in SQL Server Data Tools or by uploading the RDL file to the Report Manager.
- Configure data source connections on the server to ensure accurate report execution.
- Access the deployed report through a web browser or other SSRS viewing tools, depending on the server configuration.
29. Differentiate between Report Server and Report Manager.
Ans:
Report Manager : Report Manager is a web-based interface for managing and organizing reports on the Report Server. It provides a user-friendly portal for accessing and organizing reports, setting security, and managing subscriptions.
Report Server : The Report Server is the core engine in SQL Server Reporting Services (SSRS) responsible for processing and rendering reports. It manages report subscriptions, security, and processing of report requests.
30. What is the purpose of the SSRS Report Builder?
Ans:
The SSRS Report Builder is a standalone tool designed for business users to create ad-hoc reports without extensive knowledge of SQL or the Report Designer. It offers a drag-and-drop interface for building reports, allowing users to design and customize reports with ease.
31. How can you implement caching in SSRS reports?
Ans:
To implement caching in SSRS reports :
- In Report Manager, navigate to the report’s properties.
- Go to the “Execution” tab and select “Use this report execution snapshot” under “Caching.”
- Set the cache refresh options based on a schedule or dependencies.
- Configure cache settings such as expiration and priority.
- Save the changes, and the report will use caching for improved performance by serving a cached version when applicable.
32. In Report Manager, navigate to the report’s properties.
Ans:
Table : Basic structure with rows and columns for organizing straightforward datasets.
Matrix : Dynamic structure allowing both row and column grouping, suitable for summarizing and aggregating multidimensional data.
33. Explain the difference between a Matrix and a Table in SSRS.
Ans:
A Data Warehouse Concept is a centralized repository storing structured data for efficient querying and analysis, supporting business intelligence, data analysis, and historical trend analysis. Slowly Changing Dimensions (SCD) in a data warehouse addresses how to handle changes in dimension attributes over time, ensuring accurate representation of historical data. SCD includes strategies like Type 1 (overwrite), Type 2 (add a new row), and Type 3 (add a new column) to manage evolving dimension data.
34. Explain General MSBI and Data Warehouse Concepts.
Ans:
A Data Warehouse Concept is a centralized repository storing structured data for efficient querying and analysis, supporting business intelligence, data analysis, and historical trend analysis. Slowly Changing Dimensions (SCD) in a data warehouse addresses how to handle changes in dimension attributes over time, ensuring accurate representation of historical data. SCD includes strategies like Type 1 (overwrite), Type 2 (add a new row), and Type 3 (add a new column) to manage evolving dimension data.
35. What is a Data Warehouse, and why is it used?
Ans:
Data Warehouse : A centralized repository storing structured data for efficient querying and analysis.
Purpose : Facilitates business intelligence, data analysis, integration, performance optimization, historical trend analysis, and scalability for informed decision-making.
36. Explain the concept of Slowly Changing Dimensions (SCD).
Ans:
Slowly Changing Dimensions (SCD) refer to techniques used in data warehousing to manage changes in dimension attributes over time. SCD is crucial when historical data needs to be preserved and accurately represented. Common strategies include Type 1 (overwrite existing data), Type 2 (add a new row for changes), and Type 3 (add a new column for changes).

Get Comprehensive Microsoft Business Intelligence Training to Build Your Skills
- Instructor-led Sessions
- Real-life Case Studies
- Assignments
37. Differentiate between Star Schema and Snowflake Schema.
Ans:
Star Schema : Involves a central fact table connected to multiple dimension tables in a simple, star-shaped structure. Offers simplicity and ease of query but may lead to redundancy.
Snowflake Schema : Extends the star schema by normalizing dimension tables, resulting in a more normalized, snowflake-shaped structure. Reduces redundancy but can complicate queries due to more joins.
38. How do you handle security in a Data Warehouse?
Ans:
To ensure security in a Data Warehouse :
- Role-Based Access Control (RBAC): Assign permissions based on user roles.
- Authentication and Authorization: Implement secure authentication mechanisms and restrict access to authorized users.
- Encryption: Encrypt sensitive data during transmission and storage.
- Audit Trails: Monitor and log user activities for auditing purposes.
- Row-Level Security: Implement security policies to control access to specific rows of data.
39. What is the role of indexing in a Data Warehouse?
Ans:
In a Data Warehouse, indexing plays a crucial role in optimizing query performance. Indexes are structures that enhance the speed of data retrieval operations by providing quick access to specific rows based on indexed columns. Proper indexing on dimensions and fact tables can significantly improve the efficiency of querying large datasets.
40. How can you optimize the performance of a Data Warehouse query?
Ans:
To optimize the performance of a Data Warehouse query :
Use Indexing : Implement appropriate indexes on key columns.
Partitioning : Divide large tables into smaller, manageable partitions.
Aggregate Tables : Pre-aggregate data to reduce the amount of data scanned.
Materialized Views : Create materialized views to store aggregated results.
Optimized SQL Queries : Write efficient SQL queries, avoiding unnecessary joins and aggregations.
41. Explain the concept of a Factless Fact Table.
Ans:
A Factless Fact Table is a type of fact table in a data warehouse that contains no numerical measures or facts. Instead, it captures relationships between dimensions, serving as a bridge to represent events or conditions. Factless Fact Tables are used to track events or activities that have significance in the business but do not involve measurable quantities. Examples include attendance tracking or relationship between entities without quantitative data.
42. What is the Kimball vs. Inmon approach in Data Warehousing?
Ans:
The Kimball approach advocates building independent data marts to swiftly address specific business needs, prioritizing flexibility and quick implementation. In contrast, the Inmon approach emphasizes constructing a centralized enterprise data warehouse (EDW) first, ensuring consistency and a unified version of the truth across the organization.
43. How do you handle historical data in a Data Warehouse?
Ans:
Managing historical data in a Data Warehouse involves employing techniques like Slowly Changing Dimensions (SCD), temporal tables, versioning, and data snapshots. These methods enable tracking changes over time, associating effective date ranges, and preserving historical versions of records for comprehensive historical analysis.
44. What is the purpose of Data Mart in the context of Data Warehousing?
Ans:
A Data Mart, as a subset of a data warehouse, serves specific business functions or user groups. It aims to enhance performance, simplify data access for end users, align with business units, and provide flexibility in adapting to changing business requirements. Data Marts contribute to a more targeted and efficient approach to data storage and retrieval within the broader context of a Data Warehouse.
45. What is the difference between INNER JOIN and LEFT JOIN?
Ans:
| Criteria | INNER JOIN | LEFT JOIN (or LEFT OUTER JOIN) | |
| Matched Rows |
Retrieves rows with matches |
Retrieves rows with matches. | |
| Unmatched Rows | Excludes unmatched rows | Includes unmatched rows with NULL values. | |
| Result Set | Contains only matched rows | Contains all rows from the left table, matched rows from the right table, and unmatched rows from the left table with NULL values for right table columns where there is no match. |
46. Explain the ACID properties of a database.
Ans:
The ACID properties—Atomicity, Consistency, Isolation, and Durability—are fundamental principles ensuring the reliability of database transactions. Atomicity guarantees transactions as indivisible units, Consistency maintains data integrity, Isolation prevents interference in concurrent transactions, and Durability ensures the permanence of committed transaction effects.
47. How do you optimize a SQL query for performance?
Ans:
Optimizing a SQL query involves several strategies: proper indexing, writing efficient queries, minimizing the use of wildcard characters, avoiding unnecessary columns, and considering database normalization. Techniques like caching and stored procedures, along with profiling and analyzing query execution plans, contribute to enhancing overall query performance.
48. What is the purpose of the NOLOCK hint in SQL Server?
Ans:
The NOLOCK hint, also known as READUNCOMMITTED, is used in SQL Server to implement an isolation level that allows a query to read data from a table without acquiring shared locks. While it can improve query performance by avoiding locks, it may lead to “dirty reads” where uncommitted changes by other transactions are visible.
49. Differentiate between a clustered and a non-clustered index.
Ans:
Clustered Index : Determines the physical order of data rows in a table based on the indexed columns. There can be only one clustered index per table, and it directly affects the way data is stored.Non-Clustered Index : Does not alter the physical order of data rows and maintains a separate structure to map index keys to the corresponding rows. Multiple non-clustered indexes can be created on a single table.
50. How do you monitor and troubleshoot SQL Server performance?
Ans:
To monitor and troubleshoot SQL Server performance :Use Performance Monitoring Tools : Utilize SQL Server Profiler and Performance Monitor to capture and analyze performance metrics.Examine Execution Plans : Review query execution plans to identify inefficiencies and optimize queries.Check Indexing : Ensure proper indexing to improve query performance.Review Wait Stats : Analyze wait statistics to identify bottlenecks and areas of contention.
51. What is a SQL Server Agent, and how is it used?
Ans:
SQL Server Agent is a vital component in Microsoft SQL Server designed for automating scheduled tasks and jobs within a database. It simplifies the management of routine activities, such as backups and maintenance, by providing a centralized platform for scheduling, executing, and monitoring various database-related jobs.
52. Explain the concept of normalization in databases.
Ans:
Normalization in databases is the systematic organization of data to eliminate redundancy and dependency. This process involves breaking down large tables into smaller, related tables and establishing relationships between them. By adhering to normal forms like 1NF, 2NF, and 3NF, normalization aims to improve data integrity, minimize update anomalies, and reduce data duplication.
53. How do you handle concurrent access to a database?
Ans:
To manage concurrent access to a database, several strategies are employed. Transactions, encapsulating related operations, ensure atomicity and consistency. Isolation levels, such as Read Committed or Repeatable Read, control the visibility of changes between transactions. Optimistic concurrency control detects conflicts during updates, while pessimistic control uses locks to restrict access. Techniques like timestamps or versioning track changes, and connection pooling efficiently manages concurrent user connections. Efficient application design and connection pooling help minimize transaction duration and reduce unnecessary contention in a concurrent database environment.
54. What is the purpose of the SQL Server Profiler?
Ans:
The SQL Server Profiler is a monitoring tool designed to capture and analyze events in the SQL Server database. It helps database administrators and developers trace queries, stored procedures, and other activities, providing valuable insights for performance tuning and issue diagnosis. This tool is essential for optimizing SQL Server databases by identifying bottlenecks and improving overall database efficiency.
55. How can you schedule SSIS packages for execution?
Ans:
To schedule SSIS packages for execution, utilize SQL Server Agent. First, create a new SQL Server Agent Job in SQL Server Management Studio (SSMS). Add a job step, specifying the SSIS package to execute. Set the desired schedule for the job, such as daily or weekly intervals. Optionally, configure notifications for job status changes. Save the job configuration, and SQL Server Agent will execute the SSIS package according to the defined schedule, automating data integration tasks efficiently.
56. What are SSRS (SQL Server Reporting Services) and its key components?
Ans:
SQL Server Reporting Services (SSRS) is a Microsoft reporting platform comprising key components such as the Report Server (managing and processing reports), Report Builder (design tool), Report Designer (integrated tool within Visual Studio), Report Manager (web-based interface), and essential elements like Data Sources and Datasets for connecting to and retrieving data.
57. How do you create and deploy SSRS reports?
Ans:
To create and deploy SSRS reports, utilize tools like Report Builder or Report Designer. Design the report layout, define data sources and datasets, and add visual elements. Once the report is ready, deploy it using SQL Server Management Studio or Visual Studio to a target SSRS server. Configuration of data sources on the server ensures accurate report execution.
58. Explain the purpose of Tablix in SSRS.
Ans:
A Tablix in SSRS combines features of a table and matrix, providing a versatile structure for displaying data. It allows dynamic handling of row and column groups, making it suitable for a wide range of report layouts. Tablix is instrumental in creating flexible reports, accommodating varying data structures, and supporting complex grouping and aggregation requirements.
59. What are SSRS parameters, and how are they used in report development?
Ans:
SSRS parameters are user-defined variables that allow dynamic report customization. They can be used to filter, sort, or manipulate data based on user input. Parameters enhance interactivity by enabling users to specify criteria, such as date ranges, regions, etc. Parameters are defined during report creation and can be linked to query parameters, making reports adaptable to varying requirements.

Advance Your Skills with Microsoft Business Intelligence Certification Course
Weekday / Weekend BatchesSee Batch Details60. Differentiate between Shared Data Sources and Embedded Data Sources in SSRS.
Ans:
Shared Data Sources : These are centralized connections to data that can be shared across multiple reports. Changes to a shared data source reflect universally, simplifying maintenance. Shared data sources are managed at the report server level and can be reused across multiple reports.
Embedded Data Sources : Embedded data sources are specific to a particular report. They are stored within the report definition, making the report self-contained. Changes to embedded data sources affect only the specific report. While embedded data sources offer report-level autonomy, shared data sources promote consistency and reusability across reports.
61. What is Report Builder in SSRS, and how is it different from SQL Server Data Tools?
Ans:
Report Builder in SSRS is a user-friendly tool for ad-hoc report creation, emphasizing simplicity. In contrast, SQL Server Data Tools in Visual Studio caters to developers for more complex and extensive report development. While both are used for SSRS report creation, Report Builder targets business users, while SQL Server Data Tools provides a comprehensive environment for developers.
62. Define SSAS (SQL Server Analysis Services) Perspectives and why they are useful.
Ans:
SSAS Perspectives organize multidimensional data models into logical views, offering customized subsets for different user groups. They simplify cube navigation and analysis by presenting context-specific views tailored to users’ needs, enhancing usability in scenarios with diverse dimensions and measures.
63. How do you implement partitioning in SSAS cubes for better performance?
Ans:
Partitioning in SSAS involves dividing large cubes into manageable segments, enhancing query performance. Identify key segments, create partitions based on criteria, implement aggregations, set storage modes, and manage independent processing to optimize data refreshes. Partitioning minimizes data scanned for each query, particularly beneficial in large-scale SSAS cubes.
64. Define the roles of Data Mining and Predictive Analytics in SSAS.
Ans:
In SSAS, Data Mining uncovers patterns, while Predictive Analytics forecasts future trends using statistical algorithms. Together, they empower advanced analytics, aiding decision-making with historical and predictive insights.
65.Explain the role of the SSIS Catalog in SQL Server Integration Services.
Ans:
The SSIS Catalog serves as a centralized repository in SSIS, managing deployment, versioning, and execution of packages. It streamlines package management, offering a framework for organization, security, and monitoring.
66.What are the advantages of using SSIS over traditional ETL tools?
Ans:
SSIS excels with seamless Microsoft ecosystem integration, a user-friendly visual interface, a wide range of built-in transformations, support for parallel execution, robust scripting capabilities, and comprehensive logging and monitoring features.
67. Define the concept of dimension hierarchies in SSAS.
Ans:
In SSAS, dimension hierarchies organize dimensional attributes within a cube, defining relationships and order among levels, enhancing structured data analysis.
68. How do you handle slowly changing dimensions in SSIS?
Ans:
To address Slowly Changing Dimensions in SSIS, adopt strategies like Type 1 (Overwrite), Type 2 (Historical), or Type 3 (Add New Columns) based on business requirements, preserving historical context in dimensional data.
69. Explain the concept of Change Data Capture (CDC) in the context of SSIS.
Ans:
Change Data Capture (CDC) in SSIS is a technique used to identify and capture changes made to source data. It enables the extraction of only the modified data, reducing the volume of data transferred during ETL processes. SSIS CDC involves capturing changes using system-defined tables and then processing and loading the changes into the destination, ensuring that only the relevant data changes are considered for further actions.
70. What is the role of the Data Source View (DSV) in SSAS?
Ans:
The Data Source View (DSV) in SQL Server Analysis Services (SSAS) serves as an abstraction layer between the underlying data source and the data warehouse model. It provides a unified and simplified view of the data source’s schema, allowing SSAS developers to design cubes and dimensions without directly interacting with the complex source schema. DSV enhances the efficiency of cube design by presenting a logical and organized perspective of the data.
71.How can you use the SSIS Execute SQL Task for database operations?
Ans:
The SSIS Execute SQL Task is a versatile component allowing the execution of SQL statements or stored procedures within an SSIS package. It is commonly used for various database operations such as inserting, updating, deleting, or retrieving data. To use the Execute SQL Task, configure the connection to the database, specify the SQL statement or stored procedure to execute, and handle the result set if applicable. This task is valuable for integrating SQL operations seamlessly within SSIS workflows, enabling efficient database interactions during ETL processes.
72. Define the concept of data profiling and how it can be achieved in SSIS.
Ans:
Data profiling in SSIS involves the analysis of data to understand its structure, quality, and characteristics. It helps identify patterns, anomalies, and inconsistencies in the data source. SSIS provides data profiling tasks and transformations that can be employed to assess data completeness, uniqueness, and distribution. By using these tools, developers gain insights into data quality and can make informed decisions on cleansing and transformation processes during ETL.
73. How do you implement data compression in SSAS cubes?
Ans:
In SSAS, data compression is a technique used to optimize storage and improve query performance. It involves reducing the storage space required for cube data while maintaining query efficiency. Compression can be achieved in SSAS cubes by configuring the storage settings for each partition. Options include MOLAP (Multidimensional OLAP) and ROLAP (Relational OLAP) storage modes. MOLAP uses a combination of run-length encoding and dictionary compression, while ROLAP relies on the relational database’s compression capabilities.
74. Explain the concept of drill-through actions in SSRS.
Ans:
Drill-through actions in SQL Server Reporting Services (SSRS) allow users to navigate from a summary report to a detailed report, providing additional information. By defining drill-through actions, report developers can link summary data to a detailed report, allowing users to explore more granular information. Drill-through actions are configured in SSRS by specifying parameters and target reports, providing an interactive experience for users to analyze data in-depth while maintaining a summarized overview.
75. What are the benefits of using Data Mart in a Data Warehouse architecture?
Ans:
Data Marts in a Data Warehouse architecture offer targeted advantages. By storing specific data subsets, they provide focused views for individual business units or departments. This focus enhances query performance, as data retrieval is optimized for specific needs. Data Marts also contribute to scalability, allowing for independent modifications to accommodate evolving business requirements. Simplifying access, they empower users to retrieve relevant data without navigating the entire Data Warehouse, streamlining decision-making processes.
76. How can you secure SSAS cubes, and what authentication mechanisms are available?
Ans:
Securing SSAS cubes is critical for data confidentiality. One key authentication mechanism is Windows Authentication, leveraging existing Windows user accounts for access control. Additionally, SSAS supports other authentication modes like SQL Server Authentication and Azure Active Directory for broader compatibility. These mechanisms ensure that only authorized users can access and manipulate the data within SSAS cubes, maintaining the integrity and security of analytical insights.
77. What is the role of the SSIS Expression Task, and how is it used in ETL processes?
Ans:
The SSIS Expression Task is pivotal in ETL processes, empowering dynamic data transformations. It allows the creation and evaluation of expressions, enabling the modification of data values, the creation of derived columns, or the conditional branching of data flow paths. Its flexibility enhances adaptability in ETL workflows, accommodating changes in requirements or variations in incoming data.
78. Explain the concept of named calculations in SSAS and their significance.
Ans:
Named calculations in SSAS refer to user-defined calculations within a Data Source View (DSV) in a cube. These calculations create additional derived measures based on existing columns in the source data. Significantly, named calculations extend the data model by introducing custom business logic or aggregations not present in the original dataset, enriching the analytical capabilities of the SSAS cube
79. How can you optimize the performance of SSRS reports containing large datasets?
Ans:
To optimize SSRS reports with large datasets, various strategies can be employed. Enabling server-side pagination ensures the retrieval and display of only necessary data, enhancing report rendering speed. Efficient SQL queries, aggregating data at the source, and implementing report caching minimize server load. Limiting visible data in report elements and considering asynchronous rendering contribute to an improved user experience by presenting partial results and maintaining responsiveness.
80. Define the concept of a Role in SSAS, and how does it control access to cube data?
Ans:
In SSAS, a role is a key element for data access control, defining permissions for users or groups. By assigning members to roles, administrators ensure that users have access to specific cube data and functionalities based on their roles. Roles play a critical role in maintaining data security and privacy within SSAS cubes, offering granular control over user interactions.
81. What is the significance of the SSIS Checkpoint feature, and when would you use it?
Ans:
The SSIS Checkpoint feature is essential for resuming interrupted package executions by saving the package’s state at specified intervals. When package execution fails or is interrupted, the Checkpoint allows it to restart from the last successfully completed task, enhancing reliability in long-running ETL processes prone to interruptions due to network issues or system failures.
82. Explain the use of the Data Profiling task in SSIS and its impact on data quality.
Ans:
The Data Profiling task in SSIS analyzes data quality by identifying patterns, anomalies, and issues like missing values. Providing insights into data characteristics, it assists developers and data stewards in designing effective cleansing and transformation processes. The impact on data quality is substantial, as organizations gain a comprehensive understanding of data metrics, facilitating informed decisions for data improvement and maintenance.
83. What is MSBI?
Ans:
MSBI, or Microsoft Business Intelligence, is a suite of tools designed by Microsoft for business intelligence solutions. Comprising three key components – SQL Server Integration Services (SSIS), SQL Server Analysis Services (SSAS), and SQL Server Reporting Services (SSRS) – MSBI enables efficient data integration, multidimensional analysis, and report generation. SSIS handles data workflows, SSAS manages online analytical processing (OLAP) cubes, and SSRS is focused on creating visual reports. It provides a comprehensive solution for data warehousing, analytics, and reporting needs in various business environments.
84. Explain the purpose of SSIS.
Ans:
SSIS (SQL Server Integration Services) is a vital data integration tool in Microsoft’s Business Intelligence suite. Its main purpose is ETL (Extract, Transform, Load) for seamless data movement between different sources and destinations. SSIS enables the design and automation of intricate data workflows, crucial for maintaining accurate and consistent data. It plays a key role in data migration, cleansing, and orchestrating various data processes. As an integral part of MSBI, SSIS is essential for efficient data management and integration in business intelligence solutions.
85. Explain the purpose of SSIS.
Ans:
SSIS (SQL Server Integration Services) is dedicated to data integration and ETL processes, ensuring smooth data movement and automation. It orchestrates complex workflows for maintaining data accuracy.
SSRS (SQL Server Reporting Services), on the other hand, specializes in reporting and visualization, generating visual reports from integrated data. Both are integral components of Microsoft’s Business Intelligence suite, serving distinct aspects of data management and reporting.
86. What are the key components of SSIS?
Ans:
Key components of SSIS include the Control Flow for workflow management and task execution sequencing. The Data Flow manages data movement and transformations. Connection Managers handle connections to data sources. Event Handlers respond to specific events during package execution. Package Explorer organizes various elements within a package, providing a structured view. These components collectively enable the design and execution of efficient data integration workflows.
87. What is a SSRS report parameter?
Ans:
An SSRS (SQL Server Reporting Services) report parameter is a user-defined input enabling customization and filtering of report data. Users can input specific values like date ranges or categories, enhancing interactivity. Parameters make reports dynamic and adaptable to user preferences. They contribute to creating versatile and user-friendly reports by allowing tailored data output.
88. Explain the concept of a data warehouse and its role in business intelligence.
Ans:
A data warehouse is a centralized repository for structured and unstructured data, pivotal in business intelligence. It offers a consolidated, historical view, facilitating analysis and informed decision-making. Serving as a foundation for reporting and analytics, it provides insights into long-term business trends and performance. The structured design and optimized querying set it apart from transactional databases, making it integral for organizations seeking comprehensive data-driven strategies.
89. What is a cube in the context of SQL Server Analysis Services (SSAS)?
Ans:
In SSAS, a cube is a multidimensional data structure for efficient analysis across multiple dimensions. It enables intuitive exploration of complex relationships. Unlike traditional databases, cubes organize data for optimized analytical processing rather than transactional operations. Cubes support OLAP (Online Analytical Processing) for in-depth data exploration, offering a different paradigm from the tabular structure of traditional databases.
90. How can you optimize the performance of SSIS packages
Ans:
To optimize SSIS (SQL Server Integration Services) package performance :
- Opt for efficient transformations and minimize data movement.
- Use appropriate indexing and sorting in data sources.
- Utilize batch commits and avoid row-by-row operations.
- Employ parallel processing for concurrent tasks.
- Optimize memory usage and configure buffer sizes.
- Utilize logging and performance monitoring for continuous improvement.