Last updated on 04th Jul 2020| 9430
SSAS (SQL Server Analysis Services) is a Microsoft tool used for online analytical processing (OLAP) and data mining. It enables organizations to create, manage, and deploy analytical models for business intelligence solutions. SSAS supports both multidimensional and tabular models, providing powerful capabilities for data analysis and reporting. It integrates seamlessly with other Microsoft BI tools like Power BI, Excel, and SharePoint, facilitating advanced analytics and decision-making processes across enterprises.
1. What is SQL Server Analysis Services (SSAS)?
Ans:
SQL Server Analysis Services (SSAS) is Microsoft’s robust platform designed for online analytical processing (OLAP) and data mining. It empowers organizations to not only create, manage, and analyze but also to visualize complex data sets using multidimensional structures known as cubes. These cubes serve as foundational elements that facilitate comprehensive data analysis and enable deep insights into business intelligence.
2. What constitutes the SQL SAS Model?
Ans:
The SQL Server Analysis Services (SSAS) model is a framework that includes databases storing both metadata and data for multidimensional structures like cubes, dimensions, measure groups, and calculated members. It also involves data sources and data source views, collectively defining relationships essential for optimizing OLAP queries and supporting advanced data mining, enabling powerful insights and decision-making.
3. Define the Power BI framework.
Ans:
- Power BI, developed by Microsoft, is a comprehensive suite of business analytics tools designed to empower organizations with actionable insights from their data.
- It seamlessly integrates with a wide array of data sources, allowing for robust data ingestion and transformation capabilities.
- Through its components such as Power Query for data preparation, Power Pivot for data modeling, and Power View for interactive visualization, Power BI enables users to create compelling dashboards and reports.
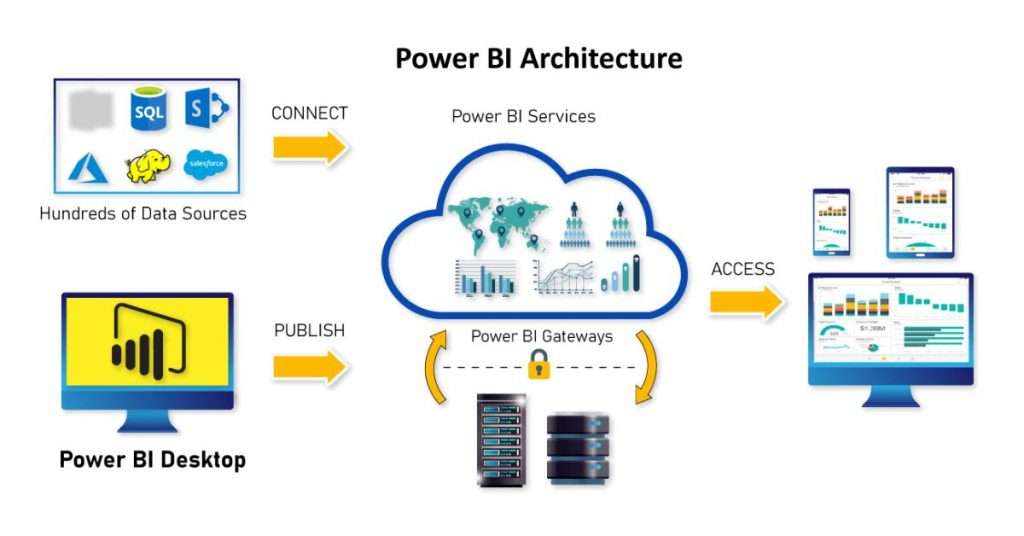
4. What function does Power BI serve in BI architecture?
Ans:
- Power BI occupies a central position in BI architecture due to its multifaceted capabilities.
- It serves as a comprehensive toolset enabling organizations to seamlessly prepare and transform raw data from diverse sources into meaningful insights.
- Through advanced data modeling techniques, Power BI facilitates the creation of sophisticated analytical models that underpin interactive reports and visually compelling dashboards.
5. What technologies are fundamental in SSAS projects?
Ans:
Key technologies in SQL Server Analysis Services (SSAS) projects encompass a range of capabilities essential for robust data analysis and business intelligence. These include OLAP (Online Analytical Processing), which enables multidimensional analysis by structuring data into dimensions and measures optimized for complex queries. Data mining further enhances SSAS by employing algorithms for predictive analytics, uncovering patterns and trends in data to support informed decision-making.
6. Define a CUBE in SQL Server Analysis Services.
Ans:
A cube in SQL Server Analysis Services (SSAS) is a multidimensional structure used for advanced data analysis and business intelligence. It organizes data into dimensions like time, geography, or product lines, and measures business metrics such as sales or revenue. By storing pre-aggregated data, cubes enhance performance for OLAP (Online Analytical Processing) queries, allowing fast aggregation and complex analysis across various hierarchies, levels, and member attributes.
7. In SSAS, what defines dimension tables?
Ans:
- Dimension tables in SQL Server Analysis Services (SSAS) play a critical role in organizing and categorizing business entities such as products, customers, or time within a data warehouse or OLAP cube.
- These tables encapsulate descriptive attributes that provide context for the measures stored in fact tables.
- By establishing hierarchical relationships and defining levels within dimensions, SSAS enables users to efficiently analyze data through operations like slicing (selecting specific dimensions), dicing (zooming into subsets of data), and filtering.
8. Elaborate on Data Mining Architecture & Techniques.
Ans:
- Data Mining in SQL Server Analysis Services (SSAS) is a comprehensive process aimed at extracting valuable patterns and relationships from extensive datasets.
- It begins with data preparation, where raw data is collected, cleaned, and transformed into a suitable format for analysis.
- Next, data modeling involves selecting algorithms and techniques like clustering, classification, and regression to uncover hidden patterns and predict future trends.
9. How does OLAP differ from OLTP?
Ans:
| Feature | OLAP (Online Analytical Processing) | OLTP (Online Transaction Processing) |
|---|---|---|
| Purpose | Analyze historical data for decision support and business intelligence | Manage real-time transactional data processing |
| Use Cases | Data analysis, reporting, business forecasting | Order processing, customer relationship management |
| Database Design | Star or snowflake schema; optimized for reads and complex queries | Normalized schema; optimized for writes and quick lookups |
| Query Type | Complex queries involving aggregations and summaries | Simple queries retrieving or modifying individual records |
10. Define a Data Source and enumerate SSAS-supported data sources.
Ans:
A Data Source in SQL Server Analysis Services (SSAS) refers to external databases or data warehouses from which data is imported and queried for analytical processing. SSAS supports various data sources, including SQL Server, Oracle, Excel, OLE DB, ODBC, XML files, and SharePoint lists. These sources help build multidimensional cubes and conduct data analysis, enabling organizations to derive business insights for informed decision-making and strategic planning.
11. What is Impersonation in SSAS?
Ans:
Impersonation in SSAS refers to the capability to execute operations using the security context of a different user or account. It allows SSAS to access data sources and perform operations based on the permissions of a specified user, rather than the service account. This is crucial for ensuring that data access adheres to security policies and permissions defined at the data source level.
12. What are the various impersonation choices provided by SSAS?
Ans:
- Use the service account: Executes operations using the SSAS service account credentials.
- Impersonate the authenticated user: Uses the credentials of the user accessing the SSAS service.
- Specify a fixed Windows account: Executes operations using a specific Windows account’s credentials.
- Specify a fixed username and password: Uses a specified username and password for data access.
13. Define Data Source View.
Ans:
- A Data Source View (DSV) in SSAS is a logical representation of data sources used to design cubes and dimensions.
- It provides a unified view of tables, views, and relationships from one or more data sources.
- DSVs simplify cube and dimension design by abstracting the underlying data schema, allowing developers to focus on defining business logic and relationships rather than navigating complex database structures directly.
14. Explain UDM and its importance in SSAS.
Ans:
UDM (Unified Dimensional Model) in SSAS is a semantic model that provides a consistent and integrated view of data from disparate sources. It facilitates intuitive and efficient data analysis through its dimensional structure, supporting OLAP operations like slicing, dicing, and drill-down. UDM enhances decision-making by enabling users to explore and analyze data in a meaningful and structured manner, ensuring consistency and accuracy across reports and analyses.
15. Why is the SSAS component necessary?
Ans:
The SSAS (SQL Server Analysis Services) component is essential for building and managing analytical solutions, including OLAP cubes, data mining models, and semantic models. It provides capabilities for multidimensional and tabular data modeling, enabling businesses to perform complex analytics and gain insights from large datasets. SSAS enhances data accessibility, performance, and security in BI environments, supporting informed decision-making and strategic planning.
16. Detail the Two-Tier Architecture of SSAS.
Ans:
- Client Tier: Where end-users interact with SSAS through applications like Excel or custom BI tools.
- Server Tier: Where SSAS processes and stores data, including components like the Analysis Services engine, storage engine, and data source access layer.
- This architecture separates user interaction from data processing and storage, ensuring scalability, performance, and flexibility in BI deployments.
17. Which programming languages are utilized in SSAS?
Ans:
- MDX (Multidimensional Expressions): For querying and manipulating multidimensional data.
- DAX (Data Analysis Expressions): For querying and modeling data in Tabular models.
- XMLA (XML for Analysis): For managing and querying SSAS objects programmatically.
18. How are Cubes created and managed in SSAS?
Ans:
- Designing dimensions and measures in a Data Source View (DSV).
- Defining cube structures, including dimensions, measures, and hierarchies.
- Processing cubes to load data from source systems.
- Deploying cubes to make them available for end-user querying and analysis.
- SSAS provides tools and interfaces for designing, deploying, and managing cubes effectively.
19. What are the responsibilities of an Analysis Services Information Worker?
Ans:
Developing and maintaining SSAS cubes and models. Creating and optimizing MDX or DAX queries for data analysis. Collaborating with business users to understand analytical requirements. Implementing security measures and access controls in SSAS. Monitoring cube performance and optimizing data processing. Providing training and support to end-users on SSAS functionalities.
20. Define processing in the context of SSAS.
Ans:
Processing in SSAS refers to the operation of loading data into cubes, dimensions, and mining models from the underlying data sources. It involves several tasks such as:
- Reading data from source systems.
- Transforming and aggregating data as per defined business rules.
- Storing processed data in SSAS storage structures.
- Updating metadata and internal structures to reflect changes.
21. What are the different types of SSAS models?
Ans:
Multidimensional and Tabular. Multidimensional models use OLAP cubes with dimensions and measures. Tabular models are in-memory databases compressed to fit into memory. Multidimensional models excel in complex business logic and large datasets. Tabular models offer faster querying and simpler data modeling. Choosing between them depends on performance needs and data complexity. Both models integrate with Power BI and other BI tools for analysis and reporting.
22. Explain the concept of a measure group in SSAS.
Ans:
A measure group in SSAS organizes related measures within a cube or tabular model. It consists of measures that share the same granularity and dimensions. Measure groups define the core metrics for analysis, such as sales or revenue. Each measure within a group represents a specific quantitative value. Measure groups are crucial for defining the analytical focus of a model. They are designed to optimize query performance and analytical capabilities.
23. How does SSAS handle security and permissions?
Ans:
- SSAS manages security through roles that define access to data and capabilities.
- Roles can be assigned to users or groups within Windows or Active Directory.
- Permissions control access to specific cubes, dimensions, or data sets.
- Security can be set at various levels, including cell-level security for sensitive data.
24. What is the difference between a calculated column and a calculated measure in SSAS?
Ans:
- A calculated column in SSAS Tabular adds a new column to a table using DAX expressions.
- It computes values based on other columns within the same row.
- Calculated columns are stored and can be reused in calculations and visualizations.
- A calculated measure, on the other hand, computes aggregate values like sums or averages.
25. Describe the process of creating a partition in SSAS.
Ans:
Partitioning in SSAS involves dividing cube or tabular model data into manageable segments. It improves query performance and facilitates incremental updates. To create a partition, define a partition design based on data distribution. Specify source data, such as tables or views, and define partition storage settings. Configure processing options and set partition query bindings. Validate and deploy the partition within the SSAS environment.
26. What are perspectives in SSAS and how are they used?
Ans:
Perspectives in SSAS provide simplified views of cube data for specific user roles. They allow different user groups to focus on relevant aspects of the data model. Perspectives hide unnecessary complexities and present only relevant dimensions and measures. Users can access perspectives through client tools like Excel or Power BI. Perspectives streamline data access and enhance user experience in BI reporting. They ensure data security by limiting visibility to authorized dimensions and measures.
27. What is MDX (Multidimensional Expressions) and how is it used in SSAS?
Ans:
- MDX is a query language used to retrieve data from multidimensional SSAS models.
- It supports complex analytical queries, including aggregations and calculations.
- MDX queries navigate hierarchies and dimensions to retrieve specific data sets.
- The language includes functions for data manipulation and calculation.
- MDX queries are written within client applications or SSMS for analysis.
28. Explain the concept of a parent-child hierarchy in SSAS.
Ans:
- A parent-child hierarchy in SSAS represents relationships between data points where each member has a direct relationship with their parent and children.
- It’s typically used for organizational structures like hierarchical reporting or budget planning.
- Unlike regular hierarchies, parent-child hierarchies don’t have predefined levels.
- They can have variable depth and are more flexible for representing irregular data structures.
29. What is proactive caching in SSAS and when would you use it?
Ans:
30. How does SSAS handle aggregations and why are they important?
Ans:
Aggregations in SSAS pre-calculate summarized data to accelerate query performance. They reduce query response time by accessing pre-computed aggregate values. Aggregations are created based on cube design and usage patterns. They optimize query execution for commonly requested data summaries. Aggregation design impacts cube processing time and storage requirements. Managing aggregations involves balancing cube performance with storage efficiency.
31. What is the role of a Data Mining Model in SSAS?
Ans:
- Data mining models in SSAS analyze large datasets to discover patterns and relationships that can be used for predictive analytics.
- They enable businesses to make informed decisions based on historical data trends and future predictions.
- These models use algorithms like decision trees, clustering, and neural networks to uncover insights and support strategic planning and forecasting efforts.
32. Describe the steps involved in deploying an SSAS project.
Ans:
- Deploying an SSAS project involves several key steps. First, the project is developed and tested locally.
- Next, metadata and data are prepared for deployment. Then, the project is deployed to the SSAS server using SQL Server Data Tools or Management Studio.
- After deployment, permissions and roles are configured for access control.
- Finally, the cube or model is processed to ensure data integrity and availability for end users.
33. How does SSAS integrate with other Microsoft BI tools like Power BI and Excel?
Ans:
SSAS integrates seamlessly with Power BI and Excel through data connections. Power BI can directly connect to SSAS models, allowing users to create interactive reports and dashboards. Excel supports connecting to SSAS cubes or tabular models, enabling users to analyze and visualize data using PivotTables, PivotCharts, and other Excel features. This integration ensures consistency and accuracy of data across different BI tools.
34. What is the difference between Tabular and Multidimensional models in SSAS?
Ans:
Tabular models in SSAS are relational and columnar databases that store data in tables similar to SQL databases. They are simpler to develop and maintain, suitable for smaller datasets, and use DAX (Data Analysis Expressions) for calculations. Multidimensional models, on the other hand, use OLAP cubes with dimensions and measures, supporting complex hierarchies and advanced analytics with MDX (Multidimensional Expressions). They are ideal for large datasets requiring deep analytical capabilities.
35. Explain the concept of a role in SSAS and how it controls access to data.
Ans:
- In SSAS, roles define permissions and access levels for users or groups to interact with cubes or tabular models.
- Roles can restrict access to specific data, measures, or actions based on user roles such as administrators, analysts, or viewers.
- By assigning roles, organizations ensure data security and compliance, allowing only authorized users to view and analyze relevant information without compromising sensitive data.
36. How does SSAS handle incremental processing and why is it useful?
Ans:
- Incremental processing in SSAS updates only the changed or new data since the last processing, minimizing processing time and resource usage.
- It enhances performance by focusing on delta changes rather than processing the entire dataset repeatedly.
- This method is useful for handling large datasets and frequent updates, maintaining data freshness and responsiveness for end users without unnecessary overhead.
37. What are calculated members in SSAS and how are they created?
Ans:
Calculated members in SSAS are custom calculations derived from existing measures or dimensions to provide additional insights or metrics. They are created using MDX (Multidimensional Expressions) or DAX (Data Analysis Expressions) in Tabular models. Calculated members can perform complex calculations, apply business logic, or define new aggregations that are not directly stored in the database. They enhance analytical capabilities by tailoring data analysis to specific business requirements.
38. Describe the process of partitioning a cube in SSAS.
Ans:
39. What are Actions in SSAS and how are they used?
Ans:
- Actions in SSAS define user interactions or navigation paths within cubes or tabular models.
- They allow users to perform predefined actions such as navigating to related data, opening URLs, or executing commands.
- Actions are created during model design and can be associated with specific dimensions or measures.
- They enhance user experience by providing intuitive navigation and contextual insights within BI reports and applications, improving data accessibility and usability.
40. How does SSAS handle data compression and storage optimization?
Ans:
- SSAS uses various compression techniques to reduce storage requirements and improve query performance. It compresses data by eliminating redundant values, storing unique data points, and applying efficient encoding methods.
- SSAS also supports storage modes like MOLAP (Multidimensional OLAP) and Tabular mode, each with specific compression algorithms tailored to maximize storage efficiency and query responsiveness.

Get JOB SSAS Training for Beginners By MNC Experts
- Instructor-led Sessions
- Real-life Case Studies
- Assignments
41. Explain the concept of perspectives in SSAS and when are they used.
Ans:
Perspectives in SSAS allow you to define subsets of cube objects visible to specific user roles. They are used to simplify cube navigation and provide focused views tailored to different user groups, such as departments or regions. Perspectives enhance usability by reducing complexity and improving user accessibility to relevant data without exposing unnecessary details.
42. What is the role of Key Performance Indicators (KPIs) in SSAS?
Ans:
Key Performance Indicators (KPIs) in SSAS measure the performance of business goals against predefined targets. They provide actionable insights into business performance and help monitor progress towards objectives. KPIs enable decision-makers to quickly assess performance trends using visual indicators, fostering informed decisions based on real-time data analysis.
43. How does SSAS integrate with SQL Server Reporting Services (SSRS)?
Ans:
- SSAS integrates seamlessly with SQL Server Reporting Services (SSRS), enabling rich data visualization and reporting capabilities.
- SSRS reports can directly query SSAS cubes, leveraging OLAP data for interactive reports and dashboards.
- This integration enhances data-driven decision-making by providing users with comprehensive, interactive reports based on multidimensional data models.
44. What is the role of Data Source Views (DSVs) in SSAS projects?
Ans:
- Data Source Views (DSVs) in SSAS abstract the complexity of underlying data sources by defining logical data structures used in cube design.
- They provide a simplified, unified view of heterogeneous data sources, facilitating efficient cube development and maintenance.
- DSVs enable data architects to model data relationships and hierarchies essential for building robust multidimensional models.
45. How does SSAS handle translations and localization?
Ans:
SSAS supports translations by enabling metadata and data to be presented in different languages based on user preferences or regional settings. This localization capability ensures that users across different regions can access and understand data presented in their preferred language. SSAS manages translations through language-specific metadata and data mappings, enhancing global usability and user adoption.
46. Explain the difference between a Role-playing dimension and a Fact dimension in SSAS.
Ans:
A Role-playing dimension in SSAS refers to a dimension table that serves multiple roles or perspectives within a cube, such as the Date or Time dimension used for different analysis contexts. In contrast, a Fact dimension directly corresponds to a fact table, providing specific measures and attributes related to a particular business process or scenario. Role-playing dimensions offer flexibility in analyzing data from different perspectives without duplicating dimension tables.
47. What are the different processing options available in SSAS and when are they used?
Ans:
- SSAS provides different processing options such as Full, Incremental, and Process Data.
- Full processing rebuilds all cube data from scratch, Incremental updates only modified data, and Process Data validates and processes data without altering the cube structure.
- Choosing the right processing option ensures cube data remains accurate and up-to-date while minimizing processing time and resource utilization.
48. Describe the process of deploying an SSAS cube to production.
Ans:
- Deploying an SSAS cube to production involves packaging and deploying cube objects and metadata to a target server environment.
- This process ensures that the cube is accessible to users and applications for analysis and reporting purposes.
- It typically involves validating the cube structure, configuring security settings, and performing deployment testing to ensure functionality and performance in the production environment.
49. How does SSAS support drill-through actions and what are their benefits?
Ans:
SSAS supports drill-through actions that allow users to access detailed transactional data underlying aggregated measures in cubes. Drill-through actions enable deep data exploration by providing context-sensitive links to source transactional data, enhancing analytical insights, and facilitating root cause analysis. This capability empowers users to investigate data anomalies and make informed decisions based on detailed information.
50. What is the role of partitions in SSAS and how are they managed?
Ans:
Partitions in SSAS optimize cube processing and query performance by dividing cube data into manageable segments. They enable parallel processing of cube data and facilitate incremental updates without impacting the entire cube. Partitions are managed based on criteria such as date ranges or geographical regions, ensuring efficient data storage and retrieval while maintaining optimal cube performance.
51. Explain the concept of a named calculation in SSAS.
Ans:
- A named calculation in SSAS allows for the creation of custom computations using expressions based on existing columns within a data source view.
- These calculations can include arithmetic operations, string manipulations, or conditional logic to derive new values.
- Named calculations generate derived measures or calculated members in cubes, enhancing analytical capabilities without modifying the underlying data source.
52. How does SSAS handle slowly changing dimensions (SCDs)?
Ans:
- SSAS manages Slowly Changing Dimensions (SCDs) through specific configurations in dimension properties.
- Techniques such as Type 1 (overwrite), Type 2 (historical tracking), and Type 3 (partial historical tracking) are employed to accommodate changes in dimension attributes over time.
- SSAS ensures data integrity by maintaining historical records, enabling accurate analysis and reporting as dimensional data evolves.
53. What are the best practices for optimizing query performance in SSAS?
Ans:
Achieving optimal query performance in SSAS involves designing efficient cube schemas, optimizing MDX or DAX queries, employing aggregation strategies, and partitioning data effectively. Tuning server and database configurations, minimizing data processing overhead, and using caching mechanisms are also crucial. Regular performance monitoring helps identify bottlenecks and refine query execution, ensuring responsive and scalable SSAS deployments that meet analytical demands.
54. Describe the process of designing a cube schema in SSAS.
Ans:
Designing a cube schema in SSAS entails defining dimensions, measures, hierarchies, and relationships that structure data for multidimensional analysis. It begins with identifying business requirements and data sources, followed by creating dimension tables, defining attribute relationships, and establishing measure groups. The schema design aims to optimize query performance and facilitate intuitive data exploration through well-defined dimensional structures.
55. How does SSAS handle role-based security and what are its limitations?
Ans:
- SSAS implements role-based security to restrict access to data and functionality based on user roles or group memberships.
- It allows administrators to define permissions at cube, dimension, or cell levels, controlling data visibility and user actions like browsing or processing.
- Limitations include complexity in managing numerous roles, potential performance impacts, and the necessity for meticulous planning to avoid security gaps.
56. What is a Measure Group in SSAS and how is it defined?
Ans:
- A measure group in SSAS comprises related measures representing quantitative data for analysis purposes.
- It specifies how measures are stored, aggregated, and presented within cubes or tabular models.
- Measure groups are associated with dimension tables through relationships, facilitating multidimensional analysis across various business metrics.
- They are essential components in SSAS for constructing meaningful analytical models and supporting data-driven decision-making processes based on aggregated and detailed data.
57. Explain the concept of attribute relationships in SSAS.
Ans:
Attribute relationships in SSAS establish hierarchical dependencies within dimensions, optimizing query performance by enabling efficient navigation and aggregation across hierarchies. Well-defined relationships streamline data retrieval, reducing computational overhead during query execution. They ensure data integrity and improve the user experience by allowing intuitive exploration of hierarchical data, enhancing overall analytical capabilities in cubes or tabular models.
58. What are the different types of processing modes available in SSAS?
Ans:
SSAS offers different processing modes like Full, Incremental, and Process Update, determining how data is loaded and processed into cubes or tabular models. Full processing rebuilds structures from scratch, while incremental and process update modes selectively update changed data to enhance processing efficiency. Choosing the appropriate processing mode depends on data freshness requirements, volume, and maintenance schedules, ensuring efficient data management and availability for analytical queries in SSAS environments.
59. How does SSAS integrate with Azure services like Azure SQL Database and Azure Analysis Services?
Ans:
- SSAS seamlessly integrates with Azure services such as Azure SQL Database and Azure Analysis Services to enhance scalability, flexibility, and performance.
- It leverages Azure’s cloud infrastructure to host SSAS instances, enabling elastic scaling and cost-effective resource management.
- Integration supports hybrid scenarios for data storage, analysis, and visualization, ensuring compatibility with modern cloud-based analytics solutions.
60. Describe the process of designing a data mining model in SSAS.
Ans:
- Designing data mining models in SSAS involves defining mining structures, selecting algorithms, and configuring model parameters to extract valuable insights from data.
- The process begins with data preparation and exploration, followed by model creation, training, and validation.
- SSAS supports various data mining algorithms like Decision Trees, Clustering, and Neural Networks, catering to diverse analytical needs.

61. What is the role of a cube designer in SSAS projects?
Ans:
The cube designer in SSAS projects plays a crucial role in designing and defining the structure, dimensions, measures, and hierarchies within the cube. They ensure that the cube meets business requirements for analysis and reporting, optimizing performance and usability. This involves defining relationships between dimensions and measures, setting up aggregations for performance improvement, and configuring security settings for controlled access to cube data.
62. How does SSAS handle dynamic security and what are its considerations?
Ans:
SSAS handles dynamic security through roles and permissions that can be dynamically assigned based on user context or other criteria. Considerations include maintaining performance efficiency despite dynamic security rules, ensuring proper implementation to avoid data leaks or access conflicts, and testing thoroughly to validate security rules across different user scenarios.
63. Explain the concept of a time dimension in SSAS and its importance.
Ans:
- A time dimension in SSAS organizes and categorizes data based on time-related attributes like year, quarter, month, and day.
- It’s essential for analyzing trends, seasonality, and historical data trends over time.
- This dimension allows users to perform time-based comparisons and forecasting, providing valuable insights into business performance and trends.
64. What is the role of the Measure Expression property in SSAS measures?
Ans:
- The Measure Expression property in SSAS measures allows for defining complex calculations and expressions that derive meaningful metrics from raw data.
- It enables the creation of calculated measures based on business rules or specific requirements, enhancing the analytical capabilities of the cube.
- This property supports various functions and operators to manipulate data and perform aggregations as needed.
65. Describe the process of creating a calculated member in SSAS MDX.
Ans:
Creating a calculated member in SSAS MDX involves using MDX (Multidimensional Expressions) to define a new member within a dimension or measure group. This member is derived from existing data using calculations, aggregations, or custom logic defined in MDX scripts. It provides flexibility in creating dynamic metrics or hierarchies that aren’t directly stored in the data source, enhancing analysis capabilities.
66. How does SSAS handle distinct count measures and why are they challenging?
Ans:
SSAS faces challenges with distinct count measures due to their computational complexity and impact on performance. Handling these measures involves optimizing aggregation designs, managing memory and processing resources efficiently, and using appropriate aggregation functions to minimize overhead. Ensuring accurate results across large datasets and complex queries is crucial for maintaining analytical integrity.
67. What is the purpose of the AttributeHierarchyEnabled property in SSAS?
Ans:
- The AttributeHierarchyEnabled property in SSAS determines whether an attribute hierarchy within a dimension is active and available for user navigation and analysis.
- It allows users to drill down or slice data based on attribute values, enhancing interactive analysis capabilities.
- Enabling or disabling attribute hierarchies affects query performance and user experience in navigating cube data.
68. Explain the concept of parent-child hierarchies in Tabular models.
Ans:
- Parent-child hierarchies in Tabular models represent hierarchical relationships where each member can have multiple parent and child relationships.
- They are defined using DAX (Data Analysis Expressions) and are useful for representing organizational structures or recursive relationships in data.
- These hierarchies support drill-down and roll-up operations, enabling flexible analysis and reporting capabilities in Tabular models.
69. How does SSAS handle many-to-many relationships in data modeling?
Ans:
SSAS manages many-to-many relationships in data modeling through bridge tables or intermediate measures that resolve the many-to-many relationship into one-to-many relationships. This approach ensures accurate aggregation and querying of data across related entities, maintaining integrity and consistency in analytical results. Handling many-to-many relationships involves defining appropriate relationships and ensuring efficient query performance.
70. Describe the role of the SSAS Aggregation Design Wizard in cube optimization.
Ans:
The SSAS Aggregation Design Wizard optimizes cube performance by pre-calculating and storing aggregated data based on usage patterns and queries. It analyzes query history and usage statistics to recommend aggregation designs that improve query response times. This wizard automates the creation of aggregations, reducing manual effort and ensuring optimal cube performance for analytical workloads.
71. What is the purpose of the Drillthrough feature in SSAS and when is it used?
Ans:
- Drillthrough allows users to view detailed data underlying summarized results in SSAS cubes.
- It is used when analysts need to investigate specific transactions or records that contribute to aggregated values shown in reports or analyses.
- This feature provides transparency and enhances analytical capabilities by enabling a deeper dive into data points and supporting informed decision-making.
72. Explain the concept of query sub-cubes in SSAS and their benefits.
Ans:
- Query sub-cubes in SSAS are subsets of the main cube that focus on specific dimensions or measures.
- They help optimize query performance by limiting the scope of data retrieval, especially in scenarios where full cube data isn’t required.
- Benefits include faster query response times, reduced resource consumption, and improved user experience through targeted data analysis tailored to specific business needs.
73. How does SSAS handle data security in a distributed environment?
Ans:
SSAS manages data security in distributed environments through role-based security models, encryption, and secure communication protocols. It ensures that only authorized users have access to sensitive data, regardless of where the data resides or how it is accessed. This approach safeguards against unauthorized access, data breaches, and compliance violations, thereby maintaining data integrity and user trust.
74. Describe the process of creating calculated columns in SSAS Tabular models.
Ans:
To create calculated columns in SSAS Tabular models, define expressions using DAX language. These columns derive values dynamically based on other column values or measures, facilitating complex calculations and enhancing data analysis capabilities. Calculated columns are useful for generating new insights, performing custom aggregations, and supporting advanced business logic within Tabular models.
75. What is the role of DirectQuery mode in SSAS Tabular and its implications?
Ans:
- DirectQuery mode in SSAS Tabular allows real-time querying of data stored in underlying data sources without requiring data duplication in the model.
- It enables up-to-date analytics by fetching data directly from the source systems, which is crucial for scenarios where data freshness is paramount.
- However, it may impact query performance depending on the size and complexity of the data and the performance of the source systems.
76. How does SSAS handle key performance indicators (KPIs) in data visualization?
Ans:
- SSAS uses KPIs to measure performance against predefined business goals or targets.
- It visualizes KPIs through scorecards, dashboards, and reports, providing stakeholders with actionable insights into key metrics.
- KPIs are crucial for monitoring business performance, identifying trends, and making informed decisions based on real-time data analysis.
- SSAS ensures KPIs are integrated seamlessly into data visualization tools, enhancing data-driven decision-making processes.
77. Explain the concept of row-level security in SSAS Tabular models and its implementation.
Ans:
Row-level security restricts access to specific rows of data based on user roles and permissions. It ensures that users only see data relevant to their assigned security context, maintaining confidentiality and compliance with data privacy regulations. Implementation involves defining roles and filters in the model to control data visibility, providing granular control over data access while supporting secure data sharing within organizations.
78. Describe the benefits of using the DAX (Data Analysis Expressions) language in SSAS Tabular models.
Ans:
DAX (Data Analysis Expressions) in SSAS Tabular models simplifies complex calculations, enhances data modeling flexibility, and improves query performance. It supports advanced business logic, calculated columns, and measures, enabling sophisticated data analysis and visualization. DAX functions integrate seamlessly with Microsoft Power BI and Excel, facilitating seamless data integration and enhanced reporting capabilities for decision-makers.
79. What are the different processing options available for SSAS Tabular models?
Ans:
- SSAS Tabular models offer several processing options: Full, Incremental, and Process Data.
- Full processing rebuilds the entire model from scratch, ensuring data consistency but requiring more time and resources.
- Incremental processing updates only change data, optimizing performance for large datasets.
- Process Data combines the benefits of both approaches, balancing efficiency with data integrity maintenance during regular updates and maintenance tasks.
80. How does SSAS integrate with Azure Analysis Services and its advantages?
Ans:
- SSAS integrates with Azure Analysis Services to leverage cloud scalability, global accessibility, and cost efficiency.
- Azure Analysis Services provides managed services for deploying and scaling SSAS models in the cloud, offering benefits like elastic scaling, automatic backups, and enhanced security.
- It enables organizations to extend on-premises SSAS capabilities, support hybrid cloud scenarios, and benefit from Azure’s robust ecosystem for advanced analytics and AI integration.
81. Explain the concept of partitioning in SSAS Tabular models and its impact on performance.
Ans:
Partitioning in SSAS Tabular models involves dividing data into manageable segments, and improving query performance by focusing queries on specific partitions rather than the entire dataset. It enhances parallel processing and reduces memory consumption, critical for handling large volumes of data efficiently. Partitioning also facilitates incremental processing, allowing updates to specific partitions without impacting the entire model, thus ensuring faster data refresh and query response times.
82. Describe the process of setting up and managing perspectives in SSAS Tabular models.
Ans:
Perspectives in SSAS Tabular models organize and simplify model access for different user groups by presenting selected tables and columns. To set up perspectives, and define views based on user roles or reporting needs, ensuring focused and relevant data views without creating separate models. Manage perspectives by updating them as business needs evolve, maintaining consistency and usability across various reporting requirements and user roles.
83. What are the benefits of using Power BI with SSAS Tabular models for reporting and analysis?
Ans:
- Power BI leverages SSAS Tabular models for robust reporting and analysis capabilities, offering intuitive data visualization, interactive dashboards, and real-time insights.
- By connecting to SSAS Tabular models, Power BI ensures data consistency and security while enabling seamless integration with diverse data sources.
84. How does SSAS handle data refresh and incremental processing in Tabular models?
Ans:
- SSAS Tabular models support scheduled data refreshes and incremental processing to keep data up-to-date without full model reprocessing. Incremental processing updates only change or new data, optimizing performance and reducing processing time.
- Scheduled refreshes ensure timely data availability for reports and analyses, maintaining data accuracy and relevancy for decision-making processes.
85. Explain the concept of bidirectional cross-filtering in SSAS Tabular models.
Ans:
Bidirectional cross-filtering allows relationships between tables in SSAS Tabular models to filter data in both directions. It enables dynamic filtering based on related tables, supporting complex data analysis scenarios such as analyzing sales performance by product and customer attributes simultaneously. This feature enhances data exploration and drill-through capabilities, providing deeper insights into relationships within the data model.
86. What is the role of the VertiPaq engine in SSAS Tabular models and its benefits?
Ans:
The VertiPaq engine in SSAS Tabular models is an in-memory storage technology that compresses and stores data efficiently. It optimizes query performance by loading data into memory for fast retrieval and calculation. Benefits include reduced storage requirements, faster data access, and improved scalability for handling large datasets and complex analytics queries in real time.
87. Describe the process of designing and implementing a Tabular model in SSAS.
Ans:
- Designing a Tabular model in SSAS involves defining data sources, importing data, creating relationships between tables, and defining measures and calculated columns.
- Implementing the model includes optimizing data storage with VertiPaq, configuring security, and defining perspectives for user-specific views.
- Testing and validating the model ensures data accuracy and performance before deployment.
88. How does SSAS handle schema changes and versioning in Tabular models?
Ans:
- SSAS Tabular models manage schema changes by allowing incremental updates and versioning of model objects. Version control ensures consistency across model revisions, facilitating rollback to previous versions if needed.
- Schema changes are applied through model updates, ensuring data integrity and maintaining compatibility with reporting tools and user queries.
89. What are the different deployment options available for SSAS Tabular models?
Ans:
Deployment options for SSAS Tabular models include on-premises deployment to local servers or cloud-based deployment using services like Azure Analysis Services. Both options offer scalability, security, and accessibility for enterprise-level data modeling and analytics. Deployment methods ensure seamless integration with existing IT infrastructure while supporting data governance and compliance requirements.
90. Explain the concept of in-memory analytics in SSAS Tabular models and its advantages.
Ans:
In-memory analytics in SSAS Tabular models leverages VertiPaq technology to load and process data into memory, enabling rapid data retrieval and analysis. This approach enhances query performance, supports real-time data exploration, and facilitates interactive reporting and dashboarding. In-memory analytics accelerates decision-making by providing instant access to up-to-date insights, improving overall business agility and responsiveness.
91. How does SSAS support integration with third-party visualization tools like Tableau and Qlik?
Ans:
- SSAS supports integration with third-party visualization tools like Tableau and Qlik through OLE DB and ODBC connectors.
- These connectors allow the visualization tools to connect directly to SSAS cubes and tabular models.
- Users can create dashboards and reports using data from SSAS.
- SSAS provides robust MDX and DAX querying capabilities that these tools leverage for advanced analytics.
92. Describe the process of optimizing memory usage in SSAS Tabular models.
Ans:
- Optimizing memory usage in SSAS Tabular models involves monitoring and managing the VertiPaq engine.
- Use data compression techniques to reduce the memory footprint of the model.
- Remove unnecessary columns and reduce the cardinality of high-cardinality columns.
- Utilize partitions to manage data loading and memory consumption more effectively.
93. What are the best practices for improving query performance in SSAS Tabular models?
Ans:
Implement data compression and reduce unnecessary columns to optimize the model. Use calculated columns and measures judiciously to avoid unnecessary calculations during query time. Optimize DAX queries by avoiding complex and inefficient expressions. Partition large tables to enhance processing and query performance. Use aggregations to pre-compute and store summary data for faster retrieval.
94. How does SSAS handle complex calculations and modeling scenarios in Tabular models?
Ans:
SSAS Tabular models use the DAX language for complex calculations and data manipulation. DAX provides powerful functions for creating calculated columns, measures, and tables. Users can implement time intelligence and advanced mathematical, and statistical calculations. The VertiPaq engine optimizes these calculations for high performance. SSAS supports hierarchical and parent-child relationships for complex modeling scenarios.
95. Explain the concept of composite models in SSAS and its benefits for data integration.
Ans:
Composite models in SSAS allow combining data from multiple sources in a single model. This includes both direct query sources and import data sources. Users can build models that leverage the strengths of each data source. It enhances flexibility in data integration and analysis. Composite models enable real-time data access along with pre-aggregated data. This approach optimizes performance and provides a comprehensive view of the data.